


A priority for the WHO by 2020 is to have reduced the rates of suicide; they indicate difficulties in giving precise estimations due to a wide variety of factors, which include aspects related to the statistical measurements themselves of suicidal behaviour. The proportion of deaths from suicide is 8.5% among young people between 15 and 29 years of age.
ObjectiveTo review the methodology used to express the frequency of suicidal behaviour in young people and to describe the methodological characteristics of the studies reviewed.
MethodA systematic review of longitudinal studies registered on PROSPERO. The extracted information included the following: year of publication, journal, population size, sample, country, design, age, percentage of men, follow-up time and losses, suicidal behaviour, risk factors, ethical aspects, fundamentally, evaluating the measures of frequency used.
ResultsEighty-two articles were selected from 37,793 documents. None of the studies define the measure of frequency used for suicidal behaviour, there are currently up to 9 different ways of measuring it. The populations are students or the general population (66%), birth cohorts (16%) and specific groups. Follow-up was from 24 weeks to 30 years. Only 24.1% of the studies took ethical aspects into consideration.
ConclusionsResearchers must make an effort to reach an agreement on the measures of frequency used in suicidal behaviour studies, as the methodological and terminological variability currently used impedes making any comparisons between different studies or understanding the real dimension of the problem.
La OMS prioriza para el año 2020 reducir las tasas de suicidio señalando dificultades para dar estimaciones precisas debido a una amplia variedad de factores, entre ellos, aspectos relativos a la propia medición estadística de la conducta suicida. La proporción de muertes por suicidio es del 8,5% para los jóvenes de entre 15-29 años.
ObjetivoRevisar la metodología empleada para expresar la frecuencia de la conducta suicida en población joven y describir las características metodológicas de los estudios examinados.
MétodoRevisión sistemática de estudios longitudinales registrada en PROSPERO. La información extraída fue: año de publicación, revista, tamaño poblacional, muestra, país, diseño, edad, porcentaje de hombres, tiempo de seguimiento y pérdidas, comportamiento suicida, factores de riesgo, aspectos éticos y evaluándose fundamentalmente las medidas de frecuencia empleadas.
ResultadosSe identificaron 37.793 documentos, de los cuales fueron seleccionados 82. Ningún estudio define la medida de frecuencia empleada para la conducta suicida, encontrándose hasta 9 formas diferentes de medirla. La población son estudiantes o población general (66%), cohortes de nacimiento (16%) y colectivos específicos. El seguimiento fue de 24 semanas hasta 30 años. Solo un 24,1% de los estudios consideró los aspectos éticos.
ConclusionesSe constata que no existe una sistematización a la hora de medir la frecuencia de presentación de la conducta suicida. La variabilidad metodológica y terminológica utilizada dificulta hacer comparaciones entre los estudios y conocer la verdadera dimensión del problema. Se insta a los investigadores a realizar un esfuerzo para consensuar las medidas de frecuencia empleadas en los estudios de cohortes.
Suicidal behaviour constitutes a public health problem and, although it figures among preventable causes of death, it is often of low priority for governments. The latest World Health Organisation (WHO) report1 consequently includes a proposal for an action plan to reduce the rates by 10% by 2020. The proposal prioritises prevention of suicide and suicide attempts in the overall public health agenda and in the public policies of all the countries. The proportion of deaths from suicide varies depending on age, with young people constituting an especially vulnerable group.2 Globally, suicide was estimated in 2006 to represent 7.3% of the deaths in youngsters between 15 and 19 years old, and 0.7% in those between 20 and 24.3 Suicide currently accounts for 8.5% of deaths for external causes and occupies the second place in causes of death (behind traffic accidents)1 in young people aged between 15 and 29 years. The lifetime prevalence of suicide attempts in adolescents in the United States is 4.1%.4 In Europe, this prevalence in similar groups is 4.2%.5 In Spain, the suicide rate per 100,000 inhabitants in young people aged between 15 and 29 years in 2014 was 2.75.6
The WHO feels that giving precise world-wide estimations on suicide rates is complex.1 One reason for this is that there is a lack of international consensus as to the terminology used to assess suicidal behaviour. This issue was partially resolved by Posner et al.,7 who provided the categories of suicidal ideation, suicide attempt and completed suicide. There are also other factors that contribute to this complexity, especially in the case of young people, such as socio-cultural, economic, religious and gender differences,1,8,9 as well as ethnic and geographical differences.10–12 This diversity can cause variability in suicide rates within and between countries.1,13 Another factor intrinsically related to the assessment of suicidal behaviour is measuring its frequency, particularly if we remember that only 35% of the WHO member states have an integral civil registry system with at least 5 years of data.1 All of this has led to a series of recommendations, such as optimising the suicide registry systems1 or using clinical records instead of self-reports, and improving the methodological designs of the various studies.14
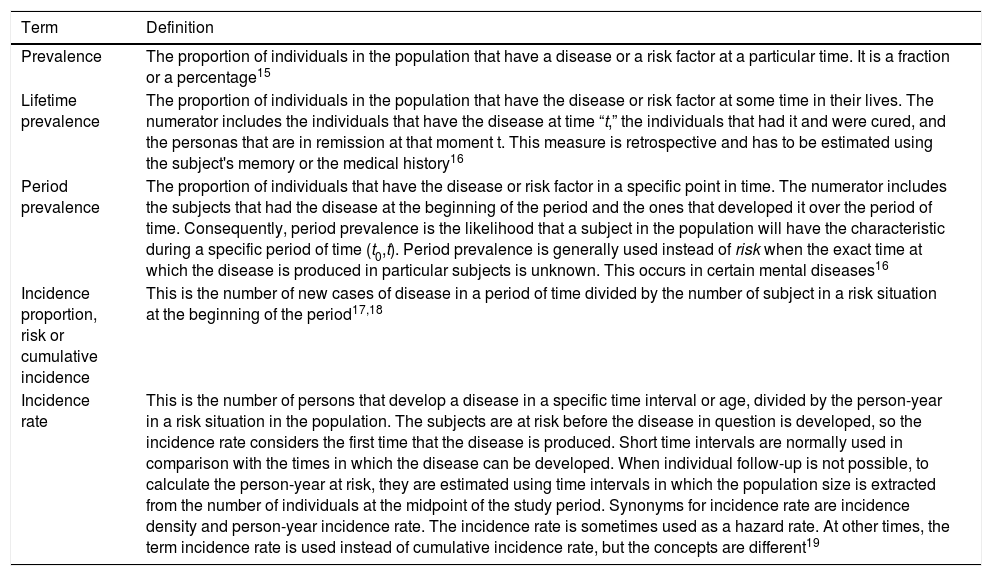
One issue to resolve is how the incidence of suicidal behaviour in young people is distributed in different countries and contexts. To do so, a review of longitudinal studies is needed, evaluating the incidence rates of these phenomena. The problem is that researchers generally calculate ratios of cases over a total number of subjects, which would be a proportion and not a rate, strictly speaking. But in statistics, ratios, proportions and rates are clearly defined and they cannot be used as synonyms. Ratios are indexes, proportions are relative frequencies that can often be used as estimated likelihoods of certain events, and rates describe the speed and pattern of change of a dynamic process.15Table 1 is a summary of the terms and basic definitions that appear in the literature in the context of measuring an epidemiological phenomenon.
Terms and definitions of the different frequency measures in epidemiology.
| Term | Definition |
|---|---|
| Prevalence | The proportion of individuals in the population that have a disease or a risk factor at a particular time. It is a fraction or a percentage15 |
| Lifetime prevalence | The proportion of individuals in the population that have the disease or risk factor at some time in their lives. The numerator includes the individuals that have the disease at time “t,” the individuals that had it and were cured, and the personas that are in remission at that moment t. This measure is retrospective and has to be estimated using the subject's memory or the medical history16 |
| Period prevalence | The proportion of individuals that have the disease or risk factor in a specific point in time. The numerator includes the subjects that had the disease at the beginning of the period and the ones that developed it over the period of time. Consequently, period prevalence is the likelihood that a subject in the population will have the characteristic during a specific period of time (t0,t). Period prevalence is generally used instead of risk when the exact time at which the disease is produced in particular subjects is unknown. This occurs in certain mental diseases16 |
| Incidence proportion, risk or cumulative incidence | This is the number of new cases of disease in a period of time divided by the number of subject in a risk situation at the beginning of the period17,18 |
| Incidence rate | This is the number of persons that develop a disease in a specific time interval or age, divided by the person-year in a risk situation in the population. The subjects are at risk before the disease in question is developed, so the incidence rate considers the first time that the disease is produced. Short time intervals are normally used in comparison with the times in which the disease can be developed. When individual follow-up is not possible, to calculate the person-year at risk, they are estimated using time intervals in which the population size is extracted from the number of individuals at the midpoint of the study period. Synonyms for incidence rate are incidence density and person-year incidence rate. The incidence rate is sometimes used as a hazard rate. At other times, the term incidence rate is used instead of cumulative incidence rate, but the concepts are different19 |
A priori, cohort studies should explicitly define and justify the frequency measurement that has been used to estimate the incidence of suicidal behaviour in young people. In carrying out a systematic review20 to assess different risk factors in suicidal behaviour,21 we have posed the question of how appropriate and well defined measures used are. As far as we know, there are no studies that review what the frequency measures used in this type of studies are, what definitions the studies provide for these measures, and how the use of different measures can impact the variability of estimation and, consequently, the comparison of figures.
This was a systematic review of longitudinal studies on suicidal behaviour in young people with the general objective of analysing how frequency was measured. The specific objectives were as follows: (1) ascertain whether the different studies contain a formal definition of the measures used to estimate the frequency of suicidal behaviour (suicide, attempt and ideation) in juveniles; (2) present the basic methodological aspects, for each study, that complement the measurement data; and (3) when applicable, infer and define the measures used, supplying the figures obtained in the different studies and assessing whether the estimation took risk factors into consideration.
MethodWe present a critical review of the measures of frequency of suicidal behaviour in young people in longitudinal studies from the systematic review registered in PROSPERO22 (Ref: CRD42013005775). This version of PROSPERO was updated with studies published up to 2015 for use in this study.
First of all, the documents were selected using MeSH-type descriptors22,23 (longitudinal studies, risk, deliberate self-harm, antecedent, association, suicide, etc.). The Cochrane Library, Embase, Medline and PsycINFO databases and the Web of Science were searched. In addition, the OpenGrey database was searched. The search was then expanded using manual methods that identified 212 references from 254 books and journals. No restrictions as to language of publication were applied. At least 3 attempts were made to contact authors of articles written in languages other than English or Spanish.
Our criteria for inclusion of the documents in a first systematic review were as follows: (1) contain suicide or suicide attempt as a dependent variable; (2) contain at least 1 associated risk factor (neuroimaging, genetic and neurobiological studies were excluded); (3) population with an age initially between 12 and 26 years; (4) longitudinal studies of base population (non-clinical or non-institutionalised samples or case-control studies in which the control group had the same age range and both were non-clinical and non-institutionalised groups). Studies centred on institutionalised clinical samples were excluded to ensure that the results could be generalised to a youth population. Based on an expert group consensus, suicide was defined as any fatal action performed with the objective of terminating one's own life; a suicide attempt was defined as any self-harming action with the intent of dying.
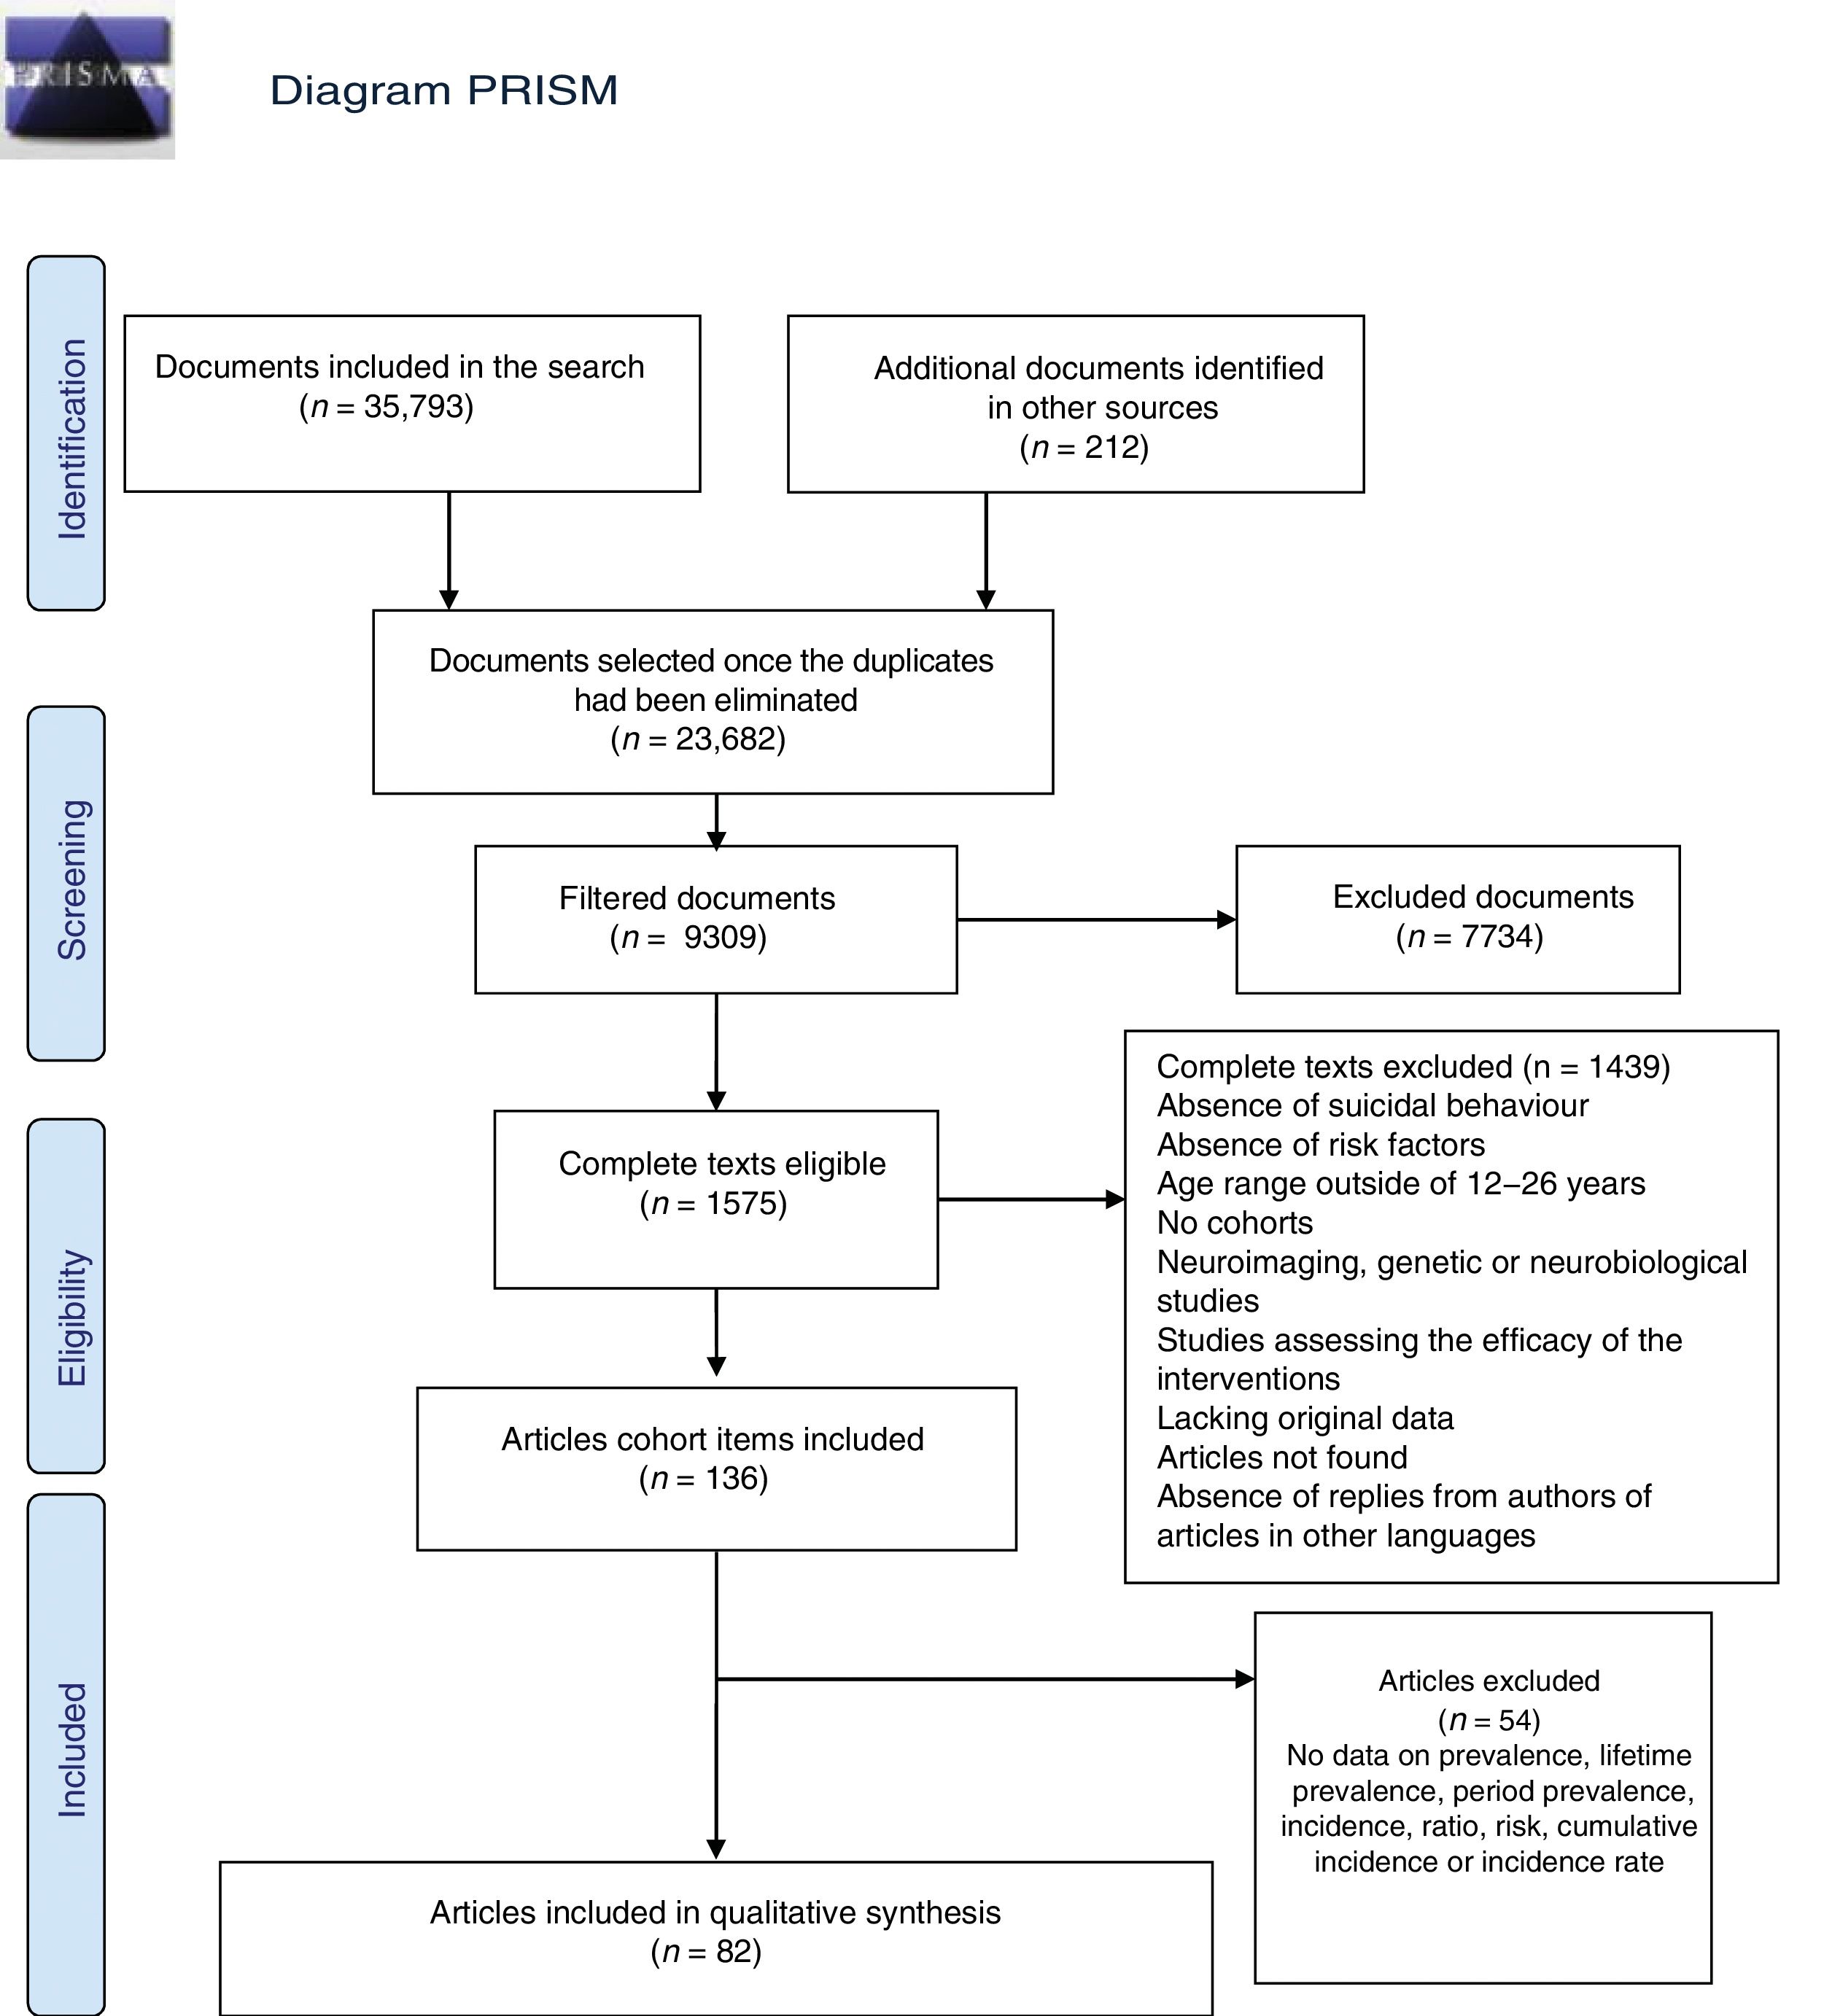
In the end, 37,793 documents were identified. Once the duplicates were eliminated, there were 23,682 left.
The second step was a filtered selection, ascertaining whether the documents that had been included satisfied the selection criteria strictly. This was performed by a multidisciplinary team of psychiatrists, psychologists, statisticians, epidemiologists and public health professionals, forming 5 groups of independent reviewers; all the references were assigned to the reviewers. They first screened only the titles, using the terms described in PROSPERO.22 If there was a discrepancy between reviews, the reference was included. Afterwards, the abstract was reviewed and then the complete text; a third independent reviewer resolved any discrepancies that arose. During the review of titles and abstracts, the reviewers had no access to author name(s), journal and year of publication, so as to eliminate selection bias. Using these criteria, 1575 studies were identified.
In third place, to prepare this article, the following specific selection criteria were applied to these last studies: (1) that they were only solo cohort studies addressing suicide or suicide attempt, evaluating the possible presence of suicidal ideation; (2) that the study population fell within the age range; and (3) that the study included some type of measure of frequency of any of the entities noted. Initially, 136 studies were chosen; of these, 54 did not satisfy the third criterion, so a total of 82 articles were included for our review (Fig. 1).

The following information was extracted from each article: (a) year of publication; (b) journal; (c) population size; (d) age range; (e) mean age; (f) percentage of males; (g) country; (h) study design; (i) sample recruited; (j) follow-up time; (k) number lost to follow-up; (l) suicidal behaviour; (m) measure of frequency; and (n) mean of frequency with respect to risk factor, if applicable. If the studies analysed various age groups, the group of young adolescents was selected. The losses to follow-up were calculated as the difference between the number of eligible in the study and those that reached the end of the study period.
If there was more than 1 event evaluation time in a study, the data from the last one were included. When frequency was analysed by risk factors and it was categorised, we expressed only the minimum and maximum values obtained.
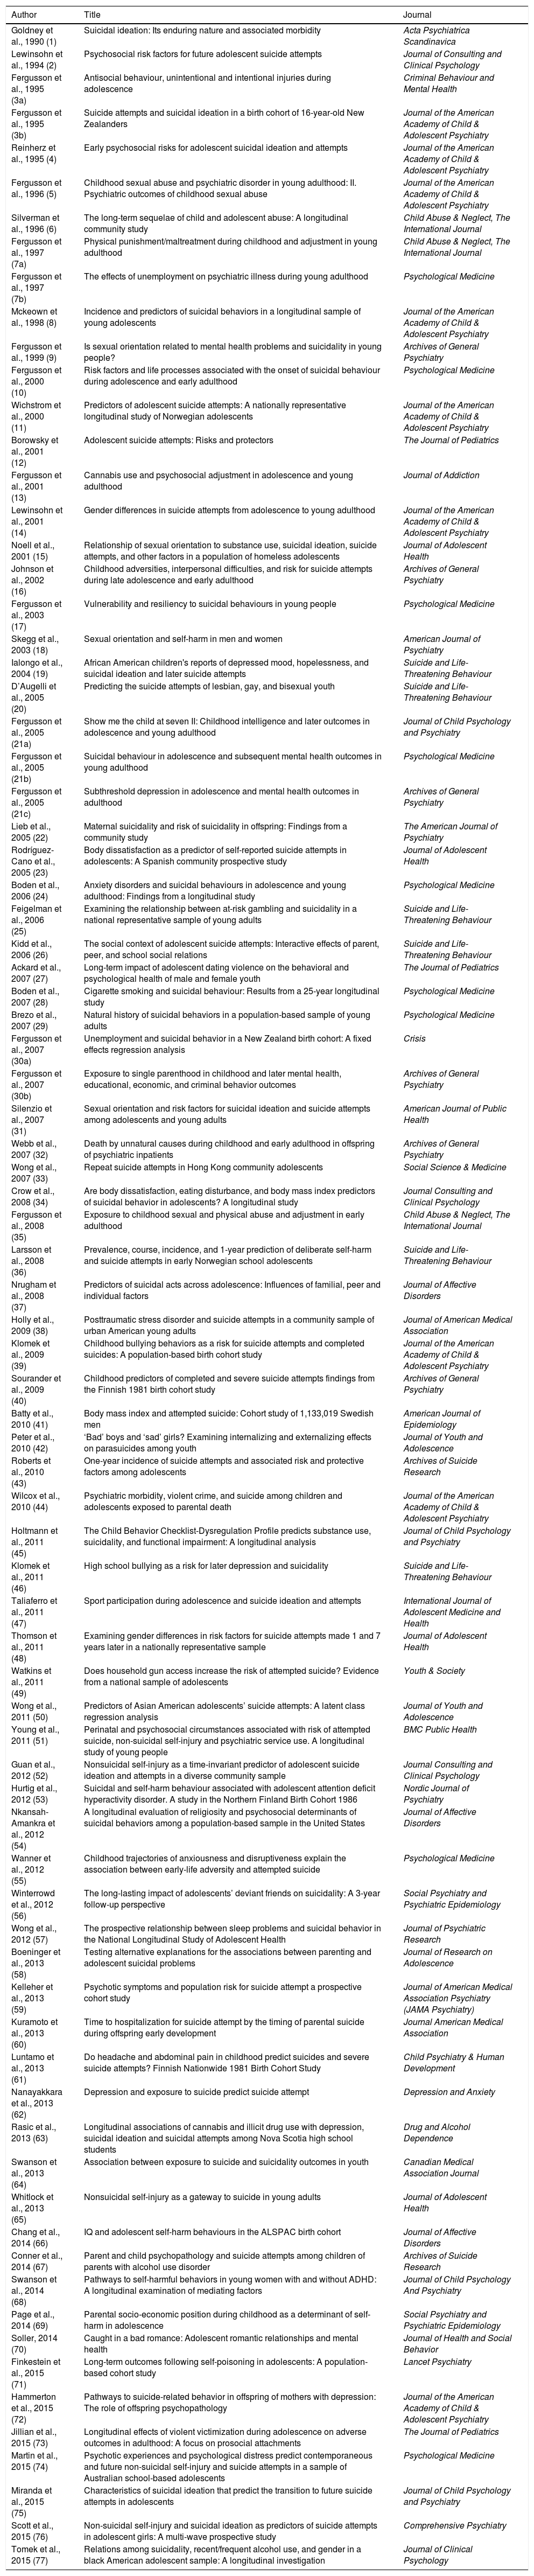
ResultsA total of 37,793 documents were identified. Of these, we analysed 82 articles on studies performed in 13 countries around the world for this review. By country, 42 studies were carried out in America, 20 in Oceania, 19 in Europe and 1 in Asia. Table 2 lists the first author, the year of publication, the title and the journal in which each study was published, for all 82 articles.
Articles included in the review, ordered chronologically.
| Author | Title | Journal |
|---|---|---|
| Goldney et al., 1990 (1) | Suicidal ideation: Its enduring nature and associated morbidity | Acta Psychiatrica Scandinavica |
| Lewinsohn et al., 1994 (2) | Psychosocial risk factors for future adolescent suicide attempts | Journal of Consulting and Clinical Psychology |
| Fergusson et al., 1995 (3a) | Antisocial behaviour, unintentional and intentional injuries during adolescence | Criminal Behaviour and Mental Health |
| Fergusson et al., 1995 (3b) | Suicide attempts and suicidal ideation in a birth cohort of 16-year-old New Zealanders | Journal of the American Academy of Child & Adolescent Psychiatry |
| Reinherz et al., 1995 (4) | Early psychosocial risks for adolescent suicidal ideation and attempts | Journal of the American Academy of Child & Adolescent Psychiatry |
| Fergusson et al., 1996 (5) | Childhood sexual abuse and psychiatric disorder in young adulthood: II. Psychiatric outcomes of childhood sexual abuse | Journal of the American Academy of Child & Adolescent Psychiatry |
| Silverman et al., 1996 (6) | The long-term sequelae of child and adolescent abuse: A longitudinal community study | Child Abuse & Neglect, The International Journal |
| Fergusson et al., 1997 (7a) | Physical punishment/maltreatment during childhood and adjustment in young adulthood | Child Abuse & Neglect, The International Journal |
| Fergusson et al., 1997 (7b) | The effects of unemployment on psychiatric illness during young adulthood | Psychological Medicine |
| Mckeown et al., 1998 (8) | Incidence and predictors of suicidal behaviors in a longitudinal sample of young adolescents | Journal of the American Academy of Child & Adolescent Psychiatry |
| Fergusson et al., 1999 (9) | Is sexual orientation related to mental health problems and suicidality in young people? | Archives of General Psychiatry |
| Fergusson et al., 2000 (10) | Risk factors and life processes associated with the onset of suicidal behaviour during adolescence and early adulthood | Psychological Medicine |
| Wichstrom et al., 2000 (11) | Predictors of adolescent suicide attempts: A nationally representative longitudinal study of Norwegian adolescents | Journal of the American Academy of Child & Adolescent Psychiatry |
| Borowsky et al., 2001 (12) | Adolescent suicide attempts: Risks and protectors | The Journal of Pediatrics |
| Fergusson et al., 2001 (13) | Cannabis use and psychosocial adjustment in adolescence and young adulthood | Journal of Addiction |
| Lewinsohn et al., 2001 (14) | Gender differences in suicide attempts from adolescence to young adulthood | Journal of the American Academy of Child & Adolescent Psychiatry |
| Noell et al., 2001 (15) | Relationship of sexual orientation to substance use, suicidal ideation, suicide attempts, and other factors in a population of homeless adolescents | Journal of Adolescent Health |
| Johnson et al., 2002 (16) | Childhood adversities, interpersonal difficulties, and risk for suicide attempts during late adolescence and early adulthood | Archives of General Psychiatry |
| Fergusson et al., 2003 (17) | Vulnerability and resiliency to suicidal behaviours in young people | Psychological Medicine |
| Skegg et al., 2003 (18) | Sexual orientation and self-harm in men and women | American Journal of Psychiatry |
| Ialongo et al., 2004 (19) | African American children's reports of depressed mood, hopelessness, and suicidal ideation and later suicide attempts | Suicide and Life-Threatening Behaviour |
| D’Augelli et al., 2005 (20) | Predicting the suicide attempts of lesbian, gay, and bisexual youth | Suicide and Life-Threatening Behaviour |
| Fergusson et al., 2005 (21a) | Show me the child at seven II: Childhood intelligence and later outcomes in adolescence and young adulthood | Journal of Child Psychology and Psychiatry |
| Fergusson et al., 2005 (21b) | Suicidal behaviour in adolescence and subsequent mental health outcomes in young adulthood | Psychological Medicine |
| Fergusson et al., 2005 (21c) | Subthreshold depression in adolescence and mental health outcomes in adulthood | Archives of General Psychiatry |
| Lieb et al., 2005 (22) | Maternal suicidality and risk of suicidality in offspring: Findings from a community study | The American Journal of Psychiatry |
| Rodríguez-Cano et al., 2005 (23) | Body dissatisfaction as a predictor of self-reported suicide attempts in adolescents: A Spanish community prospective study | Journal of Adolescent Health |
| Boden et al., 2006 (24) | Anxiety disorders and suicidal behaviours in adolescence and young adulthood: Findings from a longitudinal study | Psychological Medicine |
| Feigelman et al., 2006 (25) | Examining the relationship between at-risk gambling and suicidality in a national representative sample of young adults | Suicide and Life-Threatening Behaviour |
| Kidd et al., 2006 (26) | The social context of adolescent suicide attempts: Interactive effects of parent, peer, and school social relations | Suicide and Life-Threatening Behaviour |
| Ackard et al., 2007 (27) | Long-term impact of adolescent dating violence on the behavioral and psychological health of male and female youth | The Journal of Pediatrics |
| Boden et al., 2007 (28) | Cigarette smoking and suicidal behaviour: Results from a 25-year longitudinal study | Psychological Medicine |
| Brezo et al., 2007 (29) | Natural history of suicidal behaviors in a population-based sample of young adults | Psychological Medicine |
| Fergusson et al., 2007 (30a) | Unemployment and suicidal behavior in a New Zealand birth cohort: A fixed effects regression analysis | Crisis |
| Fergusson et al., 2007 (30b) | Exposure to single parenthood in childhood and later mental health, educational, economic, and criminal behavior outcomes | Archives of General Psychiatry |
| Silenzio et al., 2007 (31) | Sexual orientation and risk factors for suicidal ideation and suicide attempts among adolescents and young adults | American Journal of Public Health |
| Webb et al., 2007 (32) | Death by unnatural causes during childhood and early adulthood in offspring of psychiatric inpatients | Archives of General Psychiatry |
| Wong et al., 2007 (33) | Repeat suicide attempts in Hong Kong community adolescents | Social Science & Medicine |
| Crow et al., 2008 (34) | Are body dissatisfaction, eating disturbance, and body mass index predictors of suicidal behavior in adolescents? A longitudinal study | Journal Consulting and Clinical Psychology |
| Fergusson et al., 2008 (35) | Exposure to childhood sexual and physical abuse and adjustment in early adulthood | Child Abuse & Neglect, The International Journal |
| Larsson et al., 2008 (36) | Prevalence, course, incidence, and 1-year prediction of deliberate self-harm and suicide attempts in early Norwegian school adolescents | Suicide and Life-Threatening Behaviour |
| Nrugham et al., 2008 (37) | Predictors of suicidal acts across adolescence: Influences of familial, peer and individual factors | Journal of Affective Disorders |
| Holly et al., 2009 (38) | Posttraumatic stress disorder and suicide attempts in a community sample of urban American young adults | Journal of American Medical Association |
| Klomek et al., 2009 (39) | Childhood bullying behaviors as a risk for suicide attempts and completed suicides: A population-based birth cohort study | Journal of the American Academy of Child & Adolescent Psychiatry |
| Sourander et al., 2009 (40) | Childhood predictors of completed and severe suicide attempts findings from the Finnish 1981 birth cohort study | Archives of General Psychiatry |
| Batty et al., 2010 (41) | Body mass index and attempted suicide: Cohort study of 1,133,019 Swedish men | American Journal of Epidemiology |
| Peter et al., 2010 (42) | ‘Bad’ boys and ‘sad’ girls? Examining internalizing and externalizing effects on parasuicides among youth | Journal of Youth and Adolescence |
| Roberts et al., 2010 (43) | One-year incidence of suicide attempts and associated risk and protective factors among adolescents | Archives of Suicide Research |
| Wilcox et al., 2010 (44) | Psychiatric morbidity, violent crime, and suicide among children and adolescents exposed to parental death | Journal of the American Academy of Child & Adolescent Psychiatry |
| Holtmann et al., 2011 (45) | The Child Behavior Checklist-Dysregulation Profile predicts substance use, suicidality, and functional impairment: A longitudinal analysis | Journal of Child Psychology and Psychiatry |
| Klomek et al., 2011 (46) | High school bullying as a risk for later depression and suicidality | Suicide and Life-Threatening Behaviour |
| Taliaferro et al., 2011 (47) | Sport participation during adolescence and suicide ideation and attempts | International Journal of Adolescent Medicine and Health |
| Thomson et al., 2011 (48) | Examining gender differences in risk factors for suicide attempts made 1 and 7 years later in a nationally representative sample | Journal of Adolescent Health |
| Watkins et al., 2011 (49) | Does household gun access increase the risk of attempted suicide? Evidence from a national sample of adolescents | Youth & Society |
| Wong et al., 2011 (50) | Predictors of Asian American adolescents’ suicide attempts: A latent class regression analysis | Journal of Youth and Adolescence |
| Young et al., 2011 (51) | Perinatal and psychosocial circumstances associated with risk of attempted suicide, non-suicidal self-injury and psychiatric service use. A longitudinal study of young people | BMC Public Health |
| Guan et al., 2012 (52) | Nonsuicidal self-injury as a time-invariant predictor of adolescent suicide ideation and attempts in a diverse community sample | Journal Consulting and Clinical Psychology |
| Hurtig et al., 2012 (53) | Suicidal and self-harm behaviour associated with adolescent attention deficit hyperactivity disorder. A study in the Northern Finland Birth Cohort 1986 | Nordic Journal of Psychiatry |
| Nkansah-Amankra et al., 2012 (54) | A longitudinal evaluation of religiosity and psychosocial determinants of suicidal behaviors among a population-based sample in the United States | Journal of Affective Disorders |
| Wanner et al., 2012 (55) | Childhood trajectories of anxiousness and disruptiveness explain the association between early-life adversity and attempted suicide | Psychological Medicine |
| Winterrowd et al., 2012 (56) | The long-lasting impact of adolescents’ deviant friends on suicidality: A 3-year follow-up perspective | Social Psychiatry and Psychiatric Epidemiology |
| Wong et al., 2012 (57) | The prospective relationship between sleep problems and suicidal behavior in the National Longitudinal Study of Adolescent Health | Journal of Psychiatric Research |
| Boeninger et al., 2013 (58) | Testing alternative explanations for the associations between parenting and adolescent suicidal problems | Journal of Research on Adolescence |
| Kelleher et al., 2013 (59) | Psychotic symptoms and population risk for suicide attempt a prospective cohort study | Journal of American Medical Association Psychiatry (JAMA Psychiatry) |
| Kuramoto et al., 2013 (60) | Time to hospitalization for suicide attempt by the timing of parental suicide during offspring early development | Journal American Medical Association |
| Luntamo et al., 2013 (61) | Do headache and abdominal pain in childhood predict suicides and severe suicide attempts? Finnish Nationwide 1981 Birth Cohort Study | Child Psychiatry & Human Development |
| Nanayakkara et al., 2013 (62) | Depression and exposure to suicide predict suicide attempt | Depression and Anxiety |
| Rasic et al., 2013 (63) | Longitudinal associations of cannabis and illicit drug use with depression, suicidal ideation and suicidal attempts among Nova Scotia high school students | Drug and Alcohol Dependence |
| Swanson et al., 2013 (64) | Association between exposure to suicide and suicidality outcomes in youth | Canadian Medical Association Journal |
| Whitlock et al., 2013 (65) | Nonsuicidal self-injury as a gateway to suicide in young adults | Journal of Adolescent Health |
| Chang et al., 2014 (66) | IQ and adolescent self-harm behaviours in the ALSPAC birth cohort | Journal of Affective Disorders |
| Conner et al., 2014 (67) | Parent and child psychopathology and suicide attempts among children of parents with alcohol use disorder | Archives of Suicide Research |
| Swanson et al., 2014 (68) | Pathways to self-harmful behaviors in young women with and without ADHD: A longitudinal examination of mediating factors | Journal of Child Psychology And Psychiatry |
| Page et al., 2014 (69) | Parental socio-economic position during childhood as a determinant of self-harm in adolescence | Social Psychiatry and Psychiatric Epidemiology |
| Soller, 2014 (70) | Caught in a bad romance: Adolescent romantic relationships and mental health | Journal of Health and Social Behavior |
| Finkestein et al., 2015 (71) | Long-term outcomes following self-poisoning in adolescents: A population-based cohort study | Lancet Psychiatry |
| Hammerton et al., 2015 (72) | Pathways to suicide-related behavior in offspring of mothers with depression: The role of offspring psychopathology | Journal of the American Academy of Child & Adolescent Psychiatry |
| Jillian et al., 2015 (73) | Longitudinal effects of violent victimization during adolescence on adverse outcomes in adulthood: A focus on prosocial attachments | The Journal of Pediatrics |
| Martin et al., 2015 (74) | Psychotic experiences and psychological distress predict contemporaneous and future non-suicidal self-injury and suicide attempts in a sample of Australian school-based adolescents | Psychological Medicine |
| Miranda et al., 2015 (75) | Characteristics of suicidal ideation that predict the transition to future suicide attempts in adolescents | Journal of Child Psychology and Psychiatry |
| Scott et al., 2015 (76) | Non-suicidal self-injury and suicidal ideation as predictors of suicide attempts in adolescent girls: A multi-wave prospective study | Comprehensive Psychiatry |
| Tomek et al., 2015 (77) | Relations among suicidality, recent/frequent alcohol use, and gender in a black American adolescent sample: A longitudinal investigation | Journal of Clinical Psychology |
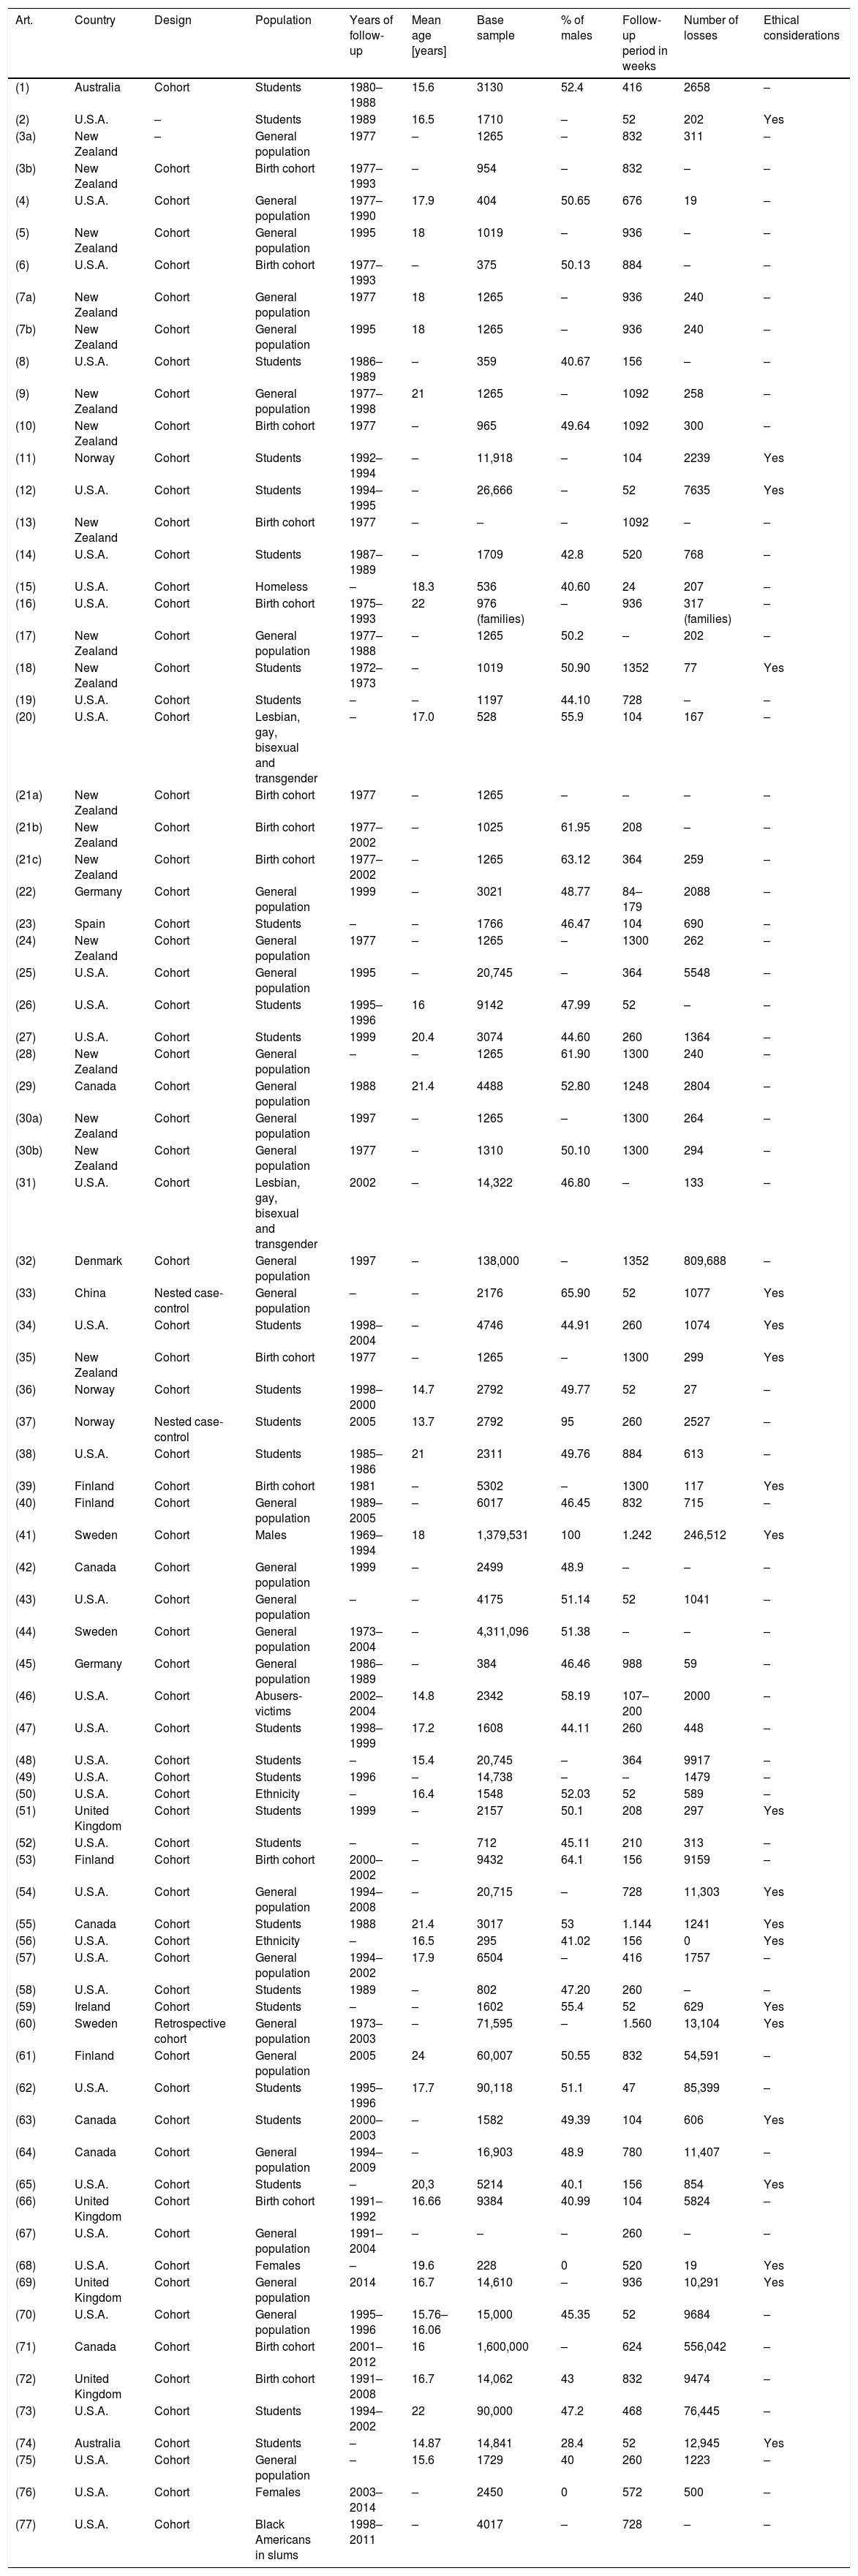
Among the cohort studies included, there were 2 in which it was impossible to establish the design strictly. In addition, 2 presented a nested case-control study and 1 was a retrospective (historical) cohort design. Table 3 presents the basic methodological characteristics of each of the studies, as well as the country in which the research was performed.
Main characteristics of the articles selected.
| Art. | Country | Design | Population | Years of follow-up | Mean age [years] | Base sample | % of males | Follow-up period in weeks | Number of losses | Ethical considerations |
|---|---|---|---|---|---|---|---|---|---|---|
| (1) | Australia | Cohort | Students | 1980–1988 | 15.6 | 3130 | 52.4 | 416 | 2658 | – |
| (2) | U.S.A. | – | Students | 1989 | 16.5 | 1710 | – | 52 | 202 | Yes |
| (3a) | New Zealand | – | General population | 1977 | – | 1265 | – | 832 | 311 | – |
| (3b) | New Zealand | Cohort | Birth cohort | 1977–1993 | – | 954 | – | 832 | – | – |
| (4) | U.S.A. | Cohort | General population | 1977–1990 | 17.9 | 404 | 50.65 | 676 | 19 | – |
| (5) | New Zealand | Cohort | General population | 1995 | 18 | 1019 | – | 936 | – | – |
| (6) | U.S.A. | Cohort | Birth cohort | 1977–1993 | – | 375 | 50.13 | 884 | – | – |
| (7a) | New Zealand | Cohort | General population | 1977 | 18 | 1265 | – | 936 | 240 | – |
| (7b) | New Zealand | Cohort | General population | 1995 | 18 | 1265 | – | 936 | 240 | – |
| (8) | U.S.A. | Cohort | Students | 1986–1989 | – | 359 | 40.67 | 156 | – | – |
| (9) | New Zealand | Cohort | General population | 1977–1998 | 21 | 1265 | – | 1092 | 258 | – |
| (10) | New Zealand | Cohort | Birth cohort | 1977 | – | 965 | 49.64 | 1092 | 300 | – |
| (11) | Norway | Cohort | Students | 1992–1994 | – | 11,918 | – | 104 | 2239 | Yes |
| (12) | U.S.A. | Cohort | Students | 1994–1995 | – | 26,666 | – | 52 | 7635 | Yes |
| (13) | New Zealand | Cohort | Birth cohort | 1977 | – | – | – | 1092 | – | – |
| (14) | U.S.A. | Cohort | Students | 1987–1989 | – | 1709 | 42.8 | 520 | 768 | – |
| (15) | U.S.A. | Cohort | Homeless | – | 18.3 | 536 | 40.60 | 24 | 207 | – |
| (16) | U.S.A. | Cohort | Birth cohort | 1975–1993 | 22 | 976 (families) | – | 936 | 317 (families) | – |
| (17) | New Zealand | Cohort | General population | 1977–1988 | – | 1265 | 50.2 | – | 202 | – |
| (18) | New Zealand | Cohort | Students | 1972–1973 | – | 1019 | 50.90 | 1352 | 77 | Yes |
| (19) | U.S.A. | Cohort | Students | – | – | 1197 | 44.10 | 728 | – | – |
| (20) | U.S.A. | Cohort | Lesbian, gay, bisexual and transgender | – | 17.0 | 528 | 55.9 | 104 | 167 | – |
| (21a) | New Zealand | Cohort | Birth cohort | 1977 | – | 1265 | – | – | – | – |
| (21b) | New Zealand | Cohort | Birth cohort | 1977–2002 | – | 1025 | 61.95 | 208 | – | – |
| (21c) | New Zealand | Cohort | Birth cohort | 1977–2002 | – | 1265 | 63.12 | 364 | 259 | – |
| (22) | Germany | Cohort | General population | 1999 | – | 3021 | 48.77 | 84–179 | 2088 | – |
| (23) | Spain | Cohort | Students | – | – | 1766 | 46.47 | 104 | 690 | – |
| (24) | New Zealand | Cohort | General population | 1977 | – | 1265 | – | 1300 | 262 | – |
| (25) | U.S.A. | Cohort | General population | 1995 | – | 20,745 | – | 364 | 5548 | – |
| (26) | U.S.A. | Cohort | Students | 1995–1996 | 16 | 9142 | 47.99 | 52 | – | – |
| (27) | U.S.A. | Cohort | Students | 1999 | 20.4 | 3074 | 44.60 | 260 | 1364 | – |
| (28) | New Zealand | Cohort | General population | – | – | 1265 | 61.90 | 1300 | 240 | – |
| (29) | Canada | Cohort | General population | 1988 | 21.4 | 4488 | 52.80 | 1248 | 2804 | – |
| (30a) | New Zealand | Cohort | General population | 1997 | – | 1265 | – | 1300 | 264 | – |
| (30b) | New Zealand | Cohort | General population | 1977 | – | 1310 | 50.10 | 1300 | 294 | – |
| (31) | U.S.A. | Cohort | Lesbian, gay, bisexual and transgender | 2002 | – | 14,322 | 46.80 | – | 133 | – |
| (32) | Denmark | Cohort | General population | 1997 | – | 138,000 | – | 1352 | 809,688 | – |
| (33) | China | Nested case-control | General population | – | – | 2176 | 65.90 | 52 | 1077 | Yes |
| (34) | U.S.A. | Cohort | Students | 1998–2004 | – | 4746 | 44.91 | 260 | 1074 | Yes |
| (35) | New Zealand | Cohort | Birth cohort | 1977 | – | 1265 | – | 1300 | 299 | Yes |
| (36) | Norway | Cohort | Students | 1998–2000 | 14.7 | 2792 | 49.77 | 52 | 27 | – |
| (37) | Norway | Nested case-control | Students | 2005 | 13.7 | 2792 | 95 | 260 | 2527 | – |
| (38) | U.S.A. | Cohort | Students | 1985–1986 | 21 | 2311 | 49.76 | 884 | 613 | – |
| (39) | Finland | Cohort | Birth cohort | 1981 | – | 5302 | – | 1300 | 117 | Yes |
| (40) | Finland | Cohort | General population | 1989–2005 | – | 6017 | 46.45 | 832 | 715 | – |
| (41) | Sweden | Cohort | Males | 1969–1994 | 18 | 1,379,531 | 100 | 1.242 | 246,512 | Yes |
| (42) | Canada | Cohort | General population | 1999 | – | 2499 | 48.9 | – | – | – |
| (43) | U.S.A. | Cohort | General population | – | – | 4175 | 51.14 | 52 | 1041 | – |
| (44) | Sweden | Cohort | General population | 1973–2004 | – | 4,311,096 | 51.38 | – | – | – |
| (45) | Germany | Cohort | General population | 1986–1989 | – | 384 | 46.46 | 988 | 59 | – |
| (46) | U.S.A. | Cohort | Abusers-victims | 2002–2004 | 14.8 | 2342 | 58.19 | 107–200 | 2000 | – |
| (47) | U.S.A. | Cohort | Students | 1998–1999 | 17.2 | 1608 | 44.11 | 260 | 448 | – |
| (48) | U.S.A. | Cohort | Students | – | 15.4 | 20,745 | – | 364 | 9917 | – |
| (49) | U.S.A. | Cohort | Students | 1996 | – | 14,738 | – | – | 1479 | – |
| (50) | U.S.A. | Cohort | Ethnicity | – | 16.4 | 1548 | 52.03 | 52 | 589 | – |
| (51) | United Kingdom | Cohort | Students | 1999 | – | 2157 | 50.1 | 208 | 297 | Yes |
| (52) | U.S.A. | Cohort | Students | – | – | 712 | 45.11 | 210 | 313 | – |
| (53) | Finland | Cohort | Birth cohort | 2000–2002 | – | 9432 | 64.1 | 156 | 9159 | – |
| (54) | U.S.A. | Cohort | General population | 1994–2008 | – | 20,715 | – | 728 | 11,303 | Yes |
| (55) | Canada | Cohort | Students | 1988 | 21.4 | 3017 | 53 | 1.144 | 1241 | Yes |
| (56) | U.S.A. | Cohort | Ethnicity | – | 16.5 | 295 | 41.02 | 156 | 0 | Yes |
| (57) | U.S.A. | Cohort | General population | 1994–2002 | 17.9 | 6504 | – | 416 | 1757 | – |
| (58) | U.S.A. | Cohort | Students | 1989 | – | 802 | 47.20 | 260 | – | – |
| (59) | Ireland | Cohort | Students | – | – | 1602 | 55.4 | 52 | 629 | Yes |
| (60) | Sweden | Retrospective cohort | General population | 1973–2003 | – | 71,595 | – | 1.560 | 13,104 | Yes |
| (61) | Finland | Cohort | General population | 2005 | 24 | 60,007 | 50.55 | 832 | 54,591 | – |
| (62) | U.S.A. | Cohort | Students | 1995–1996 | 17.7 | 90,118 | 51.1 | 47 | 85,399 | – |
| (63) | Canada | Cohort | Students | 2000–2003 | – | 1582 | 49.39 | 104 | 606 | Yes |
| (64) | Canada | Cohort | General population | 1994–2009 | – | 16,903 | 48.9 | 780 | 11,407 | – |
| (65) | U.S.A. | Cohort | Students | – | 20,3 | 5214 | 40.1 | 156 | 854 | Yes |
| (66) | United Kingdom | Cohort | Birth cohort | 1991–1992 | 16.66 | 9384 | 40.99 | 104 | 5824 | – |
| (67) | U.S.A. | Cohort | General population | 1991–2004 | – | – | – | 260 | – | – |
| (68) | U.S.A. | Cohort | Females | – | 19.6 | 228 | 0 | 520 | 19 | Yes |
| (69) | United Kingdom | Cohort | General population | 2014 | 16.7 | 14,610 | – | 936 | 10,291 | Yes |
| (70) | U.S.A. | Cohort | General population | 1995–1996 | 15.76–16.06 | 15,000 | 45.35 | 52 | 9684 | – |
| (71) | Canada | Cohort | Birth cohort | 2001–2012 | 16 | 1,600,000 | – | 624 | 556,042 | – |
| (72) | United Kingdom | Cohort | Birth cohort | 1991–2008 | 16.7 | 14,062 | 43 | 832 | 9474 | – |
| (73) | U.S.A. | Cohort | Students | 1994–2002 | 22 | 90,000 | 47.2 | 468 | 76,445 | – |
| (74) | Australia | Cohort | Students | – | 14.87 | 14,841 | 28.4 | 52 | 12,945 | Yes |
| (75) | U.S.A. | Cohort | General population | – | 15.6 | 1729 | 40 | 260 | 1223 | – |
| (76) | U.S.A. | Cohort | Females | 2003–2014 | – | 2450 | 0 | 572 | 500 | – |
| (77) | U.S.A. | Cohort | Black Americans in slums | 1998–2011 | – | 4017 | – | 728 | – | – |
As for the type of population studied, in the majority of the studies there was a follow-up on the general population (in 36.1% of the cases), students (33.7%) and birth cohorts (16.9%). In the remaining cases (13.3%), the subjects were distributed in specific groups: homeless people; gay, lesbian, bisexual and transgender individuals; males; abusers and victims; specific ethnicities; females; and Black Americans in slums. Because a population aged between 12 and 26 years was one of the inclusion criteria, the mean age in the articles selected ranged between 13.7 and 24 years. By gender, there were 2 studies that contained only females and 1 in which the sample was formed exclusively by males; in the remaining studies, the percentage of males included in each study ranged between 28.4% and 65.9%. The range of weeks of follow-up went from 24 to 1560 weeks [30 years]. Whether ethical issues were taken into consideration was specified in only 24.1% of the studies analysed. The number of individuals that comprised each study can be calculated as the difference between the number of individuals in the base sample and the number of losses to follow-up registered during the study.
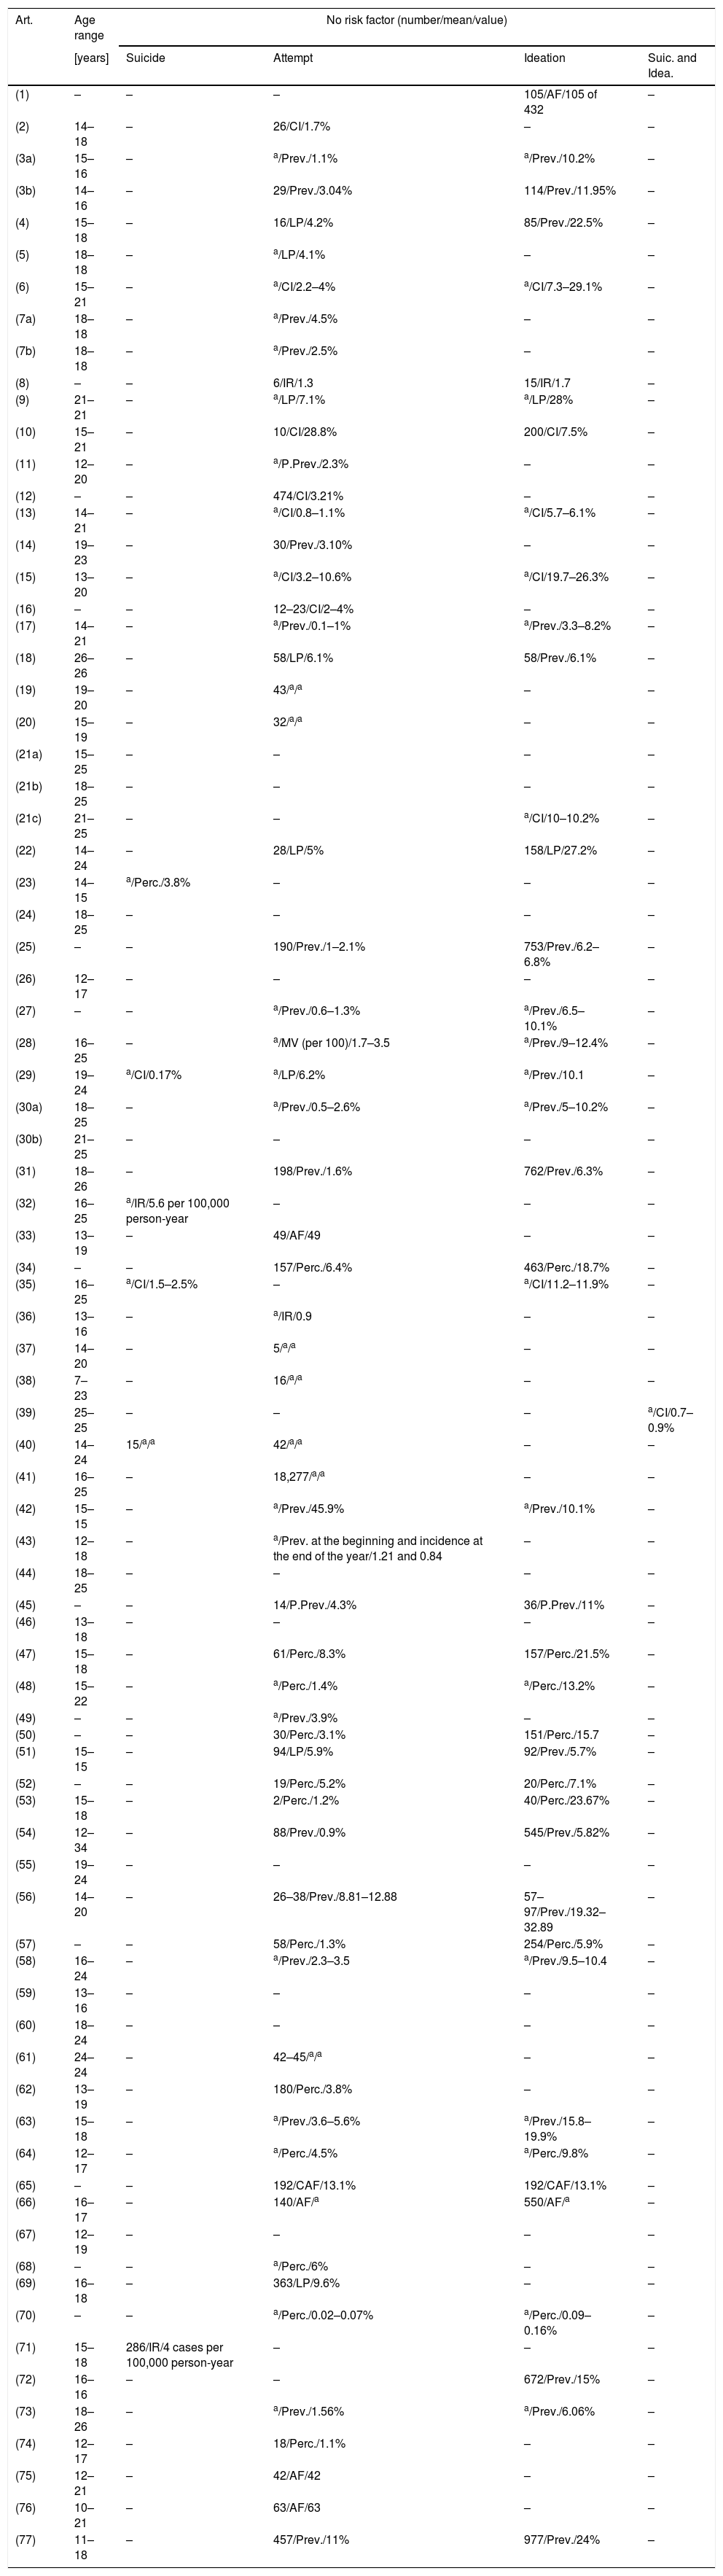
Distribution of the different frequency measures used based on suicidal behaviourNone of the studies analysed gave a formal definition of the measure of frequency used to assess suicidal behaviour. In Tables 4 and 5, the various interpretations found or inferred about the measurement of frequency of suicidal behaviour can be evaluated. In addition, the tables present the measure of frequency considered and its value, as well as whether the study included associated risk factors in assessing suicidal behaviour.
Frequency measures obtained in the articles when risk factors were not considered.
| Art. | Age range | No risk factor (number/mean/value) | |||
|---|---|---|---|---|---|
| [years] | Suicide | Attempt | Ideation | Suic. and Idea. | |
| (1) | – | – | – | 105/AF/105 of 432 | – |
| (2) | 14–18 | – | 26/CI/1.7% | – | – |
| (3a) | 15–16 | – | a/Prev./1.1% | a/Prev./10.2% | – |
| (3b) | 14–16 | – | 29/Prev./3.04% | 114/Prev./11.95% | – |
| (4) | 15–18 | – | 16/LP/4.2% | 85/Prev./22.5% | – |
| (5) | 18–18 | – | a/LP/4.1% | – | – |
| (6) | 15–21 | – | a/CI/2.2–4% | a/CI/7.3–29.1% | – |
| (7a) | 18–18 | – | a/Prev./4.5% | – | – |
| (7b) | 18–18 | – | a/Prev./2.5% | – | – |
| (8) | – | – | 6/IR/1.3 | 15/IR/1.7 | – |
| (9) | 21–21 | – | a/LP/7.1% | a/LP/28% | – |
| (10) | 15–21 | – | 10/CI/28.8% | 200/CI/7.5% | – |
| (11) | 12–20 | – | a/P.Prev./2.3% | – | – |
| (12) | – | – | 474/CI/3.21% | – | – |
| (13) | 14–21 | – | a/CI/0.8–1.1% | a/CI/5.7–6.1% | – |
| (14) | 19–23 | – | 30/Prev./3.10% | – | – |
| (15) | 13–20 | – | a/CI/3.2–10.6% | a/CI/19.7–26.3% | – |
| (16) | – | – | 12–23/CI/2–4% | – | – |
| (17) | 14–21 | – | a/Prev./0.1–1% | a/Prev./3.3–8.2% | – |
| (18) | 26–26 | – | 58/LP/6.1% | 58/Prev./6.1% | – |
| (19) | 19–20 | – | 43/a/a | – | – |
| (20) | 15–19 | – | 32/a/a | – | – |
| (21a) | 15–25 | – | – | – | – |
| (21b) | 18–25 | – | – | – | – |
| (21c) | 21–25 | – | – | a/CI/10–10.2% | – |
| (22) | 14–24 | – | 28/LP/5% | 158/LP/27.2% | – |
| (23) | 14–15 | a/Perc./3.8% | – | – | – |
| (24) | 18–25 | – | – | – | – |
| (25) | – | – | 190/Prev./1–2.1% | 753/Prev./6.2–6.8% | – |
| (26) | 12–17 | – | – | – | – |
| (27) | – | – | a/Prev./0.6–1.3% | a/Prev./6.5–10.1% | – |
| (28) | 16–25 | – | a/MV (per 100)/1.7–3.5 | a/Prev./9–12.4% | – |
| (29) | 19–24 | a/CI/0.17% | a/LP/6.2% | a/Prev./10.1 | – |
| (30a) | 18–25 | – | a/Prev./0.5–2.6% | a/Prev./5–10.2% | – |
| (30b) | 21–25 | – | – | – | – |
| (31) | 18–26 | – | 198/Prev./1.6% | 762/Prev./6.3% | – |
| (32) | 16–25 | a/IR/5.6 per 100,000 person-year | – | – | – |
| (33) | 13–19 | – | 49/AF/49 | – | – |
| (34) | – | – | 157/Perc./6.4% | 463/Perc./18.7% | – |
| (35) | 16–25 | a/CI/1.5–2.5% | – | a/CI/11.2–11.9% | – |
| (36) | 13–16 | – | a/IR/0.9 | – | – |
| (37) | 14–20 | – | 5/a/a | – | – |
| (38) | 7–23 | – | 16/a/a | – | – |
| (39) | 25–25 | – | – | – | a/CI/0.7–0.9% |
| (40) | 14–24 | 15/a/a | 42/a/a | – | – |
| (41) | 16–25 | – | 18,277/a/a | – | – |
| (42) | 15–15 | – | a/Prev./45.9% | a/Prev./10.1% | – |
| (43) | 12–18 | – | a/Prev. at the beginning and incidence at the end of the year/1.21 and 0.84 | – | – |
| (44) | 18–25 | – | – | – | – |
| (45) | – | – | 14/P.Prev./4.3% | 36/P.Prev./11% | – |
| (46) | 13–18 | – | – | – | – |
| (47) | 15–18 | – | 61/Perc./8.3% | 157/Perc./21.5% | – |
| (48) | 15–22 | – | a/Perc./1.4% | a/Perc./13.2% | – |
| (49) | – | – | a/Prev./3.9% | – | – |
| (50) | – | – | 30/Perc./3.1% | 151/Perc./15.7 | – |
| (51) | 15–15 | – | 94/LP/5.9% | 92/Prev./5.7% | – |
| (52) | – | – | 19/Perc./5.2% | 20/Perc./7.1% | – |
| (53) | 15–18 | – | 2/Perc./1.2% | 40/Perc./23.67% | – |
| (54) | 12–34 | – | 88/Prev./0.9% | 545/Prev./5.82% | – |
| (55) | 19–24 | – | – | – | – |
| (56) | 14–20 | – | 26–38/Prev./8.81–12.88 | 57–97/Prev./19.32–32.89 | – |
| (57) | – | – | 58/Perc./1.3% | 254/Perc./5.9% | – |
| (58) | 16–24 | – | a/Prev./2.3–3.5 | a/Prev./9.5–10.4 | – |
| (59) | 13–16 | – | – | – | – |
| (60) | 18–24 | – | – | – | – |
| (61) | 24–24 | – | 42–45/a/a | – | – |
| (62) | 13–19 | – | 180/Perc./3.8% | – | – |
| (63) | 15–18 | – | a/Prev./3.6–5.6% | a/Prev./15.8–19.9% | – |
| (64) | 12–17 | – | a/Perc./4.5% | a/Perc./9.8% | – |
| (65) | – | – | 192/CAF/13.1% | 192/CAF/13.1% | – |
| (66) | 16–17 | – | 140/AF/a | 550/AF/a | – |
| (67) | 12–19 | – | – | – | – |
| (68) | – | – | a/Perc./6% | – | – |
| (69) | 16–18 | – | 363/LP/9.6% | – | – |
| (70) | – | – | a/Perc./0.02–0.07% | a/Perc./0.09–0.16% | – |
| (71) | 15–18 | 286/IR/4 cases per 100,000 person-year | – | – | – |
| (72) | 16–16 | – | – | 672/Prev./15% | – |
| (73) | 18–26 | – | a/Prev./1.56% | a/Prev./6.06% | – |
| (74) | 12–17 | – | 18/Perc./1.1% | – | – |
| (75) | 12–21 | – | 42/AF/42 | – | – |
| (76) | 10–21 | – | 63/AF/63 | – | – |
| (77) | 11–18 | – | 457/Prev./11% | 977/Prev./24% | – |
AF: absolute frequency; CAF: cumulative absolute frequency; CI: cumulative incidence; IR: incidence rate; LP: lifetime prevalence; MV: mean value; Perc.: percentage; Prev.: prevalence; P.Prev.: period prevalence.
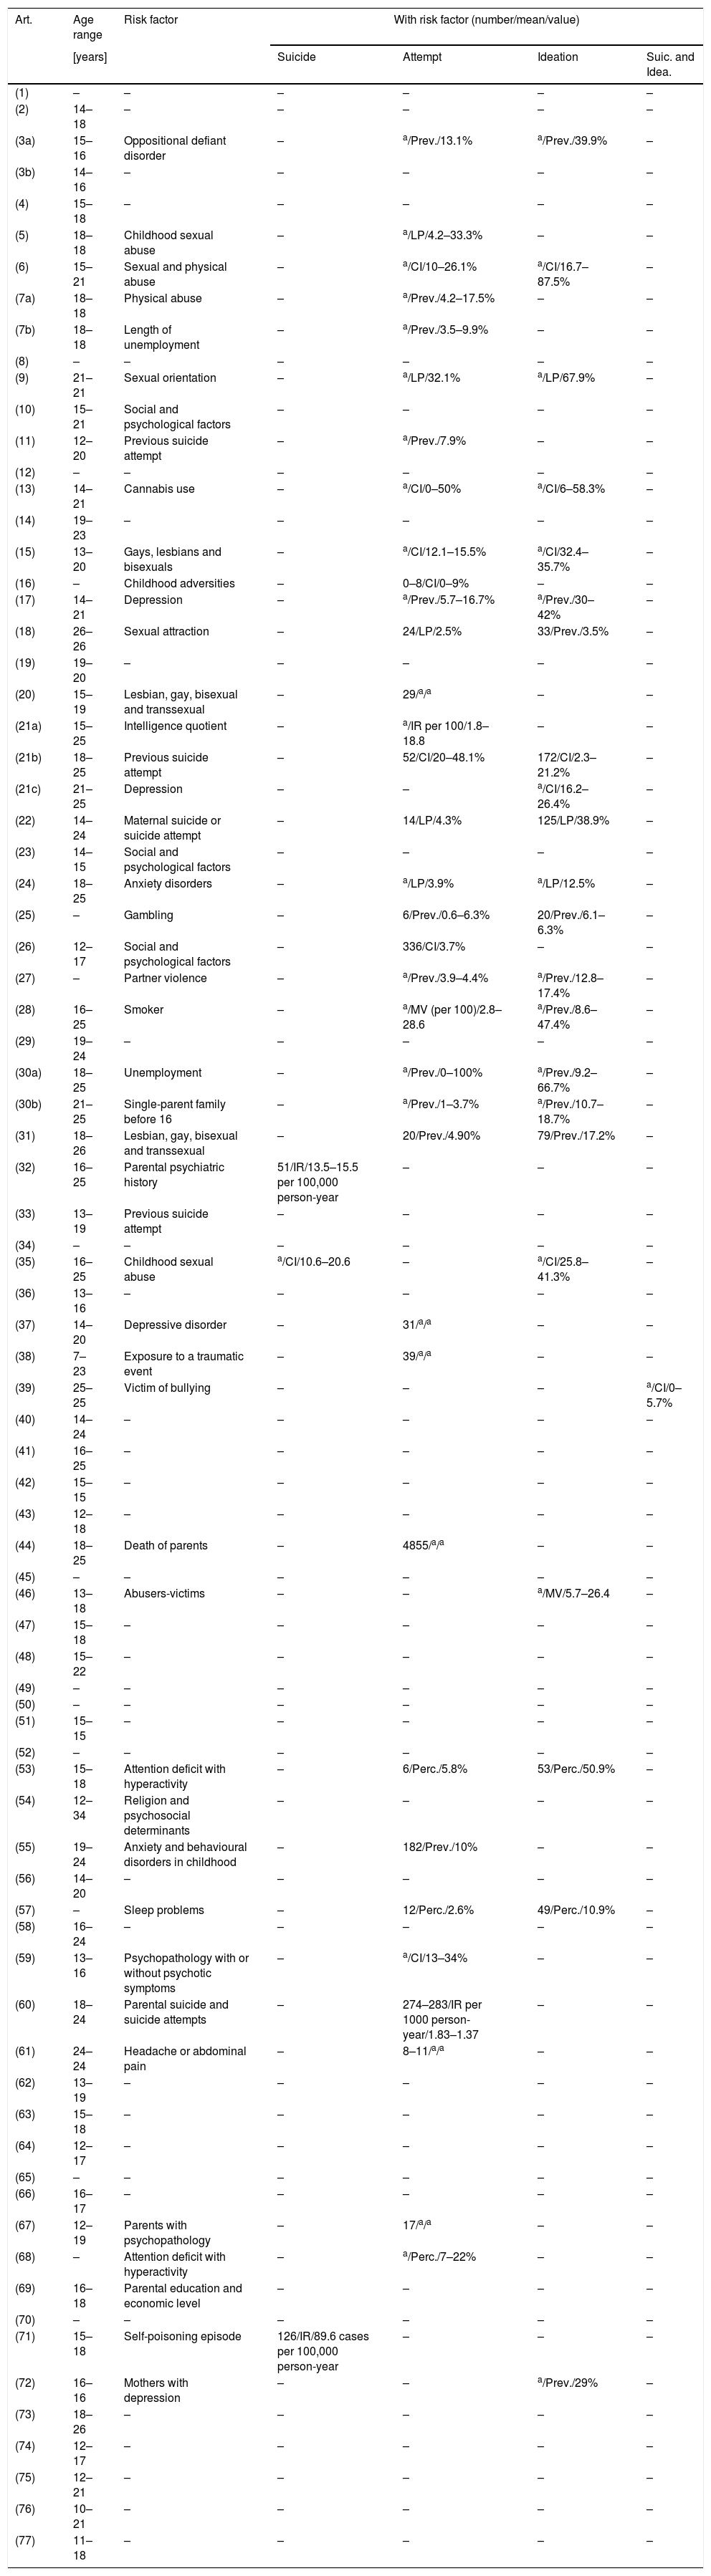
Frequency measures obtained in the articles when risk factors were considered.
| Art. | Age range | Risk factor | With risk factor (number/mean/value) | |||
|---|---|---|---|---|---|---|
| [years] | Suicide | Attempt | Ideation | Suic. and Idea. | ||
| (1) | – | – | – | – | – | – |
| (2) | 14–18 | – | – | – | – | – |
| (3a) | 15–16 | Oppositional defiant disorder | – | a/Prev./13.1% | a/Prev./39.9% | – |
| (3b) | 14–16 | – | – | – | – | – |
| (4) | 15–18 | – | – | – | – | – |
| (5) | 18–18 | Childhood sexual abuse | – | a/LP/4.2–33.3% | – | – |
| (6) | 15–21 | Sexual and physical abuse | – | a/CI/10–26.1% | a/CI/16.7–87.5% | – |
| (7a) | 18–18 | Physical abuse | – | a/Prev./4.2–17.5% | – | – |
| (7b) | 18–18 | Length of unemployment | – | a/Prev./3.5–9.9% | – | – |
| (8) | – | – | – | – | – | – |
| (9) | 21–21 | Sexual orientation | – | a/LP/32.1% | a/LP/67.9% | – |
| (10) | 15–21 | Social and psychological factors | – | – | – | – |
| (11) | 12–20 | Previous suicide attempt | – | a/Prev./7.9% | – | – |
| (12) | – | – | – | – | – | – |
| (13) | 14–21 | Cannabis use | – | a/CI/0–50% | a/CI/6–58.3% | – |
| (14) | 19–23 | – | – | – | – | – |
| (15) | 13–20 | Gays, lesbians and bisexuals | – | a/CI/12.1–15.5% | a/CI/32.4–35.7% | – |
| (16) | – | Childhood adversities | – | 0–8/CI/0–9% | – | – |
| (17) | 14–21 | Depression | – | a/Prev./5.7–16.7% | a/Prev./30–42% | – |
| (18) | 26–26 | Sexual attraction | – | 24/LP/2.5% | 33/Prev./3.5% | – |
| (19) | 19–20 | – | – | – | – | – |
| (20) | 15–19 | Lesbian, gay, bisexual and transsexual | – | 29/a/a | – | – |
| (21a) | 15–25 | Intelligence quotient | – | a/IR per 100/1.8–18.8 | – | – |
| (21b) | 18–25 | Previous suicide attempt | – | 52/CI/20–48.1% | 172/CI/2.3–21.2% | – |
| (21c) | 21–25 | Depression | – | – | a/CI/16.2–26.4% | – |
| (22) | 14–24 | Maternal suicide or suicide attempt | – | 14/LP/4.3% | 125/LP/38.9% | – |
| (23) | 14–15 | Social and psychological factors | – | – | – | – |
| (24) | 18–25 | Anxiety disorders | – | a/LP/3.9% | a/LP/12.5% | – |
| (25) | – | Gambling | – | 6/Prev./0.6–6.3% | 20/Prev./6.1–6.3% | – |
| (26) | 12–17 | Social and psychological factors | – | 336/CI/3.7% | – | – |
| (27) | – | Partner violence | – | a/Prev./3.9–4.4% | a/Prev./12.8–17.4% | – |
| (28) | 16–25 | Smoker | – | a/MV (per 100)/2.8–28.6 | a/Prev./8.6–47.4% | – |
| (29) | 19–24 | – | – | – | – | – |
| (30a) | 18–25 | Unemployment | – | a/Prev./0–100% | a/Prev./9.2–66.7% | – |
| (30b) | 21–25 | Single-parent family before 16 | – | a/Prev./1–3.7% | a/Prev./10.7–18.7% | – |
| (31) | 18–26 | Lesbian, gay, bisexual and transsexual | – | 20/Prev./4.90% | 79/Prev./17.2% | – |
| (32) | 16–25 | Parental psychiatric history | 51/IR/13.5–15.5 per 100,000 person-year | – | – | – |
| (33) | 13–19 | Previous suicide attempt | – | – | – | – |
| (34) | – | – | – | – | – | – |
| (35) | 16–25 | Childhood sexual abuse | a/CI/10.6–20.6 | – | a/CI/25.8–41.3% | – |
| (36) | 13–16 | – | – | – | – | – |
| (37) | 14–20 | Depressive disorder | – | 31/a/a | – | – |
| (38) | 7–23 | Exposure to a traumatic event | – | 39/a/a | – | – |
| (39) | 25–25 | Victim of bullying | – | – | – | a/CI/0–5.7% |
| (40) | 14–24 | – | – | – | – | – |
| (41) | 16–25 | – | – | – | – | – |
| (42) | 15–15 | – | – | – | – | – |
| (43) | 12–18 | – | – | – | – | – |
| (44) | 18–25 | Death of parents | – | 4855/a/a | – | – |
| (45) | – | – | – | – | – | – |
| (46) | 13–18 | Abusers-victims | – | – | a/MV/5.7–26.4 | – |
| (47) | 15–18 | – | – | – | – | – |
| (48) | 15–22 | – | – | – | – | – |
| (49) | – | – | – | – | – | – |
| (50) | – | – | – | – | – | – |
| (51) | 15–15 | – | – | – | – | – |
| (52) | – | – | – | – | – | – |
| (53) | 15–18 | Attention deficit with hyperactivity | – | 6/Perc./5.8% | 53/Perc./50.9% | – |
| (54) | 12–34 | Religion and psychosocial determinants | – | – | – | – |
| (55) | 19–24 | Anxiety and behavioural disorders in childhood | – | 182/Prev./10% | – | – |
| (56) | 14–20 | – | – | – | – | – |
| (57) | – | Sleep problems | – | 12/Perc./2.6% | 49/Perc./10.9% | – |
| (58) | 16–24 | – | – | – | – | – |
| (59) | 13–16 | Psychopathology with or without psychotic symptoms | – | a/CI/13–34% | – | – |
| (60) | 18–24 | Parental suicide and suicide attempts | – | 274–283/IR per 1000 person-year/1.83–1.37 | – | – |
| (61) | 24–24 | Headache or abdominal pain | – | 8–11/a/a | – | – |
| (62) | 13–19 | – | – | – | – | – |
| (63) | 15–18 | – | – | – | – | – |
| (64) | 12–17 | – | – | – | – | – |
| (65) | – | – | – | – | – | – |
| (66) | 16–17 | – | – | – | – | – |
| (67) | 12–19 | Parents with psychopathology | – | 17/a/a | – | – |
| (68) | – | Attention deficit with hyperactivity | – | a/Perc./7–22% | – | – |
| (69) | 16–18 | Parental education and economic level | – | – | – | – |
| (70) | – | – | – | – | – | – |
| (71) | 15–18 | Self-poisoning episode | 126/IR/89.6 cases per 100,000 person-year | – | – | – |
| (72) | 16–16 | Mothers with depression | – | – | a/Prev./29% | – |
| (73) | 18–26 | – | – | – | – | – |
| (74) | 12–17 | – | – | – | – | – |
| (75) | 12–21 | – | – | – | – | – |
| (76) | 10–21 | – | – | – | – | – |
| (77) | 11–18 | – | – | – | – | – |
AF: absolute frequency; CAF: cumulative absolute frequency; CI: cumulative incidence; IR: incidence rate; LP: lifetime prevalence; MV: mean value; Perc.: percentage; Prev.: prevalence.
We have considered up to 9 different ways to measure the frequency of suicidal behaviour. The most common were as follows: point prevalence, used 60 times (35.5%); cumulative incidence, used 30 times (17.75%); a simple percentage without any additional information, which appeared 26 times (15.38%); absolute frequency figures found 20 times (11.83%); and lifetime prevalence, 18 times (10.65%). The following have been used to a lesser extent: incidence rates (7 times; 4.14%); period prevalence and average value (3 times; 1.78%, respectively); and cumulative absolute frequency (2 times; 1.18%).
Table 5 presents the frequency of suicidal behaviour by risk factors taken into consideration in each of the articles, with there being a wide variety of them. If a risk factor was categorised, we have shown its range of variation. When the article classified its results by age groups, we have included the age range closest to a young adult population. The studies were longitudinal studies and some were long term, where there was more than 1 time or point of measurement; consequently, we have shown only the results from the last estimation performed in the original study.
DiscussionFrom the results of our research, a key finding is the conceptual and terminological vagueness in the use of measures of frequency. The measures used are not homogeneous at all. This is not necessarily negative, given that the variability of the measurement depends on the objective and design formulated. However, such vagueness certainly makes interpreting and comparing results more difficult. This problem of comparability can be aggravated when we try to contrast the frequency of risk factors between different studies. For example, imagine that a reader wants to ascertain which of 2 risk factors is more associated with a suicide attempt, sexual orientation or a previous suicide attempt; if the reader compares the studies of Ferguson (1999) and Wichstrom (2000), it could be said that it is the first factor (32.1%) more than the second (7.9%), when in reality the figures are just not comparable because the first one is lifetime prevalence and the second, point prevalence.
Suicidal behaviour is a heterogeneous phenomenon that requires continued improvement of public health policies for its prevention.24 In our opinion, just as other authors point out, one of these improvements should focus on the appropriate, consensual use of certain methodological aspects.15,16,18 Specifically, recommendations have already been given in the area of mental health focused on homogenising the use of frequency measures in the studies to be able to compare their results.25
The principal contribution of our review is that methodological aspects have been analysed in more than 80 studies, which represent a wide sampling of epidemiological research, specifically of longitudinal studies on suicidal behaviour. For example, in the review we have found studies that, even though they are cohort studies in a young adult population to assess completed suicide, use measures as different as a percentage (Article 23), a cumulative incidence (Article 29) or an incidence rate (Article 32). This makes performing comparisons impossible.
We have basically found a series of issues that we believe must be addressed when it comes to interpreting results of different studies by researchers and clinicians in this area. Specifically, in this review these are: (1) none of the studies evaluated include an explicit definition of the measure of frequency used and often lack even the point in the follow-up period in which it is calculated; and (2) we would like caution readers about the problems of interpretation when comparing the figures among the different studies, due to the variations in methodology and terminology that there are. In fact, we ourselves have often had to frame the numerical data within the definition of the measure of frequency that seemed most plausible to us; in some studies, we have even calculated the most appropriate measure of frequency with the data provided.
We have observed that, generally speaking, when suicidal behaviour is studied with or without risk factors, the authors choose a frequency that in a few cases is simply a number, opting for a relative frequency in other cases regardless of whether it is a prevalence, a cumulative incidence, a lifetime prevalence or a simple percentage. It has sometimes been very difficult for us to distinguish between prevalence and cumulative incidence because both are percentages. On the other hand, it is logical to find only 7 studies in which the incidence rate is calculated, given that its significance in suicidal behaviour studies is more conceptual than real, because in practice it is difficult to gather the information needed for estimating it. For this reason and for the wide variety of measures found, we have not been able to perform a meta-analysis.
To sum up, suicide is a public health problem about which most organisations attempt to clarify the nosology and describe improvements in preventive measures. However, they do not focus their attention on the requirements for measuring its incidence. This review has revealed the wide variability in the measures of frequency used and the lack of consensus in the scientific community about how to measure suicidal behaviour in longitudinal studies. This article serves as a warning that there is a need to agree on a unified strategy for measuring incidence in longitudinal studies on suicidal behaviour. Point 8 in the STROBE guide (Strengthening the Reporting of Observational studies in Epidemiology)26,27 contains the recommendation to detail the measurement methods and specify the comparability of the groups if applicable.
The principal limitation of this research lies in the nature of the investigation itself, given the methodological variation in the studies analysed, which have even made a meta-analysis impossible. In contrast, the main strength of this study is due to the comprehensiveness of the search and review of longitudinal studies by a multidisciplinary team within the Universal Project, which has revealed the heterogeneous nature of the use of epidemiological measures of frequency in suicidal behaviour.
Declaration of transparencyThe main author declares that this manuscript is an honest, precise and transparent recounting of the study presented and that no important aspect of the study has been omitted.
FundingThis study is funded by the Instituto de Salud Carlos III (CD12/00440), ISCIII-FEDER (PI13/00343), ISCIII-FIS (CM14/00125), ISCIII, National Secretary of Higher Education, Science, Technology and Innovation (SENESCYT-Ecuador), ECA07/059 and AGAUR 2014 SGR 74.
AuthorshipAll the authors that signed the article have contributed to its complete process of preparation, including the information search, data analysis, writing and review of the document produced.
Conflict of interestsThe authors of this article have no conflicts of interest to declare.
The authors of this article wish to thank María José Abellán, Consuelo López and Santiago de los Reyes, from the University of Cádiz, for their collaboration and contributions in the literature review performed.
Please cite this article as: Lagares-Franco C, Almenara-Barrios J, O’Ferrall-González C, Castellvi-Obiols P, Gabilondo A, Blasco-Cubedo MJ, et al. Medidas de frecuencia utilizadas en estudios de cohortes para evaluar el comportamiento suicida en jóvenes (12-26 años): una revisión sistemática. Rev Psiquiatr Salud Ment (Barc). 2019;12:213–231.