


To analyze the diagnostic performance of pulmonary CT angiography and to compare different D-dimer cutoffs for the diagnosis of acute pulmonary embolism in patients with and without SARS-CoV-2 infections.
Materials and methodsWe retrospectively analysed all consecutive pulmonary CT angiography studies done for suspected pulmonary embolism in a tertiary hospital during two time periods: the first December 2020 through February 2021 and the second December 2017 through February 2018. D-dimer levels were obtained less than 24 h before the pulmonary CT angiography studies. We analysed the sensitivity, specificity, positive and negative predictive values, area under the receiver operating curve (AUC), and pattern of pulmonary embolism for six different values of D-dimer and the extent of the embolism. During the pandemic period, we also analysed whether the patients had COVID-19.
ResultsAfter excluding 29 poor-quality studies, 492 studies were analysed; 352 of these were done during the pandemic, 180 in patients with COVID-19 and 172 in patients without COVID-19. The absolute frequency of pulmonary embolism diagnosed was higher during the pandemic period (34 cases during the prior period and 85 during the pandemic; 47 of these patients had COVID-19). No significant differences were found in comparing the AUCs for the D-dimer values. The optimum values calculated for the receiver operating characteristic curves differed between patients with COVID-19 (2200 mcg/l), without COVID-19 (4800 mcg/l), and diagnosed in the prepandemic period (3200 mcg/l). Peripheral distribution of the emboli was more common in patients with COVID-19 (72%) than in those without COVID-19 and than in those diagnosed before the pandemic [OR 6.6, 95% CI: 1.5–24.6, p < 0.05 when compared to central distribution].
ConclusionsThe number of CT angiography studies and the number of pulmonary embolisms diagnosed during the pandemic increased due to SARS-CoV-2 infection. The optimal d-dimer cutoffs and the distribution of the pulmonary embolisms differed between the groups of patients with and without COVID-19.
Analizar el rendimiento diagnóstico de la angio-TC pulmonar y comparar distintos valores de corte del dímero-D para el diagnóstico de tromboembolia pulmonar (TEP) aguda en pacientes con y sin infección por SARS-CoV-2.
Materiales y métodosAnálisis retrospectivo de todas las angio-TC pulmonares realizadas consecutivamente por sospecha de TEP en un hospital de tercer nivel durante 2 periodos distintos. El primero de diciembre del 2020 a febrero del 2021 y el segundo de diciembre del 2017 a febrero del 2018. Se recogieron los resultados del dímero-D durante las 24 h previas a la realización de las angio-TC pulmonares, así como el resultado de estas últimas para todos los pacientes incluidos. Se analizaron la sensibilidad, especificidad, valores predictivos, área bajo la curva (AUC) y patrón de tromboembolia para 6 valores distintos del dímero-D y la extensión del tromboembolia. Durante el periodo de la pandemia se registró si los pacientes tenían enfermedad por SARS-CoV-2.
ResultadosTras desestimar 29 estudios de baja calidad, se incluyeron 492 para el análisis. De ellos, 352 fueron realizados durante la pandemia; 180 en enfermos con COVID-19 y 172 sin la enfermedad. La frecuencia absoluta de TEP diagnosticados durante la pandemia fue mayor (34 durante el periodo previo a la pandemia y 85 durante la pandemia, correspondiendo 47 de este último grupo a pacientes con COVID-19). No se encontraron diferencias significativas al comparar el AUC para los valores del dímero-D. Los valores óptimos calculados a partir de las curvas ROC fueron distintos (2.200, 4.800 y 3.200 µg/l en pacientes con COVID-19, sin COVID-19 y en diagnosticados durante el periodo prepandemia, respectivamente). La distribución periférica de los trombos fue más frecuente en pacientes con COVID-19 (72%), respecto a los pacientes sin COVID-19 y los diagnosticados antes de la pandemia, con un OR de 6,6, IC del 95%: 1,5–24,6 (p < 0,05) al compararla con la distribución central.
ConclusionesEl número de angio-TC realizadas y TEP diagnosticados durante la pandemia aumentó debido a la infección por SARS-CoV-2. Los valores de corte del dímero-D óptimos y la distribución del TEP fueron distintos en los grupos con y sin COVID-19.
SARS-CoV-2 infection was first described in December 2019 in the western part of southern China as a respiratory infection causing acute respiratory distress syndrome in some patients.
The pro-inflammatory state triggered by the infection has been associated with the development of thrombotic and thromboembolic complications.1 Pulmonary thromboembolism (PTE) in these patients seems to be the result of local thrombosis secondary to the inflammatory process.2
Regardless of the aetiopathogenic mechanism, PTE is more common in patients with severe SARS-CoV-2 infection treated in hospital,3 particularly in Intensive Care Units (ICU), although it also occurs in non-hospitalised patients.4,5 In their meta-analysis, Jiménez et al.3 analysed the incidence of venous thromboembolism in patients with COVID-19 and found the incidence of PTE to be 7.1% in 32 of the 49 studies included, and when the patients treated in ICU were analysed separately, the incidence reached 27.9%. Suspicion of PTE in patients with SARS-CoV-2 infection increases in the case of blood gas abnormalities and haemodynamic instability disproportionate to the time and type of disease progress, with computed tomography (CT) pulmonary angiogram being the diagnostic method of choice.
The decision-making algorithm for hospitalised patients with suspected PTE includes clinical variables and the D-dimer test result.6 In patients with COVID-19, D-dimer values are frequently elevated, as a marker of blood-clotting problems and disease severity.7
Elevated D-dimer levels have been associated with greater disease severity, a greater risk of admission to ICU and higher mortality rates.1 However, the frequent elevation of D-dimer levels in patients with severe SARS-CoV-2 pneumonia can lead to confusion and prevents its use as a criterion to support or rule out suspected PTE in patients with low-to-intermediate risk.8
A large number of studies have evaluated the diagnostic yield of D-dimer,3,9–13 but there is little comparative information between groups of patients with and without COVID-19 during periods of high incidence of the disease.
The European Society of Radiology (ESR) and the European Society of Thoracic Imaging (ESTI) recommend the use of CT pulmonary angiogram to rule out PTE in patients with SARS-CoV-2 infection requiring supplemental oxygen or persistent respiratory failure who have few lung abnormalities on imaging tests.9 Although we have followed these criteria in clinical practice at our centre, decision-making for performing imaging tests has also been influenced by elevation of D-dimer levels.
In this scenario, our aim was to retrospectively evaluate the diagnostic yield of CT pulmonary angiogram for the diagnosis of PTE and to compare different cut-off values for D-dimer in two different periods, the first during the pandemic with a high incidence of COVID-19, and another period pre-pandemic. Lastly, we compared the distribution pattern of PTE in the two populations.
Material and methodsStudy designThis was a study of diagnostic yield in which we consecutively included all patients who underwent CT pulmonary angiogram in our centre for suspected PTE during two different periods. The ethics committee of our hospital approved this study under registration number PI2021-077. The need to request informed consent from these patients was ruled out in view of the retrospective nature of the study.
The patients were divided into two groups according to when the CT pulmonary angiogram was performed. The first group (group A) was made up of patients assessed from December 2020 to February 2021, when there was a peak incidence of COVID-19 at our hospital, and the second group (group B) included those assessed at the same time of year but prior to the COVID-19 pandemic (December 2017–February 2018).
Group A patients were divided into two subgroups, with and without COVID-19, classifying them as having COVID-19 if they had a positive polymerase chain reaction (PCR) test for SARS-CoV-2 or positive IgM with negative IgG prior to having the CT pulmonary angiogram, or if there was strong clinical and epidemiological suspicion with typical findings of COVID-19 on CT pulmonary angiogram (ground-glass opacities or bilateral, peripheral and basal consolidations, with or without vascular thickening). The subgroup without COVID-19 consisted of patients who had negative PCR and antibody tests, and the absence of a high degree of clinical suspicion.
We excluded all the patients with CT pulmonary angiogram who had significant motion artifacts or poor pulmonary artery enhancement that limited the diagnosis of PTE.
The following information was obtained from each patient: age; gender; stay in ICU; CT pulmonary angiogram result (including PTE distribution pattern); D-dimer value; and results of PCR test for SARS-CoV-2 and IgM and IgG antibodies.
Acquisition and analysis of the CT pulmonary angiogramsThe CT pulmonary angiograms were acquired on a Siemens SOMATOM GoUp scanner, with 32 × 0.7-mm collimation, with voltage of 110 kV and modulated milliamperage.
The iodinated contrast administration protocol was performed by injecting 40–70 ml at a rate of 4 ml/s, followed by 40 ml of saline solution at the same rate, with the start of image acquisition four seconds after reaching a threshold of 150 Hounsfield units in the main pulmonary artery.
All the studies were analysed by two radiologists from the chest radiology section, one with six and the other with 20 years of experience. PTE was diagnosed in patients who had at least one filling defect in the main pulmonary artery or its branches visible on the CT pulmonary angiogram.14 Regarding the distribution pattern of the PTE, it was considered peripheral if it affected the segmental or subsegmental arteries, and central if it affected either of the main pulmonary arteries or their lobar branches. Lastly, the quantitative measurement of D-dimer was performed by latex photometric immunoassay.
Statistical analysisThe frequency of positive and negative CT pulmonary angiograms was calculated for each group, as well as the association between SARS-CoV-2 infection and the development of PTE using the chi-square statistical test.
The diagnostic yield for the diagnosis of PTE of different D-dimer values (500, 1000, 1500, 2000, 3500, 5000 μg/l) was analysed in both groups, calculating the sensitivity, specificity and positive and negative predictive values for each of these values. The optimal D-dimer cut-off values for the different groups were calculated by analysing the receiver operating characteristic (ROC) curves and the areas under the curve (AUC) obtained and were compared using the DeLong test.
The distribution of PTE in all the groups was compared using the chi-square test.
We used SPSS software for Windows (version 25.0, Inc. Chicago, IL., United States).
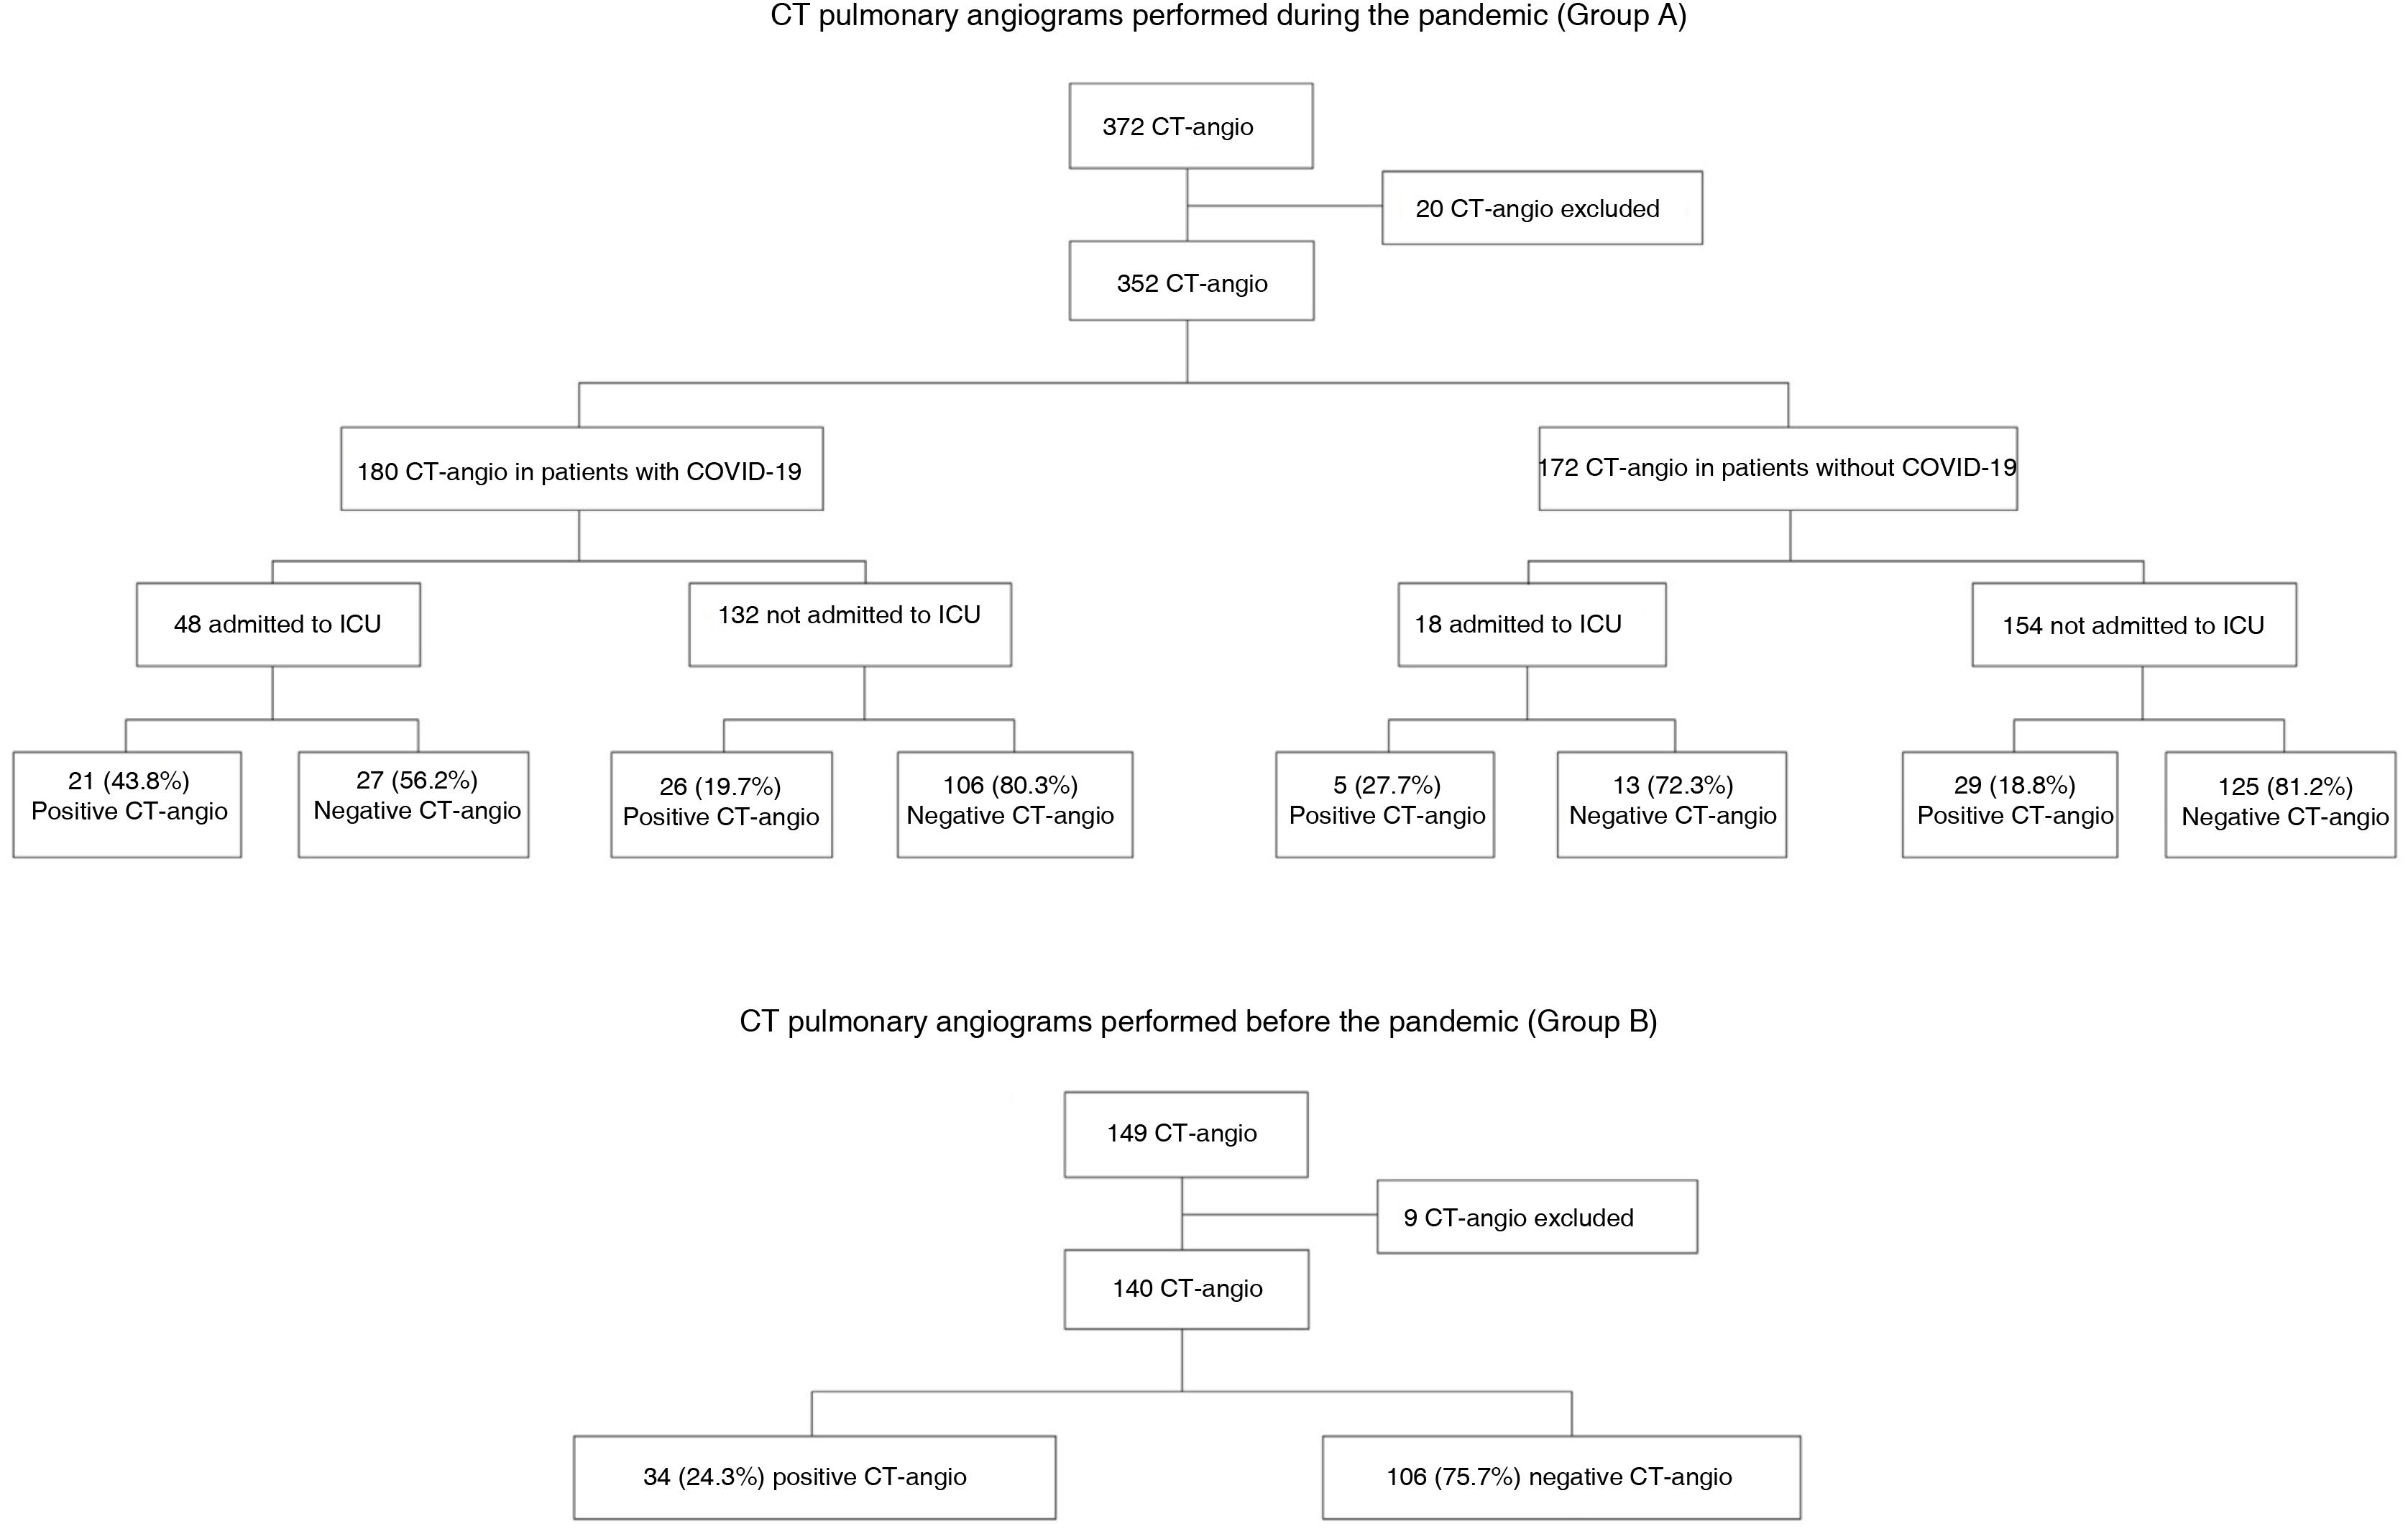
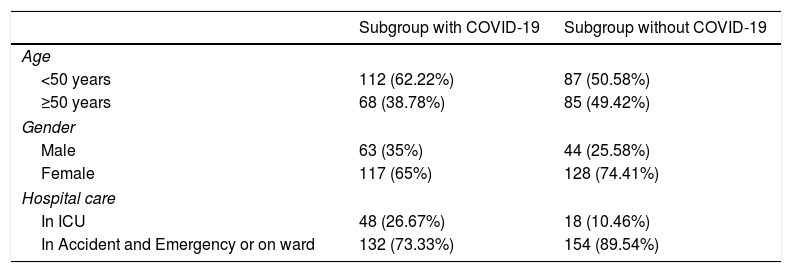
ResultsPatients included and frequency of CT pulmonary angiogramFig. 1 shows a flowchart of the patients included and excluded and the percentage of positive CT pulmonary angiograms for each group. A total of 492 patients were included for the analysis after rejecting 29 with studies of poor technical quality. From this total, 140 corresponded to tests performed in the pre-pandemic period and 352 to tests performed during the pandemic; of these, 180 were assigned to the subgroup of patients with COVID-19 and 172 to the non-COVID-19 subgroup. Table 1 shows the age and gender of the patients during the pandemic and whether or not they were admitted to the ICU.

Epidemiological data for the patients included in the group A subgroups.
| Subgroup with COVID-19 | Subgroup without COVID-19 | |
|---|---|---|
| Age | ||
| <50 years | 112 (62.22%) | 87 (50.58%) |
| ≥50 years | 68 (38.78%) | 85 (49.42%) |
| Gender | ||
| Male | 63 (35%) | 44 (25.58%) |
| Female | 117 (65%) | 128 (74.41%) |
| Hospital care | ||
| In ICU | 48 (26.67%) | 18 (10.46%) |
| In Accident and Emergency or on ward | 132 (73.33%) | 154 (89.54%) |
Out of all the CT pulmonary angiograms performed during the pandemic (group A), 85 patients (24%) had PTE; of these, slightly more than half (55.3%) had COVID-19. PTE was diagnosed in 19.8% of the patients without COVID-19 and 26.1% of the patients with COVID-19. Out of all the patients with COVID-19 admitted to the ICU, 43.8% developed PTE, while only 19.7% of those not admitted developed PTE (Fig. 1).
From the CT pulmonary angiograms performed during the pre-pandemic period (group B), 34 patients (24.3%) were found to have PTE.
There were no statistically significant differences in the risk of developing PTE between patients with COVID-19 and those in the subgroup without COVID-19 (p = 0.22) or patients in group B (p = 0.42).
Diagnostic yield of D-dimerMedian D-dimer values in patients with PTE and COVID-19 were similar to those in patients without COVID-19 (2400 μg/l, P25: 1100-P75: 6400 vs 3000 μg/l, P25: 1500-P75: 7000 respectively).
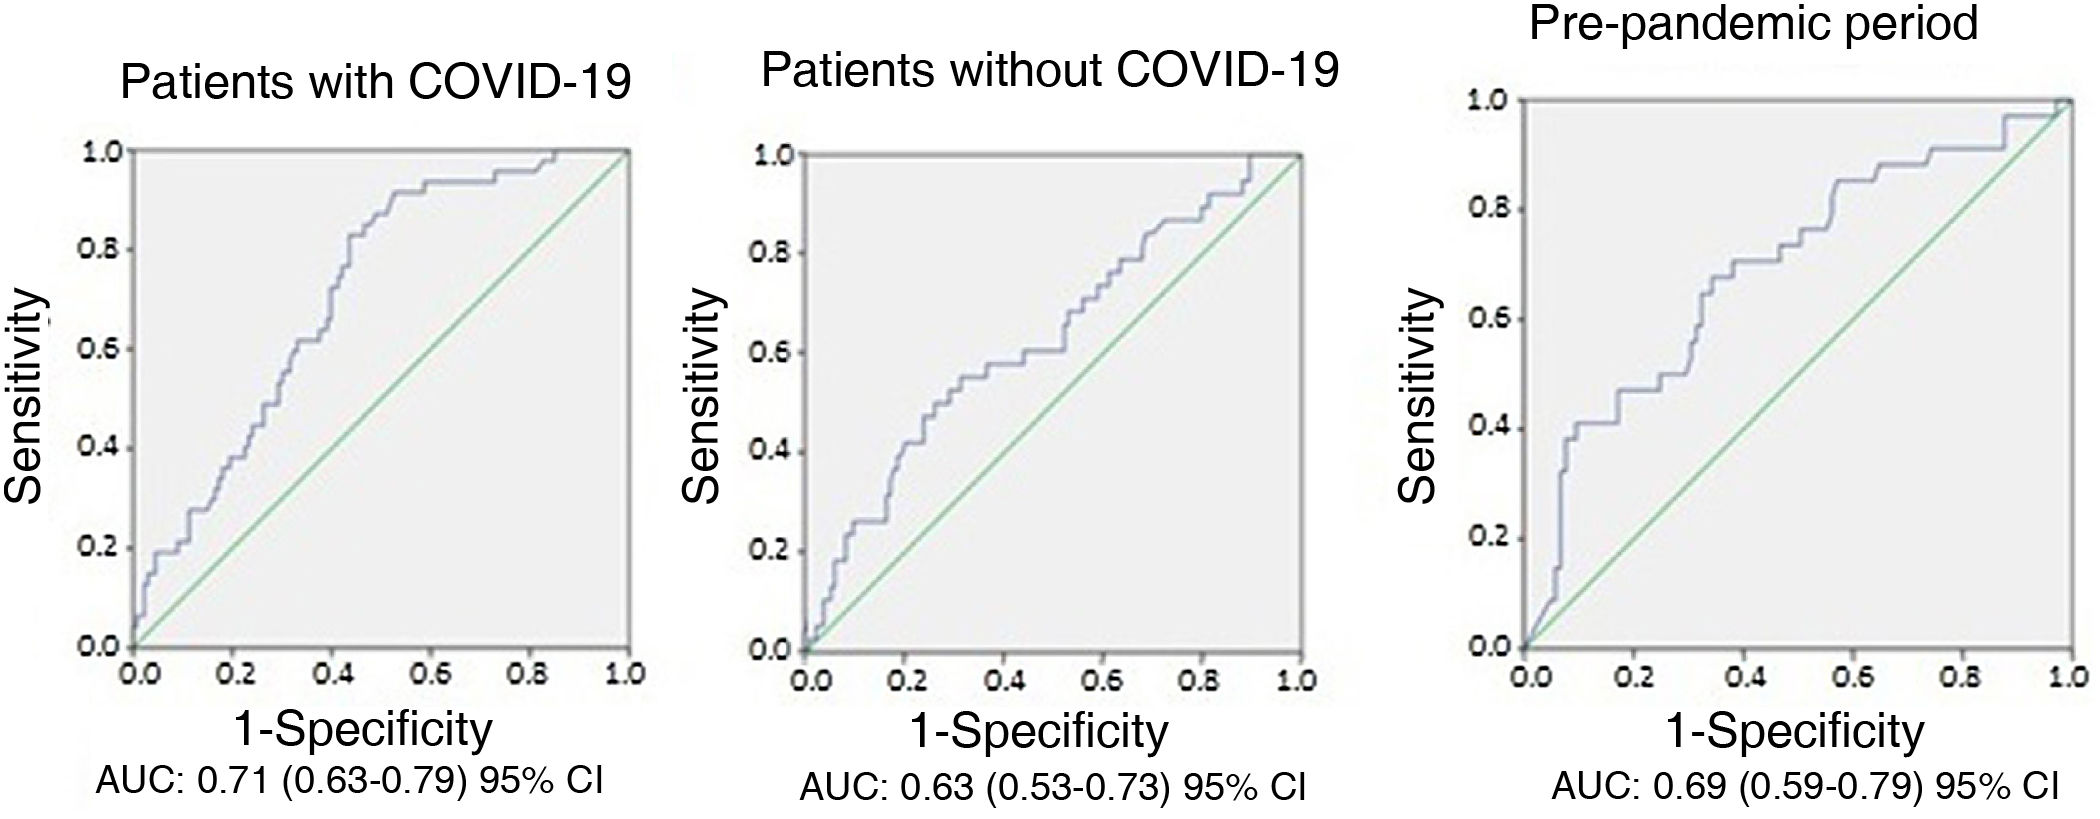
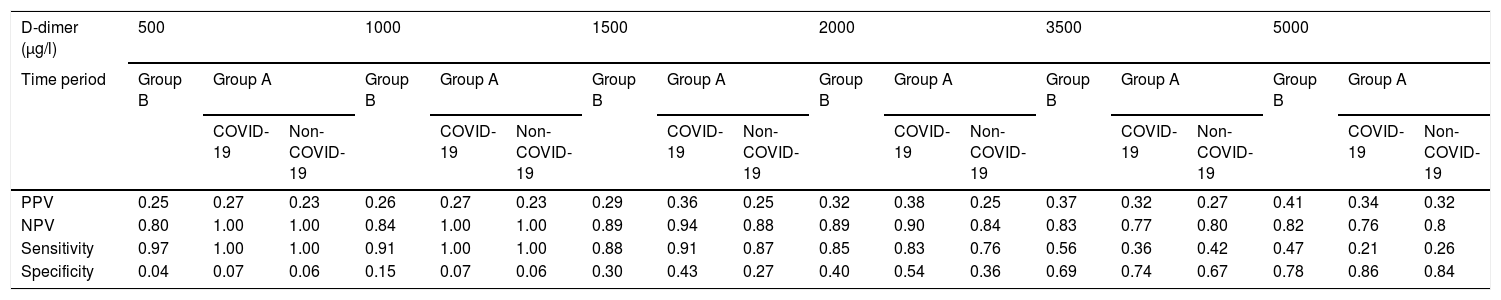
Different results were obtained in terms of sensitivity, specificity and positive and negative predictive values for the six cut-off values of D-dimer analysed in the two groups (Table 2). Despite this, no differences were found when comparing the AUC of D-dimer values (0.71 for patients with COVID-19, 0.63 for patients without COVID-19 and 0.69 for patients in group B, p > 0.05) (Fig. 2).
Diagnostic yield of the different D-dimer values.
| D-dimer (μg/l) | 500 | 1000 | 1500 | 2000 | 3500 | 5000 | ||||||||||||
|---|---|---|---|---|---|---|---|---|---|---|---|---|---|---|---|---|---|---|
| Time period | Group B | Group A | Group B | Group A | Group B | Group A | Group B | Group A | Group B | Group A | Group B | Group A | ||||||
| COVID-19 | Non-COVID-19 | COVID-19 | Non-COVID-19 | COVID-19 | Non-COVID-19 | COVID-19 | Non-COVID-19 | COVID-19 | Non-COVID-19 | COVID-19 | Non-COVID-19 | |||||||
| PPV | 0.25 | 0.27 | 0.23 | 0.26 | 0.27 | 0.23 | 0.29 | 0.36 | 0.25 | 0.32 | 0.38 | 0.25 | 0.37 | 0.32 | 0.27 | 0.41 | 0.34 | 0.32 |
| NPV | 0.80 | 1.00 | 1.00 | 0.84 | 1.00 | 1.00 | 0.89 | 0.94 | 0.88 | 0.89 | 0.90 | 0.84 | 0.83 | 0.77 | 0.80 | 0.82 | 0.76 | 0.8 |
| Sensitivity | 0.97 | 1.00 | 1.00 | 0.91 | 1.00 | 1.00 | 0.88 | 0.91 | 0.87 | 0.85 | 0.83 | 0.76 | 0.56 | 0.36 | 0.42 | 0.47 | 0.21 | 0.26 |
| Specificity | 0.04 | 0.07 | 0.06 | 0.15 | 0.07 | 0.06 | 0.30 | 0.43 | 0.27 | 0.40 | 0.54 | 0.36 | 0.69 | 0.74 | 0.67 | 0.78 | 0.86 | 0.84 |
NPV: negative predictive value; PPV: positive predictive value.

The optimal D-dimer cut-off values calculated for the different groups were 2200, 4800 and 3200 μg/l for patients with COVID-19, without COVID-19 and those in group B, respectively. Adjusting these values to a sensitivity of 90%, the cut-off values obtained were 1600, 1100 and 1350 μg/l for patients with COVID-19, without COVID-19 and those in group B (Table 2), respectively.
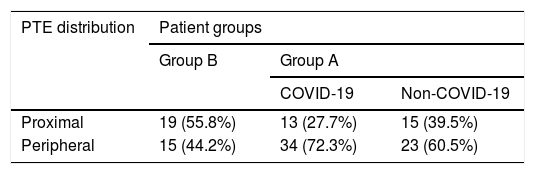
Distribution of pulmonary thromboembolismA higher relative frequency of PTE with peripheral distribution was found in patients with COVID-19 (Table 3) compared to patients in the subgroup without COVID-19 and those in group B (OR = 6.6, 95% confidence interval [CI], 1.5–24.6, p = 0.01).
DiscussionOur analysis shows an absolute increase in the number of CT pulmonary angiograms ordered and the number of patients with PTE detected during a particular period of the COVID-19 pandemic at our centre, with a larger number of cases detected in patients with COVID-19, and a higher frequency of PTE with peripheral distribution. Despite this, the positivity rate remained unchanged and the D-dimer values were similar in the different groups.
The relative frequency of positive CT pulmonary angiograms in patients with COVID-19 (26.1%) in our study falls within the range previously reported in a meta-analysis and other studies (24–37%).3,11–13,15–17 Different positivity rates have been published depending on the hospital department where the patient was assessed. In a study evaluating patients treated in Accident and Emergency, the positivity rate was lower (7.7%)18 than that found in patients with severe infection treated in the ICU, where positivity rates were as high as 50%.13–17,19 In our study, the incidence in patients admitted to the ICU was 43.8%, compared to 19.7% in the rest of the patients with COVID-19.
Comparisons have been made of the frequency of PTE over similar periods of time, showing an increase during the pandemic.1 In our study, the relative frequency of positive CT pulmonary angiogram in patients with COVID-19 was similar to that of patients without COVID-19 during the pandemic (26.1% and 22.1%, respectively) and, furthermore, both figures were similar to that of patients diagnosed during the pre-pandemic period (24.3%). Despite that, the total number of CT pulmonary angiograms performed and PTE diagnosed increased considerably during the pandemic. This situation was also recently described by Schulz et al.,20 who found a 61.8% increase in the number of CT angiograms performed during the pandemic, maintaining the same positivity rate. However, the positivity rate in that study, around 11%,20 is lower than ours in all groups (over 20%). These differences could be due to different treatment guidelines in two geographically distant communities, in addition to different protocols for performing CT angiograms.
The frequency of diagnosed PTE has been shown to increase when it is actively screened for3 and this could be a determining factor in the absolute increase in cases, but the increase may be also due to a higher proportion of cases with severe COVID-19 evaluated during this period.21
The D-dimer levels used in conjunction with risk scales for the diagnosis of PTE6 may need to be adjusted, due to the elevation of D-dimer in patients with severe SARS-CoV-2 infection.8 D-dimer cut-off values other than those habitually used for the general population have been proposed for the diagnosis of PTE and peripheral deep vein thrombosis (DVT).12,13,19 However, some of these studies only include critically ill patients treated in the ICU, and others only those with suspected DVT, with different inclusion criteria.
There is great heterogeneity in the results for the sensitivity, specificity and predictive values of different D-dimer levels evaluated in a number of studies that included patients with SARS-CoV-2 infection and suspected PTE.12,13,22–27 In our study, the optimal cut-off value for D-dimer obtained by analysing the ROC curves in patients with COVID-19 was 2200 μg/l. However, the sensitivity for this value was low (0.83) when compared to other values.
We obtained a higher sensitivity (0.91), as well as a higher negative predictive value, from values below 1500 μg/l.
Previous studies have proposed obtaining an optimal cut-off value through the Youden index. This is a statistical index whose result expresses the highest possible combined sensitivity and specificity. The level of 2590 μg/l was obtained in a previous study,24 with a sensitivity of 83.3% and a specificity of 83.8%. In this study, the patients had severity criteria (such as decreased saturation, tachycardia and rapid clinical deterioration) that could explain the higher cut-off value.
In a meta-analysis by Kwee et al.,19 a very similar cut-off value was proposed (2500 μg/l), obtaining a lower specificity (51%) and similar sensitivity (80%).
Higher D-dimer cut-off values have been analysed in other studies, obtaining lower sensitivity without providing a great increase in specificity. In one of these,15 the sensitivity found for the cut-off value of 5000 μg/l was 75%, with a specificity of 78% and a positive predictive value (PPV) of 70%. In our study, that cut-off value provided extremely low sensitivity of 34% for patients with COVID-19.
The diagnostic yield of D-dimer, evaluated through the AUC in our study, was good for the two subgroups of group A, and for the pre-pandemic group (group B), but we did not find significant differences when comparing the groups of patients with and without COVID-19. Similar results with AUC around 0.8 were published in patients with COVID-19 in another study with a design similar to ours.18 However, the results were not compared to those of patients without the disease.
In our study, the optimal D-dimer cut-off values obtained from the ROC curves provided low sensitivity in all groups. As determination of D-dimer was used to rule out patients with low-to-intermediate suspicion of PTE, optimal cut-off values for this purpose should be based on high sensitivity. In our study, this was seen with D-dimer values of 1500 μg/l in the patients with COVID-19.
In terms of the distribution of PTE, the relative frequency of peripheral PTE was higher in patients with COVID-19 (72.3%) than in those without COVID-19 (60.5%) and those from before the pandemic (44.2%), with statistically significant differences for the development of peripheral PTE in patients with COVID-19 compared to other patients. These results are similar to other studies, in all of which segmental or subsegmental distribution was predominant (55–70%).2,15,19,24,28 This distribution has been related in another study to the development of thrombosis in areas of the lung parenchyma with higher ground glass opacity on imaging.2 These findings are consistent with those found in post-mortem examinations of patients with COVID-19 of thrombosis in situ in small-lumen pulmonary arteries.19,29–31
Our study had a number of limitations. First of all, it was carried out retrospectively at a single centre. Secondly, the protocol for performing CT pulmonary angiogram during the pandemic continued to be the usual one, based on clinical guidelines, and no specific protocols were used for patients with COVID-19. Thirdly, there may be a bias in the classification within group A, due to the existence of false negatives in the PCR and the inclusion of some patients in the subgroup with COVID-19 despite them having a negative PCR; any such bias may attenuate the difference in optimal cut-off values found in the different groups. Fourthly, SARS-CoV-2 disease was not stratified by its extension, a factor that may influence the incidence of PTE. Fifthly, we did not adjust the cut-off values of D-dimer to the age of the patients, with this being a factor that could affect diagnostic yield. Lastly, this series was prior to the introduction of vaccination. Despite that, however, the results may be useful for describing the behaviour of an emerging disease such as COVID-19 and could be applicable in new pandemics.
In conclusion, our study provides evidence reinforcing the findings of a high incidence of thromboembolic complications in patients with COVID-19, with an absolute increase in the number of CT pulmonary angiograms and patients with PTE compared to a pre-pandemic period. The distribution of PTE is predominantly peripheral in patients with COVID-19. D-dimer cut-off values below 1500 μg/l provide over 90% sensitivity in patients with COVID-19.
Authorship- 1.
Responsible for the integrity of the study: JJAJ.
- 2.
Study conception: JMCG, JJAJ and EGG.
- 3.
Study design: JJAJ and AUV.
- 4.
Data collection: JMCG and PSS.
- 5.
Data analysis and interpretation: JMCG, JJAJ and EGG.
- 6.
Statistical processing: JMCG and JJAJ.
- 7.
Literature search: JJAJ and AUV.
- 8.
Drafting of the article: JMCG, JJAJ and AUV.
- 9.
Critical review of the manuscript with intellectually relevant contributions: JJAJ and EGG.
- 10.
Approval of the final version: JMCG, JJAJ, AUV, EGG and PSS.
The authors declare that they have no conflicts of interest.

