

Lower energy density diets tend to cost more, but data using different ways to calculate the dietary energy density, is scarce.
ObjectivesTo estimate the dietary energy density, and to assess how it is associated with the diet cost in children.
MethodsData were obtained from a community-based survey from public elementary schools in Portugal. Dietary intake of 464 children (6–12 years) was assessed by a 24h recall in 2007/2008. Dietary energy density (kcal/g) was calculated as following: (1) with food and all beverages (ED1), (2) with food and caloric beverages (ED2), and (3) only with food (ED3). Energy-adjusted diet cost (€/1000kcal) was calculated based on the collection of food prices from a national leader supermarket. Anthropometric measures were taken and socio-demographic data were obtained from parents. Logistic regression was used to estimate the association between diet cost and energy density.
ResultsFor boys, the energy-adjusted diet cost of the highest third of energy density was lower, between 81% in the ED3 (p for trend <0.001) and 87% in the ED1 (p for trend <0.001), compared to the lowest third. Girls showed similar, but weaker associations.
ConclusionsHigher dietary energy density was associated with lower dietary cost among children.
The epidemic of childhood obesity is a major public health concern with multiple causes.1–4 The rise in obesity prevalence is primarily caused by environmental changes affecting diet and activity levels, and it is associated with serious consequences to health5,6.
The World Health Organization considers reducing consumption of foods with high energy density (ED) a good strategy for weight control.7 The ED, i.e. available energy per unit weight (kcal/g),8 is considered an indicator of diet quality.9 Lean meats, fish, low-fat dairy products and fresh vegetables and fruit provide less energy per unit of weight than do fast foods, sweets, candy and desserts.10,11 Whereas energy-dense foods tend to be nutrient-poor, foods of low ED provide more nutrients relative to calories.12 An inverse relation between ED and nutrient density has been demonstrated both for individual foods12 and for total diets.13 Diets of low ED and high nutrient-content have been associated with less weight gain14 and with lower rates of obesity,11,15,16 type 2 diabetes,17 cardiovascular disease18,19 and some forms of cancer.20 In contrast, energy-dense diets have been linked to higher obesity rates and higher disease risk.21 Improving diet quality by lowering ED is standard advice for weight control,22–24 cancer prevention,25 and better health.7
Whereas the ED of foods can be easily obtained from nutrient-composition tables, calculation of the ED of the total diet is more difficult. Water is a major determinant of ED (0kcal/g), it contributes more to the weight of foods/diets than any macronutrient, thus energy-dense foods/diets are not necessarily those high in fat, but those that are dry.26 The calculations of dietary ED generally include all foods and caloric beverages but exclude noncaloric beverages and/or water.27,28 In some cases, both caloric and noncaloric beverages were excluded.9,28,29 To date, there is no consensus on a standard calculation method for ED which difficult the comparability of the results across studies using different formulas.
Evidence is accumulating that diet quality can be influenced by food prices and diet costs.30–34 Higher quality diets of lower ED are likely to cost more.9,29,35–48 Studies in some European countries, in the United States of America (USA), in Brazil and in Japan have revealed that consuming a diet rich in energy-dense products, such as fast foods, is generally cheaper than a diet with less energy-dense products, such as vegetables.27,29,39,41,45,48–51 These results are apparently consistent among children and adults, and suggest that food choice is not just a behavioral issue, but also an economic one.29,40,48,52–54 However, as far as we know, there are no published studies on the association between ED and diet cost, while using more than three different ways to calculate the dietary ED, in Mediterranean countries.
The objectives of this study were to estimate the dietary ED, using three different forms of calculation, and to assess how it is associated with the daily cost of the diet among school children.
MethodsParticipantsThe data were derived from a community-based survey of children selected from 7 of the eighty public elementary schools in the city of Guimarães, Portugal. Letters were distributed to all parents or guardians outlining the aims of the study along with a consent form. From the total of 586 children attending these schools, 464 (225 boys and 239 girls), between 6 and 12 years, accepted to participate in the study. Anthropometric measurements and dietary data were collected from all consenting children and questionnaires surveying sociodemographic and lifestyle information were distributed among the parents or educational guardians, of which 405 have answered (87%).
The study was approved by the University of Porto Ethics Committee, the schools where the study was carried out, and the Portuguese Data Protection Authority (CNPD-Comissão Nacional de Proteção de Dados, process number 7613/2008),55,56 being conducted between October 2007 and March 2008.
AssessmentsBoth measurements of height and weight were applied by previously trained health professionals or students and followed international standardized procedures.57,58 Children wore light indoor clothing and were barefooted. Weight was measured in an electronic scale, with an error of ±100g (Seca®, Model 703, Germany), and height was measured using a stadiometer, with the head in the Frankfort plane. Body Mass Index (BMI) was calculated using the following formula: weight (kg)/height2 (m)59 and children's weight status was defined through the International Obesity Task Force (IOTF) criteria and cut-points for BMI, defined specifically for sex and age.60 In order to analyze the results, only three categories were considered: under/normal weight, overweight and obesity.
Dietary intake information was assessed by a 24h recall, in which children were asked to recall all food and beverages consumed in the previous 24h. As an auxiliary tool to estimate sizes of food and beverages consumed, a photographic manual of portion sizes and household measures (MQA – Manual of Food Quantification) was used.61
To evaluate the mean population bias in reported energy intake, it was computed the ratio Energy Intake (EI):Basal Metabolic Rate (BMR) for each subject, according to gender and age-specific equation62 adopted by the FAO/UNU report (2004). BMR was determined through the Schofield equations and the subjects with EI:BMR ≤0.89 were classified as Low Energy Reporters (LER) and EI:BMR >0.89 as acceptable energy reporters.63
The socioeconomic information and family characteristics were collected from the survey directed to the parents or educational guardians. It contained questions about gender and age of children and parent's education, recoded into five categories of years: 0, 1–4, 5–9, 10–12, and more than 12 years of formal education. This information was further grouped for analysis into four categories: up to 5 years, between 5 and 9 years, 10–12 years and more than 12 years of education.
Estimation of diet costThe estimation of diet cost was divided in two tasks. First of all, the collection of prices, that took place between March and April of 2011. The source was an online supermarket, belonging to a Portuguese leader supermarket chain. Price data was obtained by gathering mean prices and correspondent food or package size, as well as the price per kilogram. Measurements were taken on regular prices, excluding discounts. In the case of composed dishes, diet costs were calculated using recipes from the Food Processor Plus® database and from an online website containing traditional Portuguese recipes.64 The price of the drinking water was estimated by computing the mean price of the bottled natural mineral water price and the municipal water price.
After this procedure, the food items were assigned into different groups according to the staple food that was in its origin and the median of the price per gram was computed. For example the price of rice was obtained by calculating the median of the prices of the various brands and types of rice available in the selected supermarket chain. The choice for using the median value and not the mean was based in the fact that, it represents better the values in the middle, minimizing the effect of the very high and very low prices, for each group. Finally, the cost of each meal was calculated according to the contribution of every food group and its quantity, for each meal consumed.
At dietary level, was calculated the variable Energy-adjusted Diet Cost, to eliminate the possible differences in cost related to differential energy intake between individuals. It was computed dividing the total diet cost (computed by summing the cost of each meal) by the energy consumed (€/kcal) and afterwards translated to €/1000kcal, in order to point differences which were not seen with previous unit.
Dietary energy densityDietary ED was defined as the energy consumed (kcal) divided by the total weight of foods and beverages (g). Following past models,65 it was calculated in three different ways: (1) on foods and all beverages, including drinking water (ED1); (2) on foods and only caloric beverages (water, non-caloric drinks as tea, and diet drinks (<10kcal/100g) were excluded) (ED2); and (3) on foods only, excluding all beverages, both caloric and non-caloric (ED3). Food was defined as solid food and liquids consumed as food (for example, soups, yogurt and milk).
Statistical analysisThe statistical analyses were performed using the software Statistical Package for the Social Sciences (SPSS), version 20.0. Descriptive statistics were used to characterize the sample (proportions, means and standard deviations).
Unconditional binary logistic regression models were fitted to estimate the magnitude of the association between energy-adjusted diet cost (considering two categories, using the median value as the cut-off), and dietary ED (in thirds).
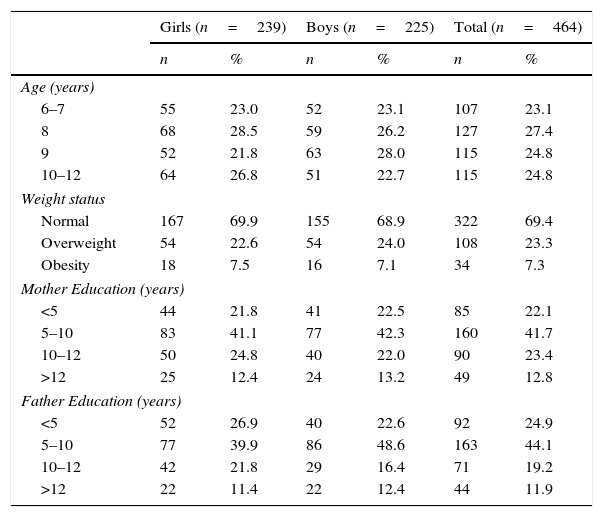
ResultsParticipants’ characterizationIn this sample of 464 children, the average age was 8.3 (±1.2) years, 51.5% of them were girls and the prevalence of overweight status and obesity were 23.3% (22.6% in girls and 24.0% in boys) and 7.3% (7.5% in girls and 7.1% in boys), respectively. Approximately two-thirds of the study population had parents with less than 10 years of formal education (Table 1). Sixteen (3.4%) children were found as LER and were excluded in the final analyses. Mean energy intake was 1944.4kcal (±575.9) in girls and 2178.7kcal (±672.7) in boys (p<0.001).
Participants’ characteristics.
| Girls (n=239) | Boys (n=225) | Total (n=464) | ||||
|---|---|---|---|---|---|---|
| n | % | n | % | n | % | |
| Age (years) | ||||||
| 6–7 | 55 | 23.0 | 52 | 23.1 | 107 | 23.1 |
| 8 | 68 | 28.5 | 59 | 26.2 | 127 | 27.4 |
| 9 | 52 | 21.8 | 63 | 28.0 | 115 | 24.8 |
| 10–12 | 64 | 26.8 | 51 | 22.7 | 115 | 24.8 |
| Weight status | ||||||
| Normal | 167 | 69.9 | 155 | 68.9 | 322 | 69.4 |
| Overweight | 54 | 22.6 | 54 | 24.0 | 108 | 23.3 |
| Obesity | 18 | 7.5 | 16 | 7.1 | 34 | 7.3 |
| Mother Education (years) | ||||||
| <5 | 44 | 21.8 | 41 | 22.5 | 85 | 22.1 |
| 5–10 | 83 | 41.1 | 77 | 42.3 | 160 | 41.7 |
| 10–12 | 50 | 24.8 | 40 | 22.0 | 90 | 23.4 |
| >12 | 25 | 12.4 | 24 | 13.2 | 49 | 12.8 |
| Father Education (years) | ||||||
| <5 | 52 | 26.9 | 40 | 22.6 | 92 | 24.9 |
| 5–10 | 77 | 39.9 | 86 | 48.6 | 163 | 44.1 |
| 10–12 | 42 | 21.8 | 29 | 16.4 | 71 | 19.2 |
| >12 | 22 | 11.4 | 22 | 12.4 | 44 | 11.9 |
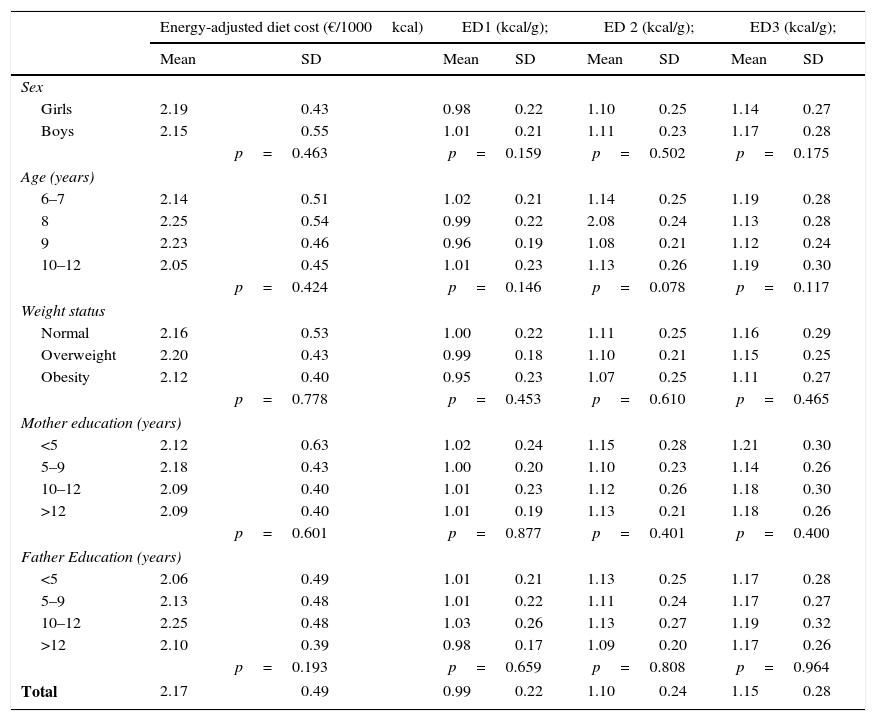
Crude diet cost was lower in girls compared to boys (4.42€/day±1.19 vs. 4.73€/day±1.28, p=0.021). No meaningful or consistent variation on energy-adjusted diet cost and dietary ED was observed between genders, age, weight and parental education. The average of the energy-adjusted diet cost was 2.17€/1000kcal (SD±0.49). The distributions of the three EDs were statistically different, being higher the ED3 – calculated excluding all beverages (1.15kcal (SD±0.28) vs. ED2: 1.10kcal/g; SD±0.24 vs. ED1: 0.99kcal/g; SD±0.22) (Table 2).
Energy-adjusted diet cost and dietary energy density, according to participant's characteristics.
| Energy-adjusted diet cost (€/1000kcal) | ED1 (kcal/g); | ED 2 (kcal/g); | ED3 (kcal/g); | |||||
|---|---|---|---|---|---|---|---|---|
| Mean | SD | Mean | SD | Mean | SD | Mean | SD | |
| Sex | ||||||||
| Girls | 2.19 | 0.43 | 0.98 | 0.22 | 1.10 | 0.25 | 1.14 | 0.27 |
| Boys | 2.15 | 0.55 | 1.01 | 0.21 | 1.11 | 0.23 | 1.17 | 0.28 |
| p=0.463 | p=0.159 | p=0.502 | p=0.175 | |||||
| Age (years) | ||||||||
| 6–7 | 2.14 | 0.51 | 1.02 | 0.21 | 1.14 | 0.25 | 1.19 | 0.28 |
| 8 | 2.25 | 0.54 | 0.99 | 0.22 | 2.08 | 0.24 | 1.13 | 0.28 |
| 9 | 2.23 | 0.46 | 0.96 | 0.19 | 1.08 | 0.21 | 1.12 | 0.24 |
| 10–12 | 2.05 | 0.45 | 1.01 | 0.23 | 1.13 | 0.26 | 1.19 | 0.30 |
| p=0.424 | p=0.146 | p=0.078 | p=0.117 | |||||
| Weight status | ||||||||
| Normal | 2.16 | 0.53 | 1.00 | 0.22 | 1.11 | 0.25 | 1.16 | 0.29 |
| Overweight | 2.20 | 0.43 | 0.99 | 0.18 | 1.10 | 0.21 | 1.15 | 0.25 |
| Obesity | 2.12 | 0.40 | 0.95 | 0.23 | 1.07 | 0.25 | 1.11 | 0.27 |
| p=0.778 | p=0.453 | p=0.610 | p=0.465 | |||||
| Mother education (years) | ||||||||
| <5 | 2.12 | 0.63 | 1.02 | 0.24 | 1.15 | 0.28 | 1.21 | 0.30 |
| 5–9 | 2.18 | 0.43 | 1.00 | 0.20 | 1.10 | 0.23 | 1.14 | 0.26 |
| 10–12 | 2.09 | 0.40 | 1.01 | 0.23 | 1.12 | 0.26 | 1.18 | 0.30 |
| >12 | 2.09 | 0.40 | 1.01 | 0.19 | 1.13 | 0.21 | 1.18 | 0.26 |
| p=0.601 | p=0.877 | p=0.401 | p=0.400 | |||||
| Father Education (years) | ||||||||
| <5 | 2.06 | 0.49 | 1.01 | 0.21 | 1.13 | 0.25 | 1.17 | 0.28 |
| 5–9 | 2.13 | 0.48 | 1.01 | 0.22 | 1.11 | 0.24 | 1.17 | 0.27 |
| 10–12 | 2.25 | 0.48 | 1.03 | 0.26 | 1.13 | 0.27 | 1.19 | 0.32 |
| >12 | 2.10 | 0.39 | 0.98 | 0.17 | 1.09 | 0.20 | 1.17 | 0.26 |
| p=0.193 | p=0.659 | p=0.808 | p=0.964 | |||||
| Total | 2.17 | 0.49 | 0.99 | 0.22 | 1.10 | 0.24 | 1.15 | 0.28 |
ED1, energy density calculated including food and all beverages (kcal/g); ED2, energy density calculated including food and caloric beverages (kcal/g); ED3, energy density calculated excluding all beverages (kcal/g); SD, standard deviation.
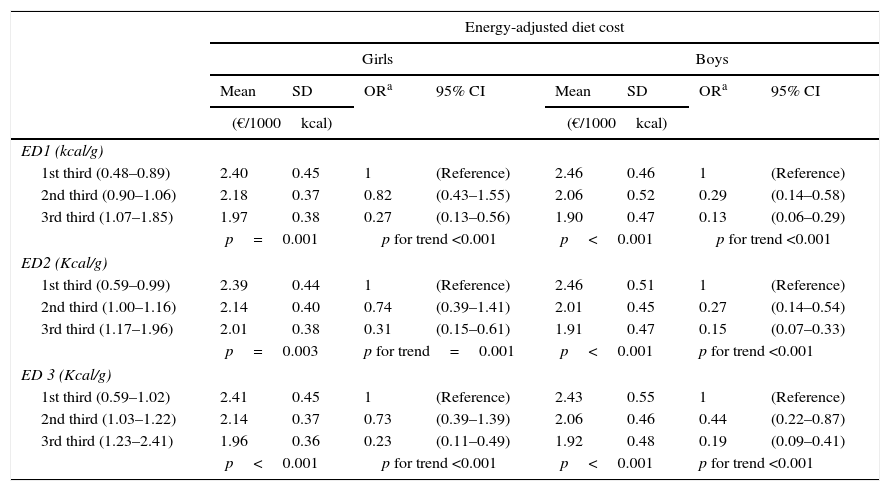
Age-adjusted results showed that, regardless of the method of calculating ED, the diet cost was significantly negatively associated with dietary ED, for both genders. For boys, the energy-adjusted diet cost of the highest third of ED was lower, between 81% in the ED3 (p for trend <0.001) and 87% in the ED1 (p for trend <0.001), compared to the lowest third. Girls showed similar, but weaker associations between ED and diet cost. The energy-adjusted diet cost was lower, between 69% in the ED2 (p for trend=0.001) and 77% in the ED3 (p for trend<0.001) in the 3rd third compared to the 1st third of ED (Table 3).
Energy-adjusted diet cost (Mean, SD) and Odds Ratios for energy-adjusted diet cost according to energy density (thirds).
| Energy-adjusted diet cost | ||||||||
|---|---|---|---|---|---|---|---|---|
| Girls | Boys | |||||||
| Mean | SD | ORa | 95% CI | Mean | SD | ORa | 95% CI | |
| (€/1000kcal) | (€/1000kcal) | |||||||
| ED1 (kcal/g) | ||||||||
| 1st third (0.48–0.89) | 2.40 | 0.45 | 1 | (Reference) | 2.46 | 0.46 | 1 | (Reference) |
| 2nd third (0.90–1.06) | 2.18 | 0.37 | 0.82 | (0.43–1.55) | 2.06 | 0.52 | 0.29 | (0.14–0.58) |
| 3rd third (1.07–1.85) | 1.97 | 0.38 | 0.27 | (0.13–0.56) | 1.90 | 0.47 | 0.13 | (0.06–0.29) |
| p=0.001 | p for trend <0.001 | p<0.001 | p for trend <0.001 | |||||
| ED2 (Kcal/g) | ||||||||
| 1st third (0.59–0.99) | 2.39 | 0.44 | 1 | (Reference) | 2.46 | 0.51 | 1 | (Reference) |
| 2nd third (1.00–1.16) | 2.14 | 0.40 | 0.74 | (0.39–1.41) | 2.01 | 0.45 | 0.27 | (0.14–0.54) |
| 3rd third (1.17–1.96) | 2.01 | 0.38 | 0.31 | (0.15–0.61) | 1.91 | 0.47 | 0.15 | (0.07–0.33) |
| p=0.003 | p for trend=0.001 | p<0.001 | p for trend <0.001 | |||||
| ED 3 (Kcal/g) | ||||||||
| 1st third (0.59–1.02) | 2.41 | 0.45 | 1 | (Reference) | 2.43 | 0.55 | 1 | (Reference) |
| 2nd third (1.03–1.22) | 2.14 | 0.37 | 0.73 | (0.39–1.39) | 2.06 | 0.46 | 0.44 | (0.22–0.87) |
| 3rd third (1.23–2.41) | 1.96 | 0.36 | 0.23 | (0.11–0.49) | 1.92 | 0.48 | 0.19 | (0.09–0.41) |
| p<0.001 | p for trend <0.001 | p<0.001 | p for trend <0.001 | |||||
ED1, energy density calculated including food and all beverages (kcal/g); ED2, energy density calculated including food and caloric beverages (kcal/g); ED3, energy density calculated excluding all beverages (kcal/g); SD, standard deviation; OR, odds ratio; 95% CI, 95% confidence interval.
The present study showed that lower energy-density diets were associated with higher diet cost in this sample of school children. This is in line with previous findings.9,29,43,66 Cross-sectional surveys that used representative samples of adults in France,13,29,41 USA13 and England,36 and also children's samples,54 have produced evidence that energy-dense diets were indeed associated with lower energy-adjusted diet cost. To our knowledge, our study is the first in a Mediterranean country confirming the suggested inverse association between dietary ED and energy-adjusted cost in composed children diets, regardless the differences between the EDs calculated by three distinct methods.
According to Glanz et al, taste, cost, and convenience are the principal factors affecting food choice.67 Of these factors, food cost has captured research attention in the last decade.68–70 Furthermore, evidence is accumulating that diet quality is influenced by food prices and diet cost.35 As food prices rise, the first items to drop out of the diet are vegetables and fruit, followed by high-quality lean protein. The resulting lower cost diets, high in added sugars and added fats, tend to be energy dense but nutrient poor.13 Given their low-cost, such diets may be preferentially selected by lower socioeconomic position (SEP) families, who cannot waste great part of the household income in healthy foods27,30,71. The three most common SEP markers are education, disposable income and occupation,72 however the only SEP indicator studied in this research was the parental education, revealing no significant association with diet cost or dietary ED. Recent studies have shown that financial situation, rather than education, is associated with the consumption of low energy-dense foods.53,73 Knowledge of disposable income and/or the current financial situation of children's families, covered in a subsequent research, might help to study the relationship between SEP groups and diet cost, as it was described as a better SEP indicator with regard to food budget choice.74 In fact, energy-dense sweats and fats are tasty, cheap, readily available, and convenient. When kitchen facilities, cooking skills, money or time are limited or absent, they offer satisfying options, although nutrient-poor. They also help to reduce waste, spoilage, and cooking costs. Not surprisingly, they are often chosen in preference to fresh products and other more nutrient rich foods, specially by lower income groups.51
Our study has several limitations that are worth noting. First, dietary intake and cost estimates were derived from a 24h recall. The use of this instrument may have compromised the collected information, since it has been recognized that children younger than 8 years-old may not accurately recall foods and estimate portion sizes.75 Nevertheless only approximately a quarter of our sample was younger than 8 years-old. In addition, single 24h recall may not be reflective of usual dietary intakes for each child, and may fail to include foods and beverages that are either forgotten or consumed infrequently. However, given the reasonable sample size, this effect may be diluted as a whole. Second, the use of the average price do not capture differences between brand foods and consequently underestimate the variability of food prices and of the costs associated with individual food consumption,69 which may contribute to explain the lack of association between diet cost and parental education. On the other hand, the food price collection was based in only one source, which was minimized by the fact that the supermarket chain where the prices were collected has the largest share of food market in Portugal. Also, food prices were collected three years after the investigation was conducted, and they might have changed during the interval time. Some authors have shown that the disparity in cost is increasing over time.76,77 In the United States, a recent study showed that the lowest-energy-density foods, mostly fresh vegetables and fruit, increased in price by almost 20% over a 2-year period, whereas energy dense sugars and fats did not.77 Nevertheless, similarly to our study, the majority of the researches estimated the cost of the diet by linking retail food prices with standard dietary assessment instruments.9,71,78 As a result, such studies essentially provide information on the price of healthful diets and do not necessarily reflect what respondents actually paid for the foods they consumed.
In addition, the seasonal variability of fresh foods production, namely fruits and vegetables, may have compromised the accuracy of the prices collected, due to the fact that food prices were gathered in a different season of the survey. Nevertheless, it is expected that, in all seasons, the prices of fresh products whose production is seasonally variable, vary so that the rise in some prices is offset by a decline of others.
Furthermore, since our study had a cross-sectional design, we are limited to demonstrate associations and not the direction of the associations.
Despite these limitations, our estimates of dietary ED and diet cost were comparable to those obtained from other sources. For example, Monsivais et al. also verified that higher food expenditures were strongly and positively associated with lower ED, despite their dietary assessment method differed from ours.54
The number of studies that used ED as an indicator of diet quality has been rising.9,29,54,65,71 A study conducted in Sweden in 2010 by Patterson et al. showed that lower dietary ED is associated with better dietary quality in children and adolescents.79 This result is in line with other study, on a large USA food survey database.80 Furthermore, ED presents some advantages over other whole diet analysis methods, as it is simple of being calculated and available from all types of dietary data in which the information of food and beverage energy and intakes are accessible. For these reasons, Patterson et al. defends that it may be suitable as a simple proxy of diet quality.79 Nevertheless, there is some controversy within the calculation method of ED. The generally accepted definition for ED is kilocalories/gram of food consumed. The primary methodological difference in the calculations involve whether beverages should be included or excluded. Values for ED reported in the literature have been calculated by a variety of methods, which, in addition to foods, include different combinations of beverages,65,81 such as: all beverages, all beverages except water, and excluding all types of beverages. A widely cited study that determined ED using eight calculation methods65 showed that ED varied by gender, age and race/ethnicity. The authors concluded that investigators examining ED may have to use several calculation methods to better understand the influence of different types of beverages on energy intake, and recommended that future work was needed to better understand the best way to deal with beverages when investigating ED. These results pose some implications for the scientists, since the definition of ED is not as straight forward and more research is needed to validate an appropriate definition.
Up until now, the majority of the studies on the association between ED and dietary cost were restricted to adults in the USA and in some European countries, and have used only one method to calculate dietary ED. Our study provides data on the topic, using different ways to calculate the ED, in a Mediterranean country, with different cultural and dietary habits. This may have important implications for obesity research. When healthier diets tend to cost more, economics may be of similar relevance in the onset of obesity as, for example, biological preferences for sugar and fat, growing portion sizes, caloric beverages, or the contribution of eating away from home.42,50
As the food choice seems to be strongly influenced by the food price, these economic factors may pose a barrier to purchasing healthful foods for children. The availability of such data is of main importance to study the economics of childhood obesity and healthy diets, and is needed in the aim of making the healthier choice the easier and more affordable. With these constraints in mind, public health nutritionists and policy makers can promote improvements to dietary guidance and nutrition policy that are economically feasible for the target populations.
Conflict of interestsThere are no conflicts of interest declared.
Authors’ contributionAPF, PM and PP designed the study; APF, GA, PM, RR, AA, VT, RB, OL, AM and PP conducted the study; RR, AA, OL and GA collected the data; APF, PM, and PP analyzed the data; APF and PP wrote the manuscript. All authors read and approved the final manuscript.