


The minimum basic dataset is the largest available hospital care administrative database that is used in clinical studies and hospital management in association with diagnosis-related groups (DRGs). In 2011, the quality of the national MBDS in hospital discharges was audited, in order to assess its reliability. This paper presents a sub-analysis of the results from that analysis which are referred to cerebrovascular disease (CVD).
MethodsUsing all discharge reports from the Spanish MBDS in 2009, a representative sample was obtained by stratified sampling and 11209 records were evaluated. Outcome indicators were obtained to measure any differences observed between the national MBDS being evaluated and the hospital's original MBDS. Analysis of codes for CVD as a primary diagnosis was performed for ICD-9-CM diagnostic categories 430 through 438. We evaluated error rates in the selection and classification of main diagnoses, as well as in DRG assignment.
ResultsThere were 397 discharges of cases of CVD which included 21 different DRGs. Diagnostic coding showed a concordance rate of 81.87%; the selection error rate was 2.26% and the classification error rate was 15.87%. The error rate in the DRG was 16.12% and associated with the greatest impact on the mortality risk level.
ConclusionsWhile the errors we observed must be taken into account, data suggest that the quality of the MBDS for CVD is sufficient to ensure delivery of valid information. The hospital discharge registry serves as a valuable tool for use in studies of this disease.
El conjunto mínimo básico de datos (CMBD) es la mayor base de datos clínico-administrativa hospitalaria disponible, empleada en estudios clínicos y en gestión hospitalaria, a través de los grupos relacionados con el diagnóstico (GRD). En 2011 se acometió una auditoría de la calidad del CMBD en las altas hospitalarias, a fin de evaluar su fiabilidad. Este trabajo constituye un subanálisis de los resultados, referidos a enfermedad cerebrovascular (ECV).
MétodosDe todas las altas del CMBD estatal del 2009, se obtuvo una muestra representativa, evaluándose 11.209 historias clínicas. Los indicadores de resultado se obtuvieron como medida de las diferencias observadas entre el CMBD evaluado y el CMBD original del hospital. El análisis de la codificación de la ECV como diagnóstico principal se realizó sobre las categorías diagnósticas CIE-9-MC 430-438. Se evaluaron las tasas de error en la selección y clasificación del diagnóstico principal, así como en la asignación del GRD.
ResultadosSe observaron 397 altas por ECV, incluyendo 21 GRD diferentes. La codificación mostró una concordancia del 81,87%, siendo la tasa de error de selección del 2,26% y de error de clasificación del 15,87%. La tasa de error en los GRD fue del 16,12%, con mayor repercusión sobre el nivel de riesgo de mortalidad.
ConclusionesSi bien los errores observados deben ser considerados, los resultados obtenidos indican que la calidad del CMBD en la ECV permite garantizar la obtención de información válida. El registro de altas hospitalarias puede ser una herramienta valiosa a la hora de acometer estudios sobre esta enfermedad.
The minimum basic dataset (MBDS) is the largest administrative database on hospitalised patients, as well as the main source of information on morbidity in patients receiving care.1 It includes copious information on different aspects of hospital activity that can be used to analyse variability in clinical practice2 and care quality.3
The MBDS at discharge (MBDSD) consists of the hospital discharge records pertaining to the information service run by the Spanish National Health System (SNHS), which reports to the Ministry of Health, Social Services, and Equality. One of the reasons why these records are so valuable is that providing this information is compulsory for both private and public healthcare entities.
This database is used to generate different sets of official statistics, and it is also useful for numerous clinical research projects. Furthermore, its use of the diagnosis-related group (DRG) system, which sorts patients into homogeneous groups according to their clinical characteristics and use of resources, has served as a baseline for the development of indicators and operating standards, including costs and their relative weights, used by the SNHS as references.5 The dataset is very useful for performing comparative analyses in the context of hospital management. In the specific case of cerebrovascular disease (CVD), it has also been helpful for assessing healthcare quality,6,7 as well as the morbidity and mortality burden.8 In our setting, Matías-Guiu9 and Marrugat10 have supported using the MBDSD to study the epidemiology of this disease.
However, several Spanish and international studies have questioned the accuracy of discharge records as a valid data source for quality of care assessments.11,12 These studies recommend systematic evaluation and quality control of the records.13 Regarding coding stroke cases, earlier studies from other countries have revealed coding mistakes that could be identified in 15%-20% of the total discharge reports.14
By implementing the SNHS quality plan, the Ministry of Health, Social Services, and Equality has completed a series of actions aimed at improving information systems and including a quality audit of discharge data from the MBDS. A similar initiative was carried out by the former Spanish Institute of Health in 1993,4 in addition to different audits performed individually within the framework of the cost-based DRG weight estimations completed by the SNHS. Findings from an audit of healthcare data, carried out by the Canadian Institute for Health Information between 2005 and 2006 as part of a quality improvement programme, also served as a reference.15
The actions taken by the former Spanish Institute of Health, responsible for the MBDS, aimed at assessing reliability of the information and providing stakeholders with evidence on the quality of MBDSD records for the purpose of improving them.
The aim of this study is to perform a subanalysis focusing exclusively on CVD and based on the results for this group of diseases only obtained by the assessment mentioned above.
Material and methodsUsing the 3742850 discharge reports corresponding to care in the 300 SNHS hospitals and included in the Spanish MBDSD in 2009, we extracted a representative sample of cases. We applied stratified sampling method including a first stage for selecting hospitals and a second stage for selecting discharge records from each hospital.
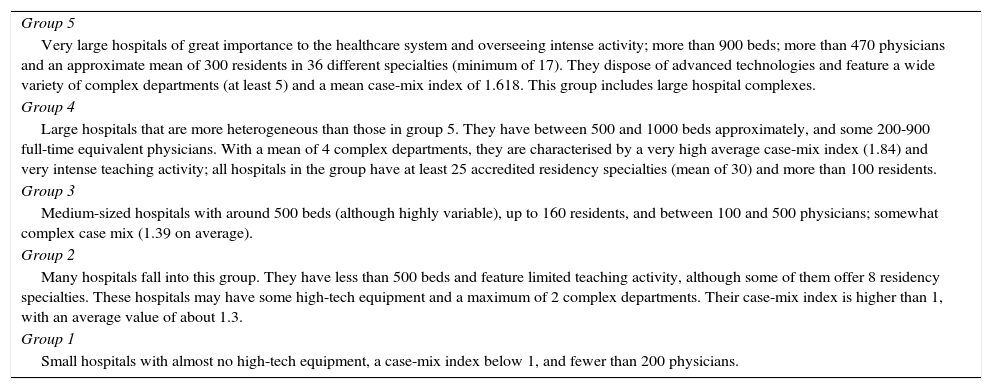
In the first stage, we selected 30 hospitals that were stratified according to a hospital cluster (1-5) defined by size and case-mix complexity (Table 1). Selection from each cluster was random and took into account the number and size of the hospitals included in each cluster. Probability was proportional to the size of the hospital, defined by the number of discharges in 2009.
Characteristics of hospital clusters.
| Group 5 |
| Very large hospitals of great importance to the healthcare system and overseeing intense activity; more than 900 beds; more than 470 physicians and an approximate mean of 300 residents in 36 different specialties (minimum of 17). They dispose of advanced technologies and feature a wide variety of complex departments (at least 5) and a mean case-mix index of 1.618. This group includes large hospital complexes. |
| Group 4 |
| Large hospitals that are more heterogeneous than those in group 5. They have between 500 and 1000 beds approximately, and some 200-900 full-time equivalent physicians. With a mean of 4 complex departments, they are characterised by a very high average case-mix index (1.84) and very intense teaching activity; all hospitals in the group have at least 25 accredited residency specialties (mean of 30) and more than 100 residents. |
| Group 3 |
| Medium-sized hospitals with around 500 beds (although highly variable), up to 160 residents, and between 100 and 500 physicians; somewhat complex case mix (1.39 on average). |
| Group 2 |
| Many hospitals fall into this group. They have less than 500 beds and feature limited teaching activity, although some of them offer 8 residency specialties. These hospitals may have some high-tech equipment and a maximum of 2 complex departments. Their case-mix index is higher than 1, with an average value of about 1.3. |
| Group 1 |
| Small hospitals with almost no high-tech equipment, a case-mix index below 1, and fewer than 200 physicians. |
In the second stage, we selected cases using simple random sampling, calculating the size of the sample for a selection error of 12% of the sample for the principal diagnosis, with a 95% confidence interval, and 3.2% accuracy. The total number of discharge records was 11209. The assessment was conducted during the second semester of 2011 and followed a previously established review process in every hospital. Teams of 4 raters undertook this task for 3 days (72 in total). Each rater extracted data from histories and established a new MBDSD for the sample. They had access to the original MBDS previously recorded by the hospital. They also had a “Manual for the assessment of the MBDS on admission” from the SNHS, containing common assessment criteria. All raters had at least 3 years of previous experience in MBDS clinical coding and had completed refresher courses on coding in the preceding 3 years. Furthermore, they were not professionally linked to the hospitals they were assessing.
The primary outcome measure was interrater concordance, which was defined using indicators obtained to measure the differences between the MBDS fields resulting from the assessment and those originally assigned by the hospital. These differences were due to raters’ discrepancies with the original MBDS after reviewing the full clinical record of the episode associated with the discharge report. In all cases where discrepancies were observed, the rater's opinion was considered the “gold standard” such that the code in the original MBDS was listed as an “error”.
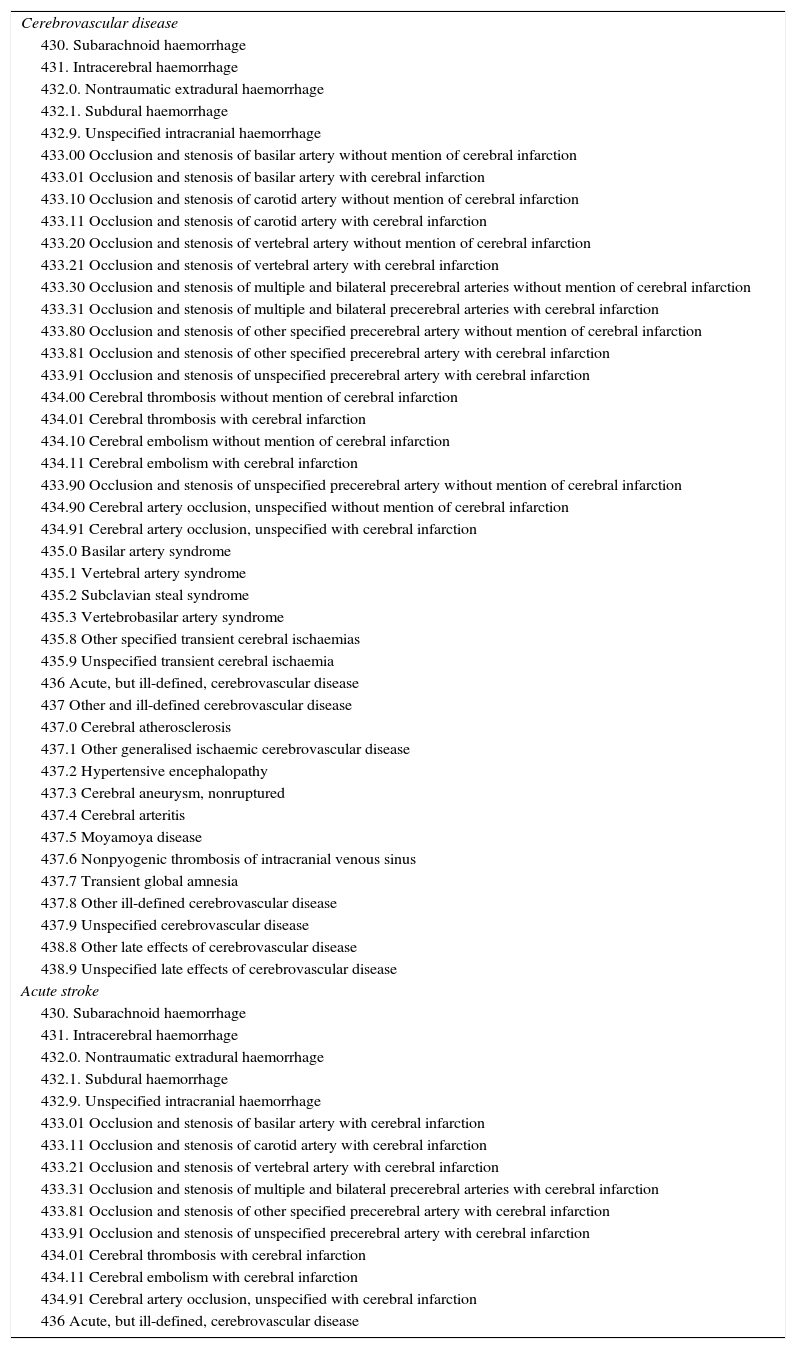
The analysis of the coding of CVD as primary diagnosis was performed using the International Classification of Diseases, Ninth Revision, Clinical Modification (ICD-9-CM),16 specifically its diagnostic categories 430-438. Furthermore, our analysis specifically considered the clinical entity known as “acute stroke” according to criteria given by the Agency for Healthcare Research and Quality17 (Table 2). We did not review procedure coding since procedure codes provide a less complete picture and are much less precise at differentiating between procedures. This option is a lower priority for future studies using this methodology.
ICD-9-CM diagnostic categories: cerebrovascular disease and acute stroke.
| Cerebrovascular disease |
| 430. Subarachnoid haemorrhage |
| 431. Intracerebral haemorrhage |
| 432.0. Nontraumatic extradural haemorrhage |
| 432.1. Subdural haemorrhage |
| 432.9. Unspecified intracranial haemorrhage |
| 433.00 Occlusion and stenosis of basilar artery without mention of cerebral infarction |
| 433.01 Occlusion and stenosis of basilar artery with cerebral infarction |
| 433.10 Occlusion and stenosis of carotid artery without mention of cerebral infarction |
| 433.11 Occlusion and stenosis of carotid artery with cerebral infarction |
| 433.20 Occlusion and stenosis of vertebral artery without mention of cerebral infarction |
| 433.21 Occlusion and stenosis of vertebral artery with cerebral infarction |
| 433.30 Occlusion and stenosis of multiple and bilateral precerebral arteries without mention of cerebral infarction |
| 433.31 Occlusion and stenosis of multiple and bilateral precerebral arteries with cerebral infarction |
| 433.80 Occlusion and stenosis of other specified precerebral artery without mention of cerebral infarction |
| 433.81 Occlusion and stenosis of other specified precerebral artery with cerebral infarction |
| 433.91 Occlusion and stenosis of unspecified precerebral artery with cerebral infarction |
| 434.00 Cerebral thrombosis without mention of cerebral infarction |
| 434.01 Cerebral thrombosis with cerebral infarction |
| 434.10 Cerebral embolism without mention of cerebral infarction |
| 434.11 Cerebral embolism with cerebral infarction |
| 433.90 Occlusion and stenosis of unspecified precerebral artery without mention of cerebral infarction |
| 434.90 Cerebral artery occlusion, unspecified without mention of cerebral infarction |
| 434.91 Cerebral artery occlusion, unspecified with cerebral infarction |
| 435.0 Basilar artery syndrome |
| 435.1 Vertebral artery syndrome |
| 435.2 Subclavian steal syndrome |
| 435.3 Vertebrobasilar artery syndrome |
| 435.8 Other specified transient cerebral ischaemias |
| 435.9 Unspecified transient cerebral ischaemia |
| 436 Acute, but ill-defined, cerebrovascular disease |
| 437 Other and ill-defined cerebrovascular disease |
| 437.0 Cerebral atherosclerosis |
| 437.1 Other generalised ischaemic cerebrovascular disease |
| 437.2 Hypertensive encephalopathy |
| 437.3 Cerebral aneurysm, nonruptured |
| 437.4 Cerebral arteritis |
| 437.5 Moyamoya disease |
| 437.6 Nonpyogenic thrombosis of intracranial venous sinus |
| 437.7 Transient global amnesia |
| 437.8 Other ill-defined cerebrovascular disease |
| 437.9 Unspecified cerebrovascular disease |
| 438.8 Other late effects of cerebrovascular disease |
| 438.9 Unspecified late effects of cerebrovascular disease |
| Acute stroke |
| 430. Subarachnoid haemorrhage |
| 431. Intracerebral haemorrhage |
| 432.0. Nontraumatic extradural haemorrhage |
| 432.1. Subdural haemorrhage |
| 432.9. Unspecified intracranial haemorrhage |
| 433.01 Occlusion and stenosis of basilar artery with cerebral infarction |
| 433.11 Occlusion and stenosis of carotid artery with cerebral infarction |
| 433.21 Occlusion and stenosis of vertebral artery with cerebral infarction |
| 433.31 Occlusion and stenosis of multiple and bilateral precerebral arteries with cerebral infarction |
| 433.81 Occlusion and stenosis of other specified precerebral artery with cerebral infarction |
| 433.91 Occlusion and stenosis of unspecified precerebral artery with cerebral infarction |
| 434.01 Cerebral thrombosis with cerebral infarction |
| 434.11 Cerebral embolism with cerebral infarction |
| 434.91 Cerebral artery occlusion, unspecified with cerebral infarction |
| 436 Acute, but ill-defined, cerebrovascular disease |
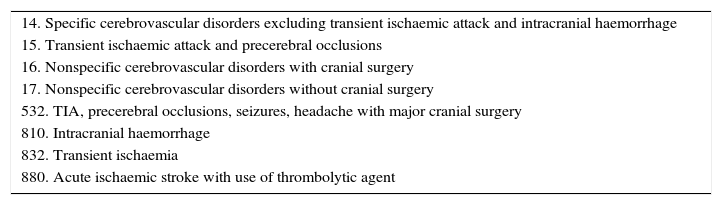
Unlike the original analysis of the Spanish MBDS, which used a larger number of indicators, we obtained indicators related to principal diagnosis and variables associated with assignment of DRG (Table 3) for our CVD subanalysis. The database created during the audit and accessible during the subanalysis did not include demographic variables (age, mean stay, etc.) or data on hospital type, so no relationships among these variables were studied.
GRD categories: cerebrovascular disease.
| 14. Specific cerebrovascular disorders excluding transient ischaemic attack and intracranial haemorrhage |
| 15. Transient ischaemic attack and precerebral occlusions |
| 16. Nonspecific cerebrovascular disorders with cranial surgery |
| 17. Nonspecific cerebrovascular disorders without cranial surgery |
| 532. TIA, precerebral occlusions, seizures, headache with major cranial surgery |
| 810. Intracranial haemorrhage |
| 832. Transient ischaemia |
| 880. Acute ischaemic stroke with use of thrombolytic agent |
We calculated the total error rates for selection and classification of the principal diagnosis.
The selection error rate measures the number of discharges to which raters assigned a primary diagnosis different from that reported in the hospital's original MBDS.
The classification error rate measures the number of discharges to which raters recognised the same primary diagnosis as that reported in the hospital's original MBDS, but detected a different ICD-9-CM code.
In the area of DRGs, we considered the percentage of discharge reports for which a previously assigned DRG was modified, rate of change in DRG weight, and the rate of change in mortality risk for the DRG.
ResultsThere were a total of 397 discharges with a principal diagnosis of CVD; these included 21 different DRGs.
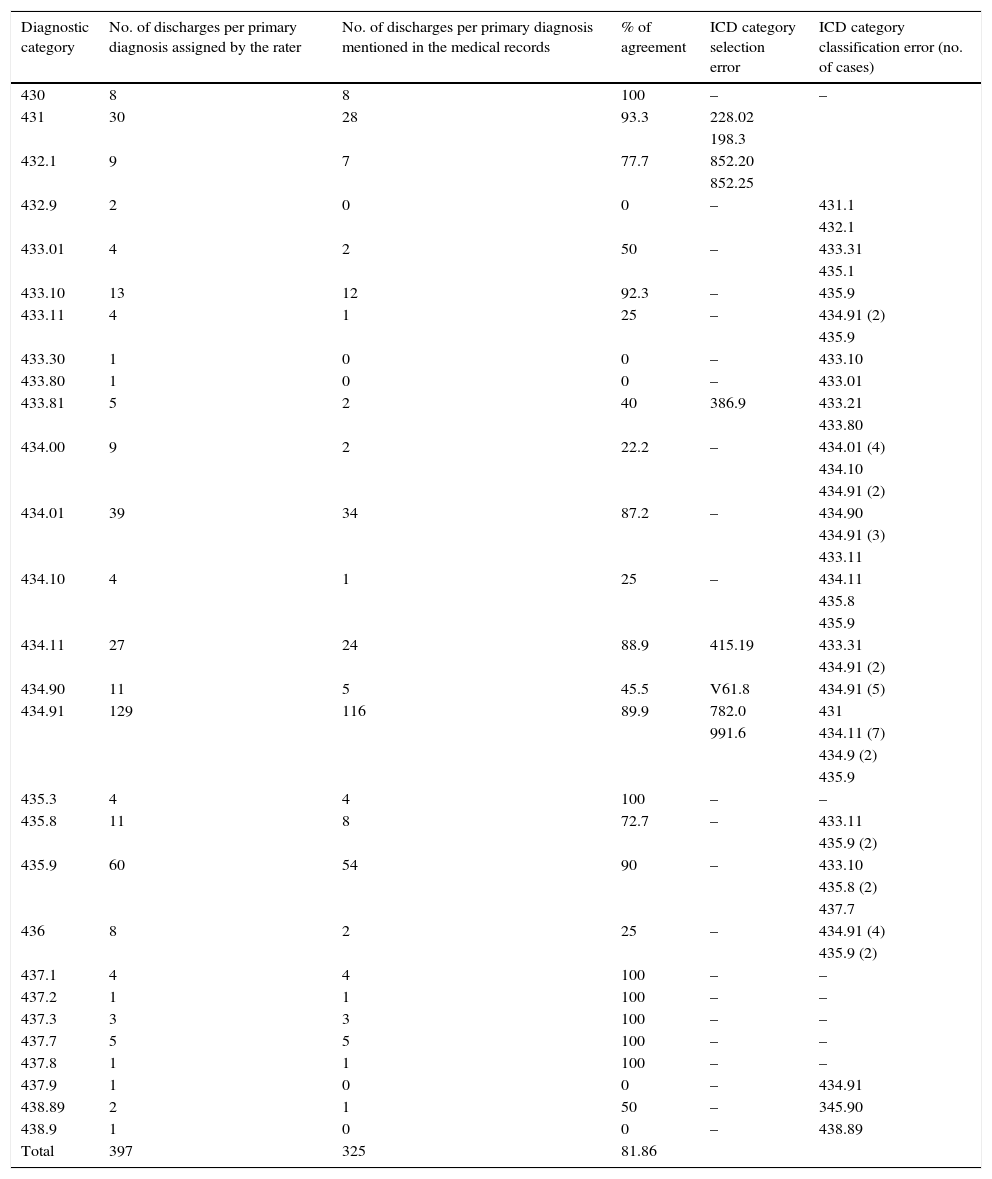
The most frequent diagnostic categories were 434.91, “Cerebral artery occlusion, unspecified with cerebral infarction” (129 cases), and 435.9, “Unspecified transient cerebral ischemia” (60 cases).
Considering the total discharge reports from SNHS hospitals, CVD coding by ICD categories showed a concordance rate of 81.87%; the selection error rate was 2.26% and the classification error rate was 15.87%. In the most frequent categories, classification was usually correct (89.92% for code 434.91, and 90% for code 435.9).
Selection and classification errors resulted in a wide variety of diagnostic categories being assigned, with no single category predominating. We observed only a discrete tendency to assign “Cerebral embolism with cerebral infarction” to entities which raters later classified as “Cerebral artery occlusion, unspecified with cerebral infarction”. Diagnostic categories with the highest error rate were also the least frequent, so these errors have only a limited impact on overall data quality (Table 4).
ICD classification of the primary diagnosis: CVD.
| Diagnostic category | No. of discharges per primary diagnosis assigned by the rater | No. of discharges per primary diagnosis mentioned in the medical records | % of agreement | ICD category selection error | ICD category classification error (no. of cases) |
|---|---|---|---|---|---|
| 430 | 8 | 8 | 100 | – | – |
| 431 | 30 | 28 | 93.3 | 228.02 | |
| 198.3 | |||||
| 432.1 | 9 | 7 | 77.7 | 852.20 | |
| 852.25 | |||||
| 432.9 | 2 | 0 | 0 | – | 431.1 |
| 432.1 | |||||
| 433.01 | 4 | 2 | 50 | – | 433.31 |
| 435.1 | |||||
| 433.10 | 13 | 12 | 92.3 | – | 435.9 |
| 433.11 | 4 | 1 | 25 | – | 434.91 (2) |
| 435.9 | |||||
| 433.30 | 1 | 0 | 0 | – | 433.10 |
| 433.80 | 1 | 0 | 0 | – | 433.01 |
| 433.81 | 5 | 2 | 40 | 386.9 | 433.21 |
| 433.80 | |||||
| 434.00 | 9 | 2 | 22.2 | – | 434.01 (4) |
| 434.10 | |||||
| 434.91 (2) | |||||
| 434.01 | 39 | 34 | 87.2 | – | 434.90 |
| 434.91 (3) | |||||
| 433.11 | |||||
| 434.10 | 4 | 1 | 25 | – | 434.11 |
| 435.8 | |||||
| 435.9 | |||||
| 434.11 | 27 | 24 | 88.9 | 415.19 | 433.31 |
| 434.91 (2) | |||||
| 434.90 | 11 | 5 | 45.5 | V61.8 | 434.91 (5) |
| 434.91 | 129 | 116 | 89.9 | 782.0 | 431 |
| 991.6 | 434.11 (7) | ||||
| 434.9 (2) | |||||
| 435.9 | |||||
| 435.3 | 4 | 4 | 100 | – | – |
| 435.8 | 11 | 8 | 72.7 | – | 433.11 |
| 435.9 (2) | |||||
| 435.9 | 60 | 54 | 90 | – | 433.10 |
| 435.8 (2) | |||||
| 437.7 | |||||
| 436 | 8 | 2 | 25 | – | 434.91 (4) |
| 435.9 (2) | |||||
| 437.1 | 4 | 4 | 100 | – | – |
| 437.2 | 1 | 1 | 100 | – | – |
| 437.3 | 3 | 3 | 100 | – | – |
| 437.7 | 5 | 5 | 100 | – | – |
| 437.8 | 1 | 1 | 100 | – | – |
| 437.9 | 1 | 0 | 0 | – | 434.91 |
| 438.89 | 2 | 1 | 50 | – | 345.90 |
| 438.9 | 1 | 0 | 0 | – | 438.89 |
| Total | 397 | 325 | 81.86 |
Regarding diagnosis of acute stroke, concordance was 84.53%, with a selection error rate of 3.02% and a classification error rate of 12.45%. Error distribution was very similar to the case of CVD.
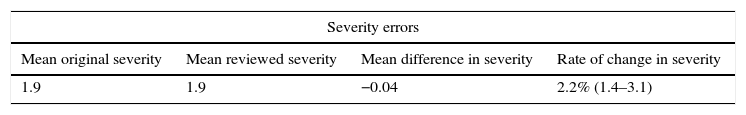
Returning to DRGs, the total error rate due to different DRGs was 16.12%; this had an impact on the mortality risk level, by placing its error rate at 10.58%. However, total error rate had little impact on the error in mean weight and severity (Table 5).
GRD classification for CVD.
| Severity errors | |||
|---|---|---|---|
| Mean original severity | Mean reviewed severity | Mean difference in severity | Rate of change in severity |
| 1.9 | 1.9 | −0.04 | 2.2% (1.4–3.1) |
| Errors in mortality risk | |||
|---|---|---|---|
| Mean original mortality risk | Mean reviewed mortality risk | Mean difference in mortality risk | Rate of change in mortality risk |
| 1.8 | 1.6 | 0.2 | 10.6% (9.7–11.4) |
| Errors in weight | |||
|---|---|---|---|
| Mean original weight | Mean reviewed weight | Mean difference in weight | Rate of change in weight |
| 2.6 | 2.5 | 0.1 | 5.7% |
| Total errors in DRG assignment | |||
|---|---|---|---|
| Total | Erroneous | Total error rate | |
| 397 | 64 | 16.1% (12.5–19.7) | |
Rate of change in severity=(mean original severity−mean reviewed severity/mean original severity)×100.
Rate of change in mortality risk=(mean original mortality risk−mean reviewed mortality risk/mean original mortality risk)×100.
Rate of change in weight=(mean original weight−mean reviewed weight/mean original weight)×100.
Total error rate=(no. of erroneous DRG/total no. of DRG)×100.
The audit includes a sufficient number of CVD cases to assess MBDS quality. However, the fact that raters made assignments without being blinded to the old diagnostic category in the MBDS, limits our ability to draw conclusions and may introduce a bias in the final estimate of interrater concordance.
We observed that selection errors do not represent a significant percentage of the total. In contrast, classification errors are more frequent. They do not impact general morbidity data since they do not have a significant effect on the way it is measured (for example, CVD incidence in 2010). However, classification errors may affect morbidity data for specific clinical entities (for example, coding “unspecified intracranial hemorrhage” instead of “intracerebral hemorrhage”), and we must be mindful of this when using these data.
If the study to be performed requires a higher level of diagnostic accuracy or is aimed at analysing very specific nosological entities (stroke subtypes), we would recommend using a different methodology including a review of every medical record.
Nevertheless, the results obtained suggest that the quality level of MBDS data for CVD diagnosis is sufficient to ensure valid information for epidemiological studies with large populations in which errors of up to 15% are tolerable. We should point out that although data are limited to hospitalised patients, the large majority of patients with these diseases are hospitalised in our setting and have therefore been included in this analysis. Furthermore, we should also mention that this type of study has a far lower cost than do studies with different approaches.
DRG assignment errors should also be considered, since they have a considerably greater effect on the classification by mortality risk level than on mean weight or severity of the cases that are analysed.
These considerations apply to both “CVD” and the “acute stroke” since there is hardly any difference between these entities regarding error rates.
For these reasons, hospital discharge records may serve as a useful statistical tool for performing studies on CVD and stroke.
Conflicts of interestThe author has no conflicts of interest to declare and has received no funding.
Please cite this article as: Hernández Medrano I, Guillán M, Masjuan J, Alonso Cánovas A, Gogorcena MA. Fiabilidad del conjunto mínimo básico de datos en el diagnóstico de la enfermeda cerebrovascular. Neurología. 2017;32:74–80.
This study was presented at the 65th SEN's Annual Meeting.
articles

Neurología (English Edition) follows the Recommendations for the Conduct, Reporting, Editing and Publication of Scholarly Work in Medical Journals