


Demonstrating artery occlusion in ischaemic stroke has gained importance due to the increasing availability of endovascular therapies. This study evaluates the frequency of artery occlusion, its associated factors, and complications following the use of CT-angiography in acute stroke.
MethodsWe retrospectively analysed a cohort of patients who suffered acute ischaemic stroke between July and December 2011.
ResultsWe included 157 patients (mean age, 74±11; mean NIHSS score, 5 [2–13]). Of the total, 56.7% of the patients were admitted to hospital during the first 8hours. CT-angiography was performed in 71 cases (45.2%), arterial large-vessel occlusion was detected in 37 (52.1%) of these cases, and the most frequent site was M1 (40%). Univariate analysis showed that the NIHSS score (17 vs 7, P<.001) and atrial fibrillation (64% vs 32%, P=.006) were associated with artery occlusion. A logistic regression analysis was performed subsequently, confirming these associations. There were no cases of contrast-induced nephropathy. Door-to-needle time for intravenous thrombolysis was 61.2±24.5minutes in patients who underwent CT-angiography, and 53.5±34.3minutes in those who did not (P=.495).
ConclusionsArterial occlusions are seen in 23.6% of patients, especially in those who are admitted during the first few hours. NIHSS score serves as a useful predictive factor.
Con la creciente disponibilidad de las terapias endovasculares, la demostración de oclusión arterial en el ictus isquémico agudo ha cobrado mayor relevancia. Este estudio evalúa la frecuencia de oclusión arterial y los factores asociados a la misma, así como las complicaciones derivadas del uso de angio-TC en el ictus agudo.
MétodosSe analizan retrospectivamente a los pacientes con ictus isquémico entre el 1 de julio y el 31 de diciembre del 2011.
ResultadosCiento cincuenta y siete pacientes (edad media de 74±11 años, NIHSS 5 [2–13]). Un 56,7% llegó al hospital con menos de 8h de evolución. Se realizó angio-TC en 71 casos (45,2%), detectando oclusión de gran vaso en 37 (52,1%). La localización más frecuente fue M1 (40%). En el análisis univariante se halló asociación de la escala NIHSS (17 vs. 7, p<0,001) y la fibrilación auricular (64% vs. 32%, p=0,006) con la presencia de oclusión arterial. Posteriormente, se realizó una regresión logística, confirmando dicha asociación. No se observó ningún caso de nefropatía por contraste. El tiempo puerta-aguja para fibrinólisis intravenosa fue de 61,2±24,5min en los pacientes en que se realizó angio-TC y 53,5±34,3 en los que no se realizó (p=0,495).
ConclusionesLa oclusión de gran vaso se detecta en el 23,6% de la muestra, especialmente en los pacientes traídos en las primeras horas. La escala NIHSS es un buen factor predictor.
Recent years have delivered an important breakthrough in the treatment of acute ischaemic stroke.1 Identifying artery occlusion of extracranial and intracranial vessels has been identified as a prognostic factor for the response to revascularisation therapies.2–4 This finding is also used in selecting patients who are candidates for endovascular treatment with mechanical thrombectomy.5,6
Computed tomography angiography (CT-angiography) is being used increasingly in acute stroke because it is reliable and can be performed quickly.7,8 However, the utility and risks of widespread use of this test remain open to debate in the literature. The frequency of arterial occlusion in acute ischaemic stroke remains unknown in our setting, and this information is relevant for identifying candidates for endovascular treatment.9 Our study's hypothesis is that large artery occlusion is frequently present in acute stroke and that performing CT-angiography is safe. A series of clinical factors could be useful for selecting patients who should undergo CT-angiography, which would optimise the diagnostic process. The aim of our study was to analyse the frequency of large artery occlusion, factors linked to occlusion, and complications derived from using CT-angiography in a consecutive series of patients.
Materials and methodsThe study retrospectively selected all the patients diagnosed with acute ischaemic stroke and admitted to the stroke unit, neurology department, or intensive care unit of our hospital between 1 July and 31 December 2011. We excluded patients with transient ischaemic attack whose symptoms resolved before arriving at the hospital, patients transferred from other hospitals for endovascular treatment, and patients transferred from other hospitals at more than 8hours after onset.
Endovascular treatment began to be offered in our hospital in 2009 and performing CT-angiography is now a common practice in the diagnostic management of acute stroke. The acute ischaemic stroke care protocols implemented in our hospital include performing CT and CT-angiography in all patients with clinical suspicion of arterial occlusion and who may be candidates for endovascular treatment. Both tests are completed before starting intravenous thrombolysis, where this treatment is indicated. We performed a baseline brain CT scan and CT-angiography to assess the supra-aortic trunks and the circle of Willis from the aortic arch to the cranial vertex. The contrast medium used was Optiray Ultraject® 300mg/mL. Images were captured with the bolus tracking technique and guided injection; consequently, the final volume of contrast injected depended on the patient, but volumes did not exceed 100mL. After capturing images, we proceeded to manual post-processing. Large artery occlusion is defined as a contrast-filling defect in any of these arteries: internal carotid artery, middle cerebral artery (M1 and M2 segments), anterior cerebral artery, vertebral artery, basilar artery, and posterior cerebral artery. An additional vascular examination (neurosonology study, magnetic resonance angiography) was performed during the patient's hospital stay, typically in the 24 to 48hours after admission.
Regarding risks and complications, this study evaluated contrast-induced nephropathy, allergic reaction to contrast, and delays in administering intravenous fibrinolysis after CT-angiography. Contrast-induced nephropathy was detected by analysing creatinine levels prior to CT-angiography (baseline creatinine) and 24 to 72hours after the procedure. We compared higher creatinine levels at 24 to 72hours to baseline levels and defined contrast-induced nephropathy as an increase of 0.5mg/dL, or more than 25%, with respect to the baseline creatinine level. This definition is the most widely used in the literature.10 In order to detect the other complications mentioned, we retrospectively reviewed patients’ medical histories.
Data were analysed using SPSS statistical software, version 16.0. Results were expressed as mean±standard deviation and median (interquartile range). We used the chi-square test or t-test for comparisons, according to the type of variable analysed. P values>.05 were considered significant.
ResultsThe study included 157 patients, of whom 76 were men (48.4%). Mean age was 74.3±11 and mean NIHSS baseline score was 5 (range, 2–13). Of the total, 56.7% arrived at the hospital in less than 8hours of stroke onset (170min [90–421]). CT-angiography was performed in 71 cases (45.2%) and 37 patients presented arterial occlusion (52.1% of the CT-angiography cases, 23.6% of the total sample). Arterial occlusion was detected in another 12 patients by means of other diagnostic tests (31.2%). The middle cerebral artery was the most frequent location of occlusion, followed by the basilar artery, tandem internal carotid artery/middle cerebral artery, and other vessels (Fig. 1).

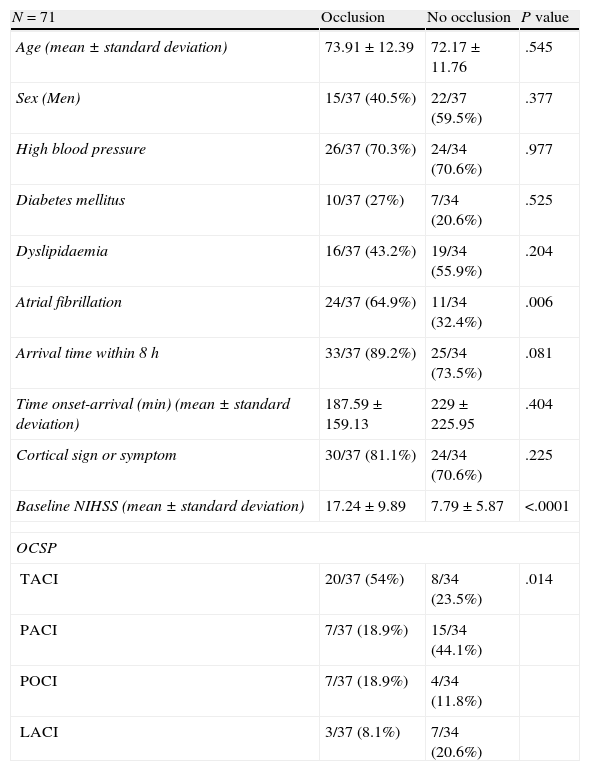
We compared the patient group with CT-angiography findings of arterial occlusion and the patient group without CT-angiography findings of occlusion, to identify factors associated with occlusion. We compared demographic data (age, sex, comorbidities) and clinical data (neurological signs, NIHSS score, progression time). In the univariate analysis (Table 1), 64.9% presented atrial fibrillation vs 32.4% in the group without occlusion (P=.006). A cortical sign or symptom (aphasia, neglect-like symptoms, etc.) was detected in 81.1% of the patients in the occlusion group and in 70.6% of the patients without occlusion (P=.225) Mean baseline NIHSS score was higher in the occlusion group (17.24±9.89 vs 7.79±5.87). The percentage of patients arriving within 8hours of stroke onset was also higher in this group. Most patients in the occlusion group were classified as having TACI, PACI, or POCI according to the Oxfordshire Community Stroke Project. The number of patients diagnosed with LACI was higher in the occlusion group than in the group without occlusion (P=.014).
Comparison of groups with and without arterial occlusion after CT-angiography.
| N=71 | Occlusion | No occlusion | P value |
| Age (mean±standard deviation) | 73.91±12.39 | 72.17±11.76 | .545 |
| Sex (Men) | 15/37 (40.5%) | 22/37 (59.5%) | .377 |
| High blood pressure | 26/37 (70.3%) | 24/34 (70.6%) | .977 |
| Diabetes mellitus | 10/37 (27%) | 7/34 (20.6%) | .525 |
| Dyslipidaemia | 16/37 (43.2%) | 19/34 (55.9%) | .204 |
| Atrial fibrillation | 24/37 (64.9%) | 11/34 (32.4%) | .006 |
| Arrival time within 8 h | 33/37 (89.2%) | 25/34 (73.5%) | .081 |
| Time onset-arrival (min) (mean±standard deviation) | 187.59±159.13 | 229±225.95 | .404 |
| Cortical sign or symptom | 30/37 (81.1%) | 24/34 (70.6%) | .225 |
| Baseline NIHSS (mean±standard deviation) | 17.24±9.89 | 7.79±5.87 | <.0001 |
| OCSP | |||
| TACI | 20/37 (54%) | 8/34 (23.5%) | .014 |
| PACI | 7/37 (18.9%) | 15/34 (44.1%) | |
| POCI | 7/37 (18.9%) | 4/34 (11.8%) | |
| LACI | 3/37 (8.1%) | 7/34 (20.6%) | |
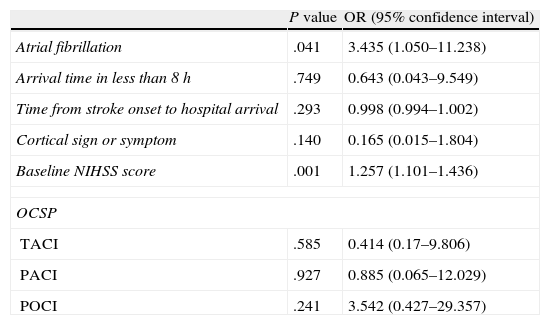
We estimated a logistic regression model using significant variables or those showing tendency towards significance in the univariate analysis (Table 2). Among those variables, atrial fibrillation and baseline NIHSS score showed a statistically significant association with occlusion.
Logistic regression analysis.
| P value | OR (95% confidence interval) | |
| Atrial fibrillation | .041 | 3.435 (1.050–11.238) |
| Arrival time in less than 8h | .749 | 0.643 (0.043–9.549) |
| Time from stroke onset to hospital arrival | .293 | 0.998 (0.994–1.002) |
| Cortical sign or symptom | .140 | 0.165 (0.015–1.804) |
| Baseline NIHSS score | .001 | 1.257 (1.101–1.436) |
| OCSP | ||
| TACI | .585 | 0.414 (0.17–9.806) |
| PACI | .927 | 0.885 (0.065–12.029) |
| POCI | .241 | 3.542 (0.427–29.357) |
We constructed a ROC curve to assess the classification potential of the NIHSS among patients with or without occlusion; the area below the curve was 0.789 (Fig. 2). Fig. 3 displays the diagnostic sensitivity and specificity at every cut-off point on the NIHSS; maximum sensitivity for maximum specificity is obtained with an NIHSS score of 10.


Regarding procedure safety, no contrast-induced nephropathy was detected according to the previously established criterion. We observed one case (1.5%) of allergic reaction to contrast. Mean door-to-needle time for intravenous fibrinolysis was 61.2±24.5minutes in patients who underwent CT-angiography and 53.5±34.3minutes in patients who did not undergo this diagnostic test (P=.495).
DiscussionOur results show that artery occlusion of the large vessels that supply the brain is frequent in cases of acute stroke and is present in more than 20% of all cases. This percentage reaches 56.9% if we consider only those cases examined within 8hours of stroke onset.
When we compare patients with occlusion to those without occlusion, we find 2 factors whose distribution differs between groups: score on the NIHSS and diagnosis of atrial fibrillation. According to the study's results, a cut-off point of 6 for performing a CT-angiography would entail a diagnostic sensitivity of 83% and a specificity of 45% for arterial occlusion. This cut-off point is lower than that proposed in other studies11,12 that locate it between 10 and 12; in our sample, this range would have been associated with a sensitivity of 60% to 75%. The differences observed might be due to the fact that earlier studies analysed patients who underwent arteriography for endovascular treatment. Therefore, the number of patients excluded from a possible diagnosis of occlusion is probably higher than in our study, which is based on the less invasive technique of CT-angiography. Although the discriminatory capability of the NIHSS is high in our study, many patients go undetected based on this method. For example, we can find patients with a high NIHSS score and no occlusion and patients with a relatively low NIHSS score who present occlusion (Fig. 4). For this reason, it would be interesting to detect more factors that may be useful in diagnostic decision-making drawing from angiography findings in acute stroke, as in the case of atrial fibrillation or vascular hyperdensity.13

No cases of contrast-induced nephropathy were found, which is in line with findings from other studies evaluating whether performing CT-angiography after acute stroke is safe.14,15 These studies found a contrast-induced nephropathy rate of 2% to 3% in patients who underwent CT-angiography and perfusion CT. We found one case of allergic reaction with lingual oedema. After undergoing CT-angiography, intravenous fibrinolysis and endovascular treatment, the patient experienced an allergic reaction that resolved with treatment. Another possible risk of CT-angiography is the delay in starting treatment with intravenous tissue plasminogen activator. Our study found a 7-minute difference in average time; this difference is not statistically significant and similar to results from another published study.16
Our study has several limitations. Overall frequency of occlusion might have been underestimated because we did not perform CT-angiography or additional vascular evaluations during the acute phase in the entire sample. A bias may also be present in the selection of patients who underwent CT-angiography. Selection was based on the attending neurologist's clinical suspicion of arterial occlusion and the possibility of applying revascularisation treatment to the patient on an individual basis. However, this fact is not likely to affect the main conclusions of our study, given that a high percentage of patients in the sample underwent CT-angiography. More widespread use of the technique would probably confirm some of our results.
In conclusion, we found large artery occlusion in 23.6% of our study sample, particularly in patients who arrived in the first hours after stroke onset. Further studies are therefore needed to compare the prevalence of arterial occlusion in acute stroke. In this clinical context, CT-angiography shows a low rate of complications and no significant delays in application of the fibrinolytic treatment. NIHSS is a useful predictor of occlusion and we suggest a cut-off point of 6 to provide an appropriate level of sensitivity. Other factors, such as atrial fibrillation, may be associated with occlusion and can be useful in selecting patients for whom CT-angiography might be indicated.
Conflicts of interestThe authors have no conflicts of interest to declare.
Please cite this article as: Matias-Guiu JA, Serna-Candel C, Espejo-Domínguez JM, Fernández-Matarrubia M, Simal P, Matias-Guiu J. Oclusión arterial de gran vaso diagnosticada por angiografía por tomografía computarizada en el ictus isquémico agudo: frecuencia, factores predictores y seguridad. Neurología. 2014;29:261–266.
This study was presented at the 64th annual meeting of the Spanish Society of Neurology (November 2012).
articles

Neurología (English Edition) follows the Recommendations for the Conduct, Reporting, Editing and Publication of Scholarly Work in Medical Journals