


The goals of this study were to compare the early diagnostic utility of Alzheimer disease biomarkers in the CSF with those in brain MRI in conditions found in our clinical practice, and to ascertain the diagnostic accuracy of both techniques used together.
MethodsBetween 2008 and 2009, we included 30 patients with mild cognitive impairment (MCI) who were examined using 1.5Tesla brain MRI and AD biomarker analysis in CSF. MRI studies were evaluated by 2 radiologists according to the Korf's visual scale. CSF biomarkers were analysed using INNOTEST reagents for Aβ1–42, total-tau and phospho-tau181p. We evaluated clinical changes 2 years after inclusion.
ResultsBy 2 years after inclusion, 15 of the original 30 patients (50%) had developed AD (NINCDS-ADRA criteria). The predictive utility of AD biomarkers in CSF (RR 2.7; 95% CI, 1.1–6.7; P<.01) was greater than that of MRI (RR 1.5; 95% CI 95%, 0.7–3.4; P<.2); using both techniques together yielded sensitivity and a negative predictive value of 100%. Normal results on both complementary tests ruled out progression to AD (100%) within 2 years of inclusion.
ConclusionsOur results show that the diagnostic accuracy of biomarkers in CSF is higher than that of biomarkers in MRI. Combined use of both techniques is highly accurate for either early diagnosis or exclusion of AD in patients with MCI.
Nuestros objetivos fueron comparar la capacidad de diagnóstico precoz de los biomarcadores (BMC) de enfermedad de Alzheimer (EA) en LCR y RM cerebral, en condiciones posibles de nuestra práctica clínica y, además, conocer la precisión diagnóstica de la combinación de ambas técnicas.
MétodosEntre 2008 y 2009, estudiamos a 30 pacientes con deterioro cognitivo leve (DCL) mediante RM cerebral de 1.5 teslas y análisis de BMC de EA en el LCR. Las RM fueron valoradas por 2 neurorradiólogos, atendiendo a la escala visual de Korf (2004). Los BMC de EA en LCR se analizaron mediante reactivos INNOTEST para proteínas Aβ1-42, total-tau y fosfo-tau. Se evaluó la evolución clínica (según criterios NINCDS-ADRDA) a los 2 años tras la inclusión.
ResultadosEntre los 30 pacientes iniciales, 15 evolucionaron a EA (criterios NINCDS-ADRDA) a los 2 años de la inclusión. La capacidad predictiva de los BMC en LCR (RR 2,7; IC del 95%, 1.1-6,7; p<0,01) es superior a los de RM (RR 1,5; IC del 95%, 0,7-3,4; p<0,2), y la combinación de ambas técnicas alcanza una sensibilidad y valor predictivo negativo del 100%. La normalidad de ambas pruebas complementarias descartó al 100% el desarrollo de EA, en los 2 años siguientes a la realización de las mismas.
ConclusionesSiguiendo nuestra metodología, la precisión diagnóstica de los BMC en LCR es superior a los de la RM para el diagnóstico precoz de EA. La combinación de ambas técnicas consigue una precisión diagnóstica muy alta, tanto para diagnosticar como para excluir precozmente EA, en pacientes con DCL.
Due to the increasing prevalence of Alzheimer disease (AD), early identification of patients with mild cognitive impairment (MCI) who will develop AD is now one of our most important targets.
Dubois et al.1 and more recently, Sperling et al.2 who introduced the term MCI due to AD, have published criteria aimed at achieving early diagnosis.
The decrease in peptide Aβ1–42 levels and the increase in Tau protein levels in CSF have a high predictive ability in patients with MCI.3 Today, these features are considered to be associated with the pathophysiology of the disease.2 Brain MRI has also demonstrated predictive ability for AD in patients with MCI.4,5 However, there is controversy regarding which of these biomarkers has a greater diagnostic accuracy. Some authors consider that biomarkers in CSF6–10 have a greater predictive ability, while others support the biomarkers in MRI.11,12
The lack of an optimal biomarker has led different authors to draw from the results of both complementary tests to multiply the predictive ability of each individual test.6–13
Our objectives are (1) to compare the early diagnostic abilities of AD biomarkers in CSF and brain MRI, and (2) to determine the diagnostic accuracy of the combination of both techniques in normal clinical practice conditions.
Materials and methodsStudy designLongitudinal study.
Subjects of the studyBetween 2008 and 2009, we included 30 patients with amnestic MCI diagnosed according to Petersen criteria of 2006.14 All patients come from the cognitive impairment unit at Hospital General Universitario in Alicante, and some of them had been monitored for several years. Tests included physical and neurological examination, neuropsychological examination, the 15-item geriatric depression scale by Yesavage, blood test, brain MRI scan, and lumbar puncture (LP). These patients attend the outpatient service for check-ups every 6 months. During check-up visits, progression to AD is assessed according to NINCDS-ADRDA criteria15 and results on the GDS scale. Based on status at 2 years after LP, we classified patients as stable (MCI) or progression to AD (AD).
Inclusion criteriaPatients with amnestic MCI, older than 55 years, Folstein MMSE score of 20 to 27 and score of less than 78 on the informant questionnaire. Participants signed an informed consent form to be included in the study and to undergo LP.
Exclusion criteriaPresence of dementia or any other neurological, psychiatric or systemic condition that could lead to cognitive impairment. Anticoagulant treatment and absence of informed consent were also exclusion criteria. Likewise, patients scoring more than 5 on the Yesavage geriatric depression scale were excluded.
ProceduresThe lead neurologist diagnosed pure amnestic or multidomain MCI according to Petersen criteria.14 This step was followed by a neuropsychological study which included an assessment of memory, language, executive functions, attention, and visuoconstructive ability using the Mini Mental State Examination (MMSE), Rey auditory verbal test, Trail Making Test (TMT), and the Informant Questionnaire on Cognitive Decline in the Elderly (IQCODE). Altered functions were defined as a Z score of −1.5 or less, meaning at least 1.5 standard deviations below the control subject mean, on at least one of the tests used to analyse that function. Progression from MCI to AD was determined based on fulfilment of NINCDS-ADRDA criteria (significant interference with the subject's activities), as well as a decrease on the MMSE and/or an increase of more than 7 points on the IQCODE.
All patients underwent a brain MRI scan to rule out other cerebral lesions responsible for clinical symptoms and also to assess medial temporal atrophy (MTA).
Extraction and analysis of cerebrospinal fluidLumbar punctures were performed between February 2008 and February 2009. Samples were obtained between 10.00 and 14.00. The lead neurologist performed the LP with a 20×3½″ spinal needle. CSF was collected in polypropylene tubes and frozen within 1hour at −80°C. Fluid was centrifuged before taking the aliquot to be frozen. Prior to preparing the samples for freezing, we collected the fluid in a tube to run clinical biochemistry tests and perform a cell count. In no cases did the cell count show more than 100 red blood cells.
Measurement of Aß1–42, T-tau, and P-tau181p levels in cerebrospinal fluidBiomarkers of AD in CSF were analysed using INNOTEST reagents for Aβ1–42, T-tau and P-tau181p. Reagents are manufactured by Innogenetics (Ghent, Belgium). We also obtained T-tau/Aβ1–42 and P-tau181p/Aβ1–42 coefficients. These coefficients are frequently used by multiple authors because they seem to show the link between amyloid and Tau pathways of the disease.16
All samples were analysed simultaneously at the end of the recruitment process; researchers were blinded to clinical data.
Analysis of magnetic resonance imaging scansBrain MRI scans were performed with a 1.5 Tesla MR unit (General Electric) and included a coronal slice in T1-weighted sequences. Two experienced radiologists visually quantified MTA according to the method described by Korf et al.17 Radiologists were blinded to clinical data. We analysed the correlation between results delivered by each radiologist; intraclass correlation coefficients were 0.80 and 0.85. We selected the results from the radiologist whose assessment correlated the closest with clinical symptoms for comparison to CSF results.
Statistical analysisAbnormal levels of Aβ1–42 were defined as less than 500pg/mL and the remaining variables were considered abnormal for T-tau values exceeding 450pg/mL, P-tau181p in excess of 60pg/mL, T-tau/Aβ1–42 coefficient above 0.17, and P-tau181p/Aβ1–42 above 0.05. Overall results were considered abnormal when 3 of the variables were abnormal.
Brain MRI was considered abnormal when the sum of right and left MTA was 3 or more.
We used the Kolmogorov–Smirnov test to analyse distribution type for each variable, and Mann–Whitney to compare the 2 groups.
Association was studied with the chi-square test or Fisher's exact test where necessary. We calculated relative risk (RR) with a confidence interval (CI) of 95% to quantify the magnitude of the association. To analyse predictive ability, we calculated sensitivity, specificity, positive predictive value, and negative predictive value (NPV). Statistical significance was established at P<.05 and statistical testing was completed using SPSS version 19.0.
Ethical considerationsPharmaceutical laboratories that have funded the project did not intervene in the design, gathering, or interpretation of any data, or in the drafting of this article.
All patients gave their informed consent to undergo LP.
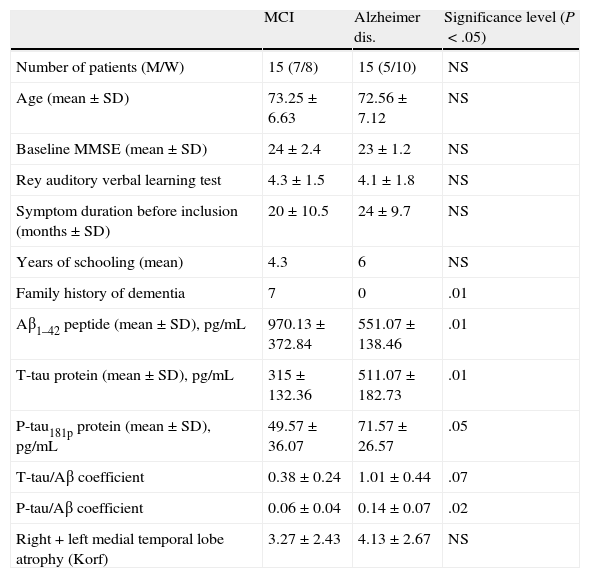
ResultsClinical and demographic variables and results for each of the CSF and MRI variables are reflected in Table 1. We found significant differences for family history of dementia, which is clearly more frequent in the MCI group. There were also significant differences for all variables measured in the CSF analysis.
Clinical and demographical variables and CSF and brain MRI variables for included patients.
| MCI | Alzheimer dis. | Significance level (P<.05) | |
| Number of patients (M/W) | 15 (7/8) | 15 (5/10) | NS |
| Age (mean±SD) | 73.25±6.63 | 72.56±7.12 | NS |
| Baseline MMSE (mean±SD) | 24±2.4 | 23±1.2 | NS |
| Rey auditory verbal learning test | 4.3±1.5 | 4.1±1.8 | NS |
| Symptom duration before inclusion (months±SD) | 20±10.5 | 24±9.7 | NS |
| Years of schooling (mean) | 4.3 | 6 | NS |
| Family history of dementia | 7 | 0 | .01 |
| Aβ1–42 peptide (mean±SD), pg/mL | 970.13±372.84 | 551.07±138.46 | .01 |
| T-tau protein (mean±SD), pg/mL | 315±132.36 | 511.07±182.73 | .01 |
| P-tau181p protein (mean±SD), pg/mL | 49.57±36.07 | 71.57±26.57 | .05 |
| T-tau/Aβ coefficient | 0.38±0.24 | 1.01±0.44 | .07 |
| P-tau/Aβ coefficient | 0.06±0.04 | 0.14±0.07 | .02 |
| Right+left medial temporal lobe atrophy (Korf) | 3.27±2.43 | 4.13±2.67 | NS |
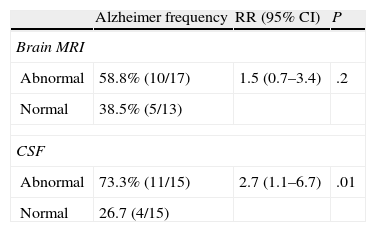
Table 2 shows that the RR (95% CI) of developing AD given abnormal MRI results was 1.5 (0.7–3.4), but this level is not statistically significant. However, the RR (95% CI) of developing AD when given abnormal results for biomarkers in CSF was 2.7 (1.1–6.7), with a statistical significance level of 0.01.
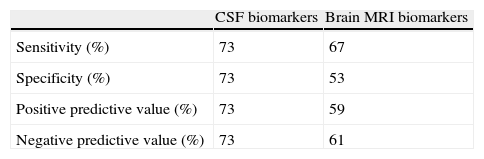
Predictive ability of AD biomarkers in CSF is always higher than that of biomarkers in brain MRI scans, as shown in Tables 3 and 4.
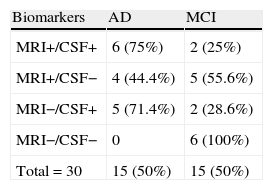
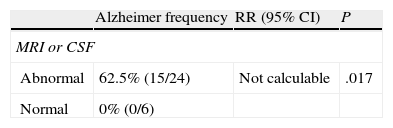
Results for AD biomarkers in CSF and brain MRI scans were combined. It is striking that none of the patients in whom both sets of results were normal developed AD in the 2 years after being included in the study. The RR of developing AD given abnormal biomarkers in the CSF analysis or the brain MRI is clearly statistically significant at 0.01 (Table 5).
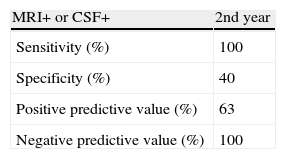
Table 6 shows the predictive ability of combining both biomarkers, the method with the highest sensitivity and NPV (100%).
DiscussionAccording to the evaluation scales used in this study, our results show that for early diagnosis of AD, the predictive ability of biomarkers in CSF is higher than that of brain MRI biomarkers. Our results coincide with those of most authors who make this comparison.6–10 However, there is no consensus on which variables should be used to obtain the best results. While some authors believe that absolute values of Aβ1–42 and T-tau 6–8 are the best variables, others opt for the P-tau 181p/Aβ1–429 or T-tau/Aβ1–4210 coefficients. We believe that requiring 3 abnormal CSF variables in order for the test to be considered abnormal is sufficiently strict. These findings also reflect the simultaneous involvement of amyloid and Tau pathways.16
These results coincide with the recent hypothetical model of biomarker behaviour in AD.18 According to this model, the earliest findings are altered levels of Aβ1–42 and they reach their maximum concentration during the preclinical phase. Subsequently, but also during the preclinical phase, Tau protein levels also become abnormal. It is only at the end of that phase that abnormal structural MRI findings can be observed.
Some authors believe that biomarkers in brain MRI scans are better predictors than biomarkers in CSF. However, their studies employ MRI volumetric analysis techniques for MRI analysis that are currently beyond our reach.11,12
Based on our results, we can conclude that the predictive ability of either technique used alone is not high enough to be considered satisfactory. However, in our opinion, the pathophysiological data from CSF analysis in MCI patients is what provides the best available information regarding early diagnosis of AD.
Most authors state that combined analysis of both types of biomarkers yields better diagnostic accuracy than using either of the tests alone.6–13 In our experience, sensitivity and NPV reach maximum values with combined analysis. Relative risk of developing AD when either of the 2 biomarkers was abnormal could not be calculated due to lack of stable patients presenting abnormal results on one of the tests. Nevertheless, the data are clearly statistically significant, and we therefore add our experience to that of the authors cited previously. Our data are the first to be published in Spanish literature.
Our results seem to show a remarkably high rate of conversion to AD in the 2 years after patients were included. However, we should point out that if the mean duration of symptoms prior to the study is added to the duration of the study period itself, our results are comparable with those described the literature (10%–15% yearly conversion rate).
Our study's limitations include the lack of confirmation with anatomical pathology techniques and absence of MRI volumetric analysis. One advantage, however, is our suggestion that doctors use a method including technical means that are now accessible for most cognitive impairment units in our country.
FundingThis study was partially funded by Novartis España and Grunenthal España.
Conflicts of interestThe authors declare having no conflict of interest.
We would like to thank Novartis España and Grunenthal España for covering the cost of the reagents. We would also like to thank María de los Angeles Miguelsanz (Immunology Laboratory at H.G.U.A.) for her excellent handling of samples.
Please cite this article as: Monge Argilés JA, Blanco Cantó MA, Leiva Salinas C, Flors L, Muñoz Ruiz C, Sánchez Payá J, et al. Comparación de la capacidad diagnóstica precoz de los biomarcadores de la enfermedad de Alzheimer en resonancia magnética cerebral y líquido cefalorraquídeo. Neurología. 2014;29:397–401.
This study was featured as an oral presentation at the 64th Annual Meeting of the SEN.
articles

Neurología (English Edition) follows the Recommendations for the Conduct, Reporting, Editing and Publication of Scholarly Work in Medical Journals