


Migraine is a chronic highly disabling disease that manifests itself with recurrent episodes of headache. The objective of the study was to ascertain the cost-of-illness (COI) of migraine from the perspective of Society in Spain and to characterize its excess cost.
MethodsThe nationwide year-2020 European-Health-Survey-in-Spain was used; 1442 persons with migraine (77.3% women, 52.5 years) and 4288 without migraine (76.7% women, 52.8 years) were abstracted by propensity score optimal matching. COI accounted healthcare resources utilization (HRU) and non-HRU (productivity loss). Costs were expressed as Per-Patient-Per-Year (PPPY) in Euros year 2020, and the excess cost was computed as the difference between persons with and without migraine.
ResultsThe PPPY cost was more than double in persons with migraine; euro5862 vs euro2981; excess cost of euro2881euro (95% CI: 2410-3353, P < 0.001), mainly attributable to labour productivity loss; euro1928 (1532-2325, P < 0.001) annually (66.9% of total excess cost). This excess labour cost is explained by the greater number of additional days of absenteeism, 22.35 (16.12; 28.57), and presenteeism, 31.39 (27.36; 35.41) in persons with migraine, P < 0.001 in both cases. National Health System (NHS)-funded healthcare PPPY cost represented the 29.0% of total excess cost; euro836 (618-1055), this because higher utilization of all-type medical visits.
ConclusionIn Spain, persons with migraine showed a meaningful excess cost compared with persons without migraine, particularly due to labour cost component, although the economic cost to the NHS was also considerable. Given the high prevalence of migraine, its overall attributable economic impact for Spain might range between 10 394 and 14 cost 230 million Euros in year 2020.
La migraña es una enfermedad incapacitante que se manifiesta con episodios recurrentes de cefalea. El objetivo del estudio fue determinar el coste de la migraña desde la perspectiva de la sociedad en España, y caracterizar el exceso de coste debido a la misma.
MétodosSe utilizó la Encuesta Europea de Salud en España 2020, obteniéndose 1.442 personas con migraña (77,3% mujeres, 52,5 años) y, mediante emparejamiento óptimo con índice de propensión, 4.288 controles sin migraña (76,7% mujeres, 52,8 años). Se contabilizó utilización de recursos sanitarios y pérdidas de productividad laboral. Los costes se expresaron como coste-anual-por-persona, computándose como exceso el coste diferencial entre personas con y sin migraña.
ResultadosEl coste-anual-por-persona con migraña duplicó al observado en personas sin migraña; 5.862euro vs. 2.981euro, con un exceso de 2.881euro (IC95%: 2.410–3.353, p < 0,001). El exceso de coste está principalmente representado por el exceso de coste laboral: 1.928euro (1.532–2.325, p < 0,001) por persona con migraña/año (66,9% del exceso de coste total), que se explica por un numero adicional de días/año de absentismo (22,35 [16,12–28,57], p < 0,001) y presentismo (31,39 [27,36–35,41], p < 0,001) en personas con migraña comparado con controles. Un 29,0% del exceso de coste (836euro/persona con migraña/año [618−1.055], p < 0,001) está representado por costes directos por uso de recursos sanitarios financiados por el Sistema Nacional de Salud (SNS). El impacto económico atribuible a la migraña como resultado de proyectar el exceso de coste a su prevalencia en España, podría oscilar entre los 10.394 y 14.230 millones de euros en el año 2020.
ConclusiónEn España, las personas con migraña muestran un exceso de coste considerable, particularmente en el coste laboral, en comparación con las personas sin migraña, aunque el coste para el SNS no es desdeñable.
Migraine is a chronic neurological disease that presents with recurrent episodes of headache.1,2 According to the World Health Organization, it is 2-3 times more frequent in women than in men, with prevalence rates of up to 11.6%.3 In Europe, prevalence ranges from 10% to 16%,3 with rates of 12%-12.6% in Spain (17.2% in women and 8.0% in men).4,5 Given its high prevalence, migraine has a considerable impact from both an economic and a healthcare perspective; it represents the second leading neurological cause of disability worldwide,6–9 and current treatments are not able to meet the needs of this healthcare problem. From an economic perspective, approximately three-quarters of the total cost associated with migraine is made up of indirect costs due to loss of productivity; direct healthcare expenditure accounts for up to one-third of the total.10–12 Previous studies have estimated this economic impact in Spain at approximately euro 2 billion per year, accounting exclusively for the loss of over 20 million workdays per year13; in 2004, the cost of migraine was estimated at over euro 1.076 billion per year (68% indirect and 32% direct costs).14 More recently, the Spanish Migraine Atlas15 reported that indirect costs amount to 50%-62% of the total, whereas healthcare costs funded by the National Health System (SNS, for its Spanish initials) amounted to 15%-23%; these results are consistent with those reported for Spain in European studies, which found indirect costs to be 3 times greater than direct costs.16,17
Spanish studies published to date on the cost of migraine, few of which are recent, are based on convenience sampling and their national representativeness is uncertain; no study has analysed differences in costs between people with and without migraine, which would enable estimation of the costs attributable to migraine. The main objective of this study was to calculate the societal cost of migraine (including all costs attributable to migraine, regardless of the setting: workplace, healthcare system, etc) in patients aged 15 years or older in Spain in 2020, determining the excess cost in individuals with and without migraine, both overall and as a function of age and sex.
Material and methodsStudy design and populationWe conducted a cost-of-illness study, estimating different components using representative national data sources for the year 2020.18 We employed a cross-sectional study design, using anonymised, disaggregated data (bottom-up approach) from individuals representative of the entire territory of Spain and included in the 2020 European Health Survey in Spain (EHSS), who consented to participate in that study.19 We also used the Primary Care Clinical Database (BDCAP, for its Spanish initials) of the Spanish Ministry of Health and Consumer Affairs to estimate the use of migraine drugs within the SNS (the EHSS does not include this data).20 Additional information is presented in the Supplementary Material.
Study populationThe target population is the set of individuals aged 15 years or older with habitual residence in Spain. The geographical setting was the entire national territory of Spain. The 2020 EHSS includes data from 22 072 interviews; fieldwork was conducted in 2019 and followed a computer-assisted personal interview (CAPI) methodology. The BDCAP data used to estimate migraine drug use were from 2018, the most recent available year in this database, which includes a total of 4 864 058 patients. From the EHSS, we selected registers with affirmative responses to both the question “have you had migraine in the last 12 months?” and the question “has a doctor told you that you have migraine?”; a total of 1442 people with migraine were identified. The remaining participants were considered not to have migraine, and were used as the subsample for extraction of the control group, according to a procedure of optimal propensity score matching.21 Propensity score was calculated with the following variables: age, sex, accidents in the last 12 months (any type: domestic, traffic, work-related), and autonomous region of residence. For each person with migraine, propensity score matching was used to select controls without migraine with a 0.0001 calliper in the base case, identifying a total of 4288 controls without migraine.
Use of healthcare resources and indirect costsFirstly, we calculated the use of direct (funded by the SNS or by the patient) and indirect healthcare resources (loss of productivity) based on annual projections of the EHSS register. The following healthcare resources were considered: medical consultations (primary care or specialist), consultations with other healthcare professionals (psychiatrists, nurses), physiotherapy, complementary and diagnostic tests, emergency department visits without hospital admission, hospital admissions (including number of days of hospitalisation), consultation with alternative medicine practitioners for complementary treatment (homeopathy, acupuncture, naturopathy, osteopathy, psychotherapy, etc), and migraine medication. The indirect costs included in the analysis were: lost productivity in patients in active employment as a result of work absences, days of presenteeism (reduction of at least 50% productivity) in the last 12 months, early retirement (before 62 years of age), and unemployment (see Supplementary Material).
Cost of illnessThe cost of illness was calculated per person and per year, based on the unit prices or salaries corresponding to different units of resource use, multiplying their monetary value in 2020 euros by the number of resources consumed per year. For healthcare resources, we used the prices published by the regional health departments of each autonomous region (or by the National Institute of Healthcare Management [INGESA] in the case of the autonomous cities of Ceuta and Melilla). We used mean prices weighted according to the population size of each autonomous region (and Ceuta and Melilla), updated for the year 2020 (Supplementary Material, Tables S1-S5). The cost of migraine medication was calculated using the published reference prices (Supplementary Material, Table S4). The daily cost of migraine medication (ergot derivatives, triptans, non-steroidal analgesic drugs [NSAID], and prophylactic drugs) per patient was estimated according to the BDCAP database, using the cost per day of treatment according to the defined daily dose (DDD) of the drugs used.20 The cost of medications funded by the patient was estimated according to the estimated percentage of self-medication (the difference between the percentage who took medications and the percentage that stated that their medications were prescribed by a physician). The annual healthcare costs of each component assumed by the patient were computed by multiplying the rate or unit price by the projected frequency of use, with the total healthcare costs calculated as the sum of the partial costs of each component (see additional details in the Supplementary Material).
Indirect costs were calculated according to a human capital approach, applied to the days of lost productivity in 12 months as a consequence of health problems or temporary inability to work; thus, they were calculated based on the lost indirect resources mentioned above: days of workplace absence or presenteeism, early retirement, and unemployment.22,23 To evaluate the cost of workplace absences among individuals in active employment, and assuming the logic of opportunity costs, we estimated lost productivity as a consequence of the individual’s inactivity.22,23 The value of this loss was estimated based on the salary that the patient/person would not receive as a result of their temporary disability/sick leave/reduced productivity in their normal work.24 For this study, we used the salary structure survey for the year 2019, conducted by the National Statistics Institute (the methods followed and calculations made are summarised in the Supplementary Material, Table S2).
Having calculated the annual cost per patient with migraine and per individual without migraine, we calculated the excess cost (the difference between the 2 values), for all components: healthcare costs funded by the SNS and by the patient, loss of work productivity, and total. Based on these costs, we estimated the annual cost of migraine in Spain in the year 2020, both for prevalent migraine, based on prevalence data published in the scientific literature,4,5 and for diagnosed cases as considered in the EHSS,19 as approximately 40% of cases of migraine are thought to be undiagnosed.25,26 To that end, we multiplied the published prevalent and diagnosed cases (total nationwide rates and divided by age and sex) by the total annual excess cost calculated as described above (Supplementary Material, Table S7). In addition to the calculation of excess cost in the base case, we also calculated excess cost controlling for the effect of the number of comorbidities observed in the 2020 EHSS in people with and without migraine, producing an estimation of the excess cost attributable exclusively to migraine and that attributable to excess comorbidity expected in patients with migraine.
Statistical analysisThe statistical analysis included a preliminary descriptive univariate analysis of sociodemographic variables; we tested for normal distribution with the Kolmogorov-Smirnov test, for equality of variances with the Levene test, and for heteroskedasticity of variances with the White test. Statistical analysis was conducted with the SPSS statistics package, version 26.0 (IBM; New York, USA; https://www.ibm.com/analytics/spss-statistics-software). The statistical significance of the excess cost attributable to migraine was analysed using a general linear univariate model with covariates not included in the propensity score; comparisons between age and sex subgroups were made using a generalised linear model with covariates. Covariates were level of schooling, physical activity, and daily alcohol consumption; these were not included in the propensity score used to extract controls without migraine. The Bonferroni correction for multiple comparisons was applied. Robust standard errors were used to estimate 95% confidence intervals (CI) for the differences between groups. We also repeated this analysis with inclusion of the number of comorbidities as a covariate to estimate the excess cost attributable exclusively to migraine, separating this from the cost due to excess comorbidity observed in patients with migraine. The association between some of the comorbidities identified in patients with migraine and controls in the 2020 EHSS was studied by analysing categorical variables in 2 × 2 contingency tables, using the Cochran-Mantel-Haenszel test or the chi-square linear trend test for variables with more than 2 possible responses. Strength of association, controlling for covariates with a potential confounding effect, was estimated with a conditional logistic regression model, calculating odds ratios (OR) with 95% CI. When statistically significant differences were identified, we calculated the effect size using the Cohen d statistic.27 Effect size was interpreted as follows: 0.20-0.50: small effect size; 0.50-0.80: moderate effect size; > 0.80: large effect size.27,28
Sensitivity and subgroup analysesThe analysis of study variables was repeated for age and sex subgroups.22,23 To control for uncertainty of results, we conducted a sensitivity analysis of the annual excess cost per patient (total and for each cost component and subcomponent). This analysis was conducted by repeating the base case analysis in 4 alternative scenarios: (1) using the complete sample of people interviewed in the 2020 EHSS, without using propensity score matching to select controls; (2) using a control group selected with optimal propensity score matching with a 0.001 calliper (n = 7015 controls); (3) as in scenario 2 but with a 0.00001 calliper (n = 2553); and (4) 1:1 matching using the propensity score of the patient group.
ResultsA total of 1442 patients with migraine and 4288 controls (2.97 controls per patient) were analysed; 76.8% were women, with an overall mean age of 52.65 years (standard deviation [SD]: 18.11). Table 1 presents the main sociodemographic variables after optimal propensity index matching (variables prior to matching are shown in the Supplementary Material, Table S8). Patients with migraine had 2.49 (95% CI, 2.30–2.69) times more comorbidities than controls (4.75 vs 2.26; P < .001). Specifically, patients showed significantly higher rates of depression (11.3%) and chronic anxiety (25.5%) than controls (2.9% and 7.9%, respectively), with an OR of 4.33 (3.40–5.53; P < .001) for depression and 4.08 (3.46–4.80; P < .001) for anxiety. Furthermore, patients with migraine showed considerably higher rates of other comorbidities (OR ≥ 2.5), such as arthrosis, chronic back pain, stomach ulcers, and kidney and liver disease (Supplementary Material, Tables S9 and S10).
Sociodemographic characteristics of the patient group and the control group selected with optimal propensity score matching.
| Migraine | P | Total | ||
|---|---|---|---|---|
| No (n = 4288) | Yes (n = 1442) | |||
| Age (years) | 52.83 (18.11) | 52.50 (17.91) | .544 | 52.65 (18.11) |
| Age group (years) | ||||
| 15−24 | 6.2% | 6.0% | .996 | 6.1% |
| 25−34 | 9.4% | 9.6% | 9.5% | |
| 35−44 | 19.0% | 19.5% | 19.1% | |
| 45−54 | 20.3% | 20.7% | 20.4% | |
| 55−64 | 19.1% | 18.9% | 19.1% | |
| 65−74 | 12.5% | 12.2% | 12.4% | |
| 75+ | 13.5% | 13.0% | 13.4% | |
| Sex | ||||
| Women | 76.7% | 77.3% | .668 | 76.8% |
| Accidents | ||||
| Yes | 9.5% | 10.9% | .137 | 9.8% |
| Autonomous community | ||||
| Andalusia | 8.9% | 9.2% | .998 | 9.0% |
| Aragon | 3.0% | 3.1% | 3.0% | |
| Asturias | 4.8% | 5.3% | 4.9% | |
| Balearic Islands | 3.2% | 2.6% | 3.1% | |
| Canary Islands | 4.6% | 4.6% | 4.6% | |
| Cantabria | 2.5% | 2.5% | 2.5% | |
| Castile-Leon | 6.4% | 6.7% | 6.5% | |
| Castile-La Mancha | 5.4% | 5.4% | 5.4% | |
| Catalonia | 10.2% | 10.1% | 10.2% | |
| Valencian Community | 9.8% | 9.0% | 9.6% | |
| Extremadura | 3.9% | 3.7% | 3.8% | |
| Galicia | 8.6% | 8.5% | 8.6% | |
| Madrid | 9.0% | 10.0% | 9.2% | |
| Murcia | 7.0% | 6.9% | 7.0% | |
| Navarre | 3.1% | 3.0% | 3.1% | |
| Basque Country | 6.0% | 5.7% | 6.0% | |
| La Rioja | 2.7% | 2.8% | 2.7% | |
| Ceuta | 0.5% | 0.7% | 0.5% | |
| Melilla | 0.3% | 0.3% | 0.3% | |
| Sociodemographic variables not considered in propensity score matching | ||||
| Employment status | ||||
| Working | 47.5% | 42.9% | < .001 | 46.4% |
| Unemployed | 7.4% | 11.9% | 8.5% | |
| Retired/early retirement | 23.6% | 22.4% | 23.3% | |
| Student | 5.9% | 4.6% | 5.6% | |
| Unable to work | 2.4% | 4.5% | 3.0% | |
| Homemaker | 12.9% | 13.2% | 13.0% | |
| Other | 0.2% | 0.5% | 0.3% | |
| Marital status | ||||
| Single | 26.9% | 24.5% | .105 | 26.3% |
| Married | 50.6% | 53.1% | 51.3% | |
| Widowed | 13.2% | 13.0% | 13.2% | |
| Separated | 3.0% | 2.1% | 2.8% | |
| Divorced | 6.3% | 7.2% | 6.6% | |
| Education level | ||||
| Unable to read or write | 0.7% | 1.3% | < .001 | 0.9% |
| Primary (incomplete) | 8.5% | 10.7% | 9.0% | |
| Primary (complete) | 16.7% | 16.0% | 16.5% | |
| Secondary | 21.2% | 25.2% | 22.2% | |
| High school diploma | 13.5% | 12.4% | 13.2% | |
| Basic vocational training | 6.6% | 8.8% | 7.1% | |
| Further vocational training | 8.7% | 9.4% | 8.8% | |
| University studies | 24.2% | 16.1% | 22.1% | |
| Physical exercise | ||||
| None | 34.2% | 42.8% | < .001 | 36.4% |
| Occasional physical exercise | 39.9% | 36.9% | 39.1% | |
| Several times per month | 9.6% | 8.4% | 9.3% | |
| Several times per week | 16.3% | 11.9% | 15.2% | |
| Alcohol consumption (days/month) | ||||
| Every day or nearly every day | 11.6% | 8.6% | < .001 | 10.8% |
| 5−6 days per week | 1.1% | 1.1% | 1.1% | |
| 3−4 days per week | 6.0% | 4.2% | 5.5% | |
| 1−2 days per week | 15.4% | 12.2% | 14.6% | |
| 2−3 days per month | 9.9% | 8.6% | 9.6% | |
| Once per month | 8.1% | 7.9% | 8.0% | |
| Less than once per month | 12.4% | 14.1% | 12.9% | |
| None in the last 12 months | 11.7% | 16.8% | 13.0% | |
| Never | 23.8% | 26.5% | 24.5% | |
| Smoking (daily) | ||||
| Yes | 19.4% | 20.2% | .715 | 19.9% |
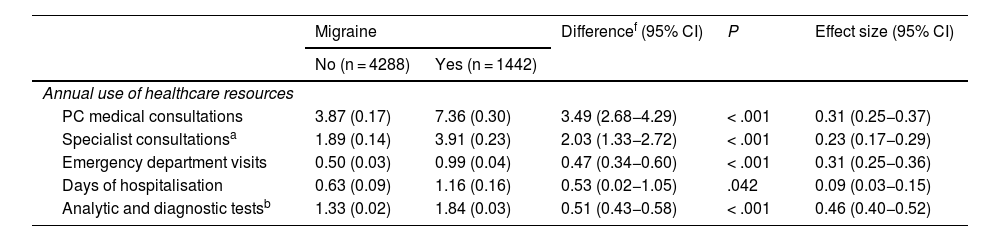
Patients with migraine showed higher rates of healthcare resource use, with the most common being primary care consultations (92.9% in patients with migraine vs 82.6% in controls; P < .001); the adjusted mean number of excess annual visits was 3.49 (95% CI, 2.68−4.29; P < .001; Table 2). Compared to controls, patients with migraine more frequently consulted specialist physicians and visited the emergency department (73.0% vs 54.4% and 54.4% vs 25.3%, respectively; P < .001 in both cases), were more frequently admitted to hospital, and underwent more diagnostic tests (Table 2 and Supplementary Material, Table S11). Patients presented significantly greater loss of productivity, with a higher percentage reporting at least one day of absence (41.2% vs 23.1%; P < .001) and a higher annual excess of absence (22.35 days; 95% CI, 16.12−28.57; P < .001; Table 2). Patients also presented significantly higher rates of presenteeism, with a greater mean annual excess number of days than controls (31.39; 95% CI, 27.36−35.41; P < .001; Table 2). The annual unemployment rate was 8.1% higher in patients with migraine than among controls (OR = 1.70; 95% CI, 1.40−2.08; P < .001; Table 2).
Annual use of healthcare resources and loss of work productivity in patients with migraine and controls without migraine.
| Migraine | Differencef (95% CI) | P | Effect size (95% CI) | ||
|---|---|---|---|---|---|
| No (n = 4288) | Yes (n = 1442) | ||||
| Annual use of healthcare resources | |||||
| PC medical consultations | 3.87 (0.17) | 7.36 (0.30) | 3.49 (2.68−4.29) | < .001 | 0.31 (0.25−0.37) |
| Specialist consultationsa | 1.89 (0.14) | 3.91 (0.23) | 2.03 (1.33−2.72) | < .001 | 0.23 (0.17−0.29) |
| Emergency department visits | 0.50 (0.03) | 0.99 (0.04) | 0.47 (0.34−0.60) | < .001 | 0.31 (0.25−0.36) |
| Days of hospitalisation | 0.63 (0.09) | 1.16 (0.16) | 0.53 (0.02−1.05) | .042 | 0.09 (0.03−0.15) |
| Analytic and diagnostic testsb | 1.33 (0.02) | 1.84 (0.03) | 0.51 (0.43−0.58) | < .001 | 0.46 (0.40−0.52) |
| % (95% CI) using the resource | Difference (%) | P | Odds ratiof (95% CI) | ||
|---|---|---|---|---|---|
| Physiotherapy | 20.0 (18.8−21.2) | 29.8 (27.4−32.1) | 9.8 | < .001 | 2.02 (1.75−2.33) |
| Psychiatry | 4.5 (3.9−5.1) | 13.0 (11.2−14.7) | 8.5 | < .001 | 3.29 (2.66−4.07) |
| Nursing consultations | 18.3 (17.2−19.5) | 26.1 (23.8−28.3) | 7.8 | < .001 | 1.55 (1.35−1.79) |
| Psychotherapy | 3.7 (2.9−4.5) | 10.2 (7.8−12.6) | 6.5 | < .001 | 3.20 (2.58−3.97) |
| Homeopathy | 0.6 (0.3−0.9) | 1.1 (0.3−2.0) | 0.5 | .458 | 1.28 (0.67−2.45) |
| Acupuncture | 1.1 (0.6−1.5) | 3.1 (1.7−4.4) | 2.0 | < .001 | 3.47 (2.13−5.65) |
| Naturopathy | 1.1 (0.7−1.6) | 1.8 (0.7−2.8) | 0.7 | .215 | 1.43 (0.81−2.50) |
| Loss of work productivityc | |||||
|---|---|---|---|---|---|
| Differencef (95% CI) | P | Effect size (95% CI) | |||
| Days of work absence | 10.32 (1.05) | 32.66 (1.90) | 22.35 (16.12−28.57) | < .001 | 0.32 (0.26−0.38) |
| Days of presenteeismd | 21.27 (0.80) | 52.66 (1.45) | 31.39 (27.36−35.41) | < .001 | 0.60 (0.54−0.66) |
| % (95% CI) using the resource | Difference (%) | P | Odds ratiof (95% CI) | ||
| Unemployment rate (%) | 13.5 (12.1−14.8) | 21.6 (18.8−24.5) | 8.1 | < .001 | 1.70 (1.40−2.08) |
| Early retiremente | 2.3 (1.8−2.7) | 3.3 (2.4−4.3) | 1.0 | .042 | 1.44 (1.01−2.05) |
Data are expressed as the mean (standard error) number of times per year that the resource is used, or as the percentage of patients using the resource, with 95% CI.
PC: primary care; CI: confidence interval.
The annual cost per person was significantly higher among patients than controls (euro 5862 vs euro 2981), with an annual excess cost of euro 2881 (95% CI, euro 2410-euro 3353; P < .001; Table 3); euro 2176 (75.5%) of the total is attributed to migraine and the remaining euro 705 (24.5%) to excess comorbidity. The main component of the excess cost corresponded to work-related costs (euro 1928; 95% CI, euro 1532-euro 2325; P < .001; Table 3), which accounted for 66.9% of the total. These costs were mainly attributed to absences (euro 660; 22.9%), unemployment (euro 576; 20%), and presenteeism (euro 443; 15.4%). Work-related excess costs attributable to migraine amounted to euro 1630 (84.5%; Table 3), with the remaining costs attributed to excess comorbidity. Healthcare costs funded by the SNS amount to 29% of the excess costs attributed to migraine (euro 836; 95% CI, euro 618-euro 1055; P < .001), with physician consultations being the largest component, followed by medication (Table 3). Some 55.3% of this excess cost (euro 462) is attributable to migraine, whereas the remaining euro 374 (44.7%) is due to excess comorbidity associated with migraine. Costs funded by patients amounted to only 4% of the total in this study (Table 3).
Total and component annual cost per person (2020 euros) in patients with migraine and controls without migraine.
| Migraine | Excess cost (95% CI) | P | Effect size (95% CI) | ||
|---|---|---|---|---|---|
| No (n = 4288) | Yes (n = 1442) | ||||
| Healthcare resources funded by the SNS | |||||
| Medical consultationsa | 367 (18) | 744 (31) | 378 (287−469) | < .001 | 0.33 (0.27−0.39) |
| PC consultations | 145 (7) | 275 (12) | 131 (98−163) | < .001 | 0.29 (0.23−0.35) |
| Specialist consultations | 127 (11) | 283 (20) | 157 (97−216) | < .001 | 0.21 (0.15−0.27) |
| Emergency department visits | 95 (5) | 186 (9) | 91 (65−117) | < .001 | 0.26 (0.20−0.32) |
| Hospitalisation | 174 (36) | 316 (61) | 142 (–47 to 331) | .140 | – |
| Laboratory testsb | 66 (2) | 113 (3) | 47 (40−55) | < .001 | 0.47 (0.41−0.53) |
| Physiotherapy | 24 (1) | 39 (1) | 14 (11−18) | < .001 | 0.28 (0.22−0.34) |
| Psychiatry | 4 (0) | 11 (1) | 7 (6−9) | < .001 | 0.33 (0.27−0.39) |
| Nursing consultations | 5 (0) | 7 (0) | 2 (1−3) | < .001 | 0.19 (0.13−0.25) |
| Analgesic medication (NSAIDs) | 58 (1) | 59 (1) | 1 (–1 to 3) | .506 | – |
| Migraine medicationc | 0 (0) | 245 (2) | 245 (238−251) | < .001 | 3.78 (3.72−3.84) |
| Total costs (euro)d | 697 (41) | 1533 (72) | 836 (618−1055) | < .001 | 0.31 (0.25−0.37) |
| Total costs (euro) adjusted for number of comorbiditiese | 782 (41) | 1243 (72) | 462 (303−620) | < .001 | 0.35 (0.29−0.41) |
| Healthcare resources funded by the patient | |||||
| Medical consultationsa | 68 (6) | 116 (11) | 48 (19−77) | .001 | 0.11 (0.07−0.16) |
| PC consultations | 15 (2) | 28 (4) | 13 (5−22) | .003 | 0.07 (0.01−0.13) |
| Specialist consultations | 44 (5) | 71 (9) | 27 (5−49) | .018 | 0.08 (0.04−0.13) |
| Emergency department visits | 9 (1) | 17 (2) | 8 (2−14) | .009 | 0.10 (0.05−0.15) |
| Hospitalisation | 16 (7) | 7 (11) | –9 (–30 to 12) | .403 | – |
| Psychotherapy | 28 (2) | 78 (4) | 50 (39−62) | < .001 | 0.34 (0.28−0.40) |
| Homeopathy | 4 (1) | 5 (1) | 1 (–2 to 4) | .528 | – |
| Acupuncture | 2 (0) | 6 (1) | 4 (2−6) | < .001 | 0.14 (0.08−0.20) |
| Naturopathy | 5 (1) | 6 (1) | 2 (–1 to 5) | .267 | – |
| Analgesic medication (NSAIDs) | 5 (0) | 5 (0) | 1 (–1 to 2) | .327 | – |
| Migraine medicationc | 0 (0) | 21 (1) | 21 (17−25) | < .001 | 0.53 (0.48−0.58) |
| Total costs (euro)d | 126 (10) | 243 (18) | 116 (76−157) | < .001 | 0.17 (0.12−0.22) |
| Total costs (euro) adjusted for number of comorbiditiese | 135 (11) | 219 (19) | 84 (42−126) | < .001 | 0.15 (0.09−0.22) |
| Loss of work productivity | |||||
| Work absences | 306 (34) | 966 (59) | 660 (466−854) | < .001 | 0.30 (0.25−0.34) |
| Presenteeism | 315 (15) | 758 (25) | 443 (369−516) | < .001 | 0.46 (0.42−0.51) |
| Unemployment | 937 (55) | 1512 (95) | 576 (332−819) | < .001 | 0.16 (0.11−0.21) |
| Early retirement | 599 (63) | 849 (110) | 250 (1−500) | .049 | 0.06 (0.01−0.11) |
| Total costs (euro)d | 2157 (88) | 4086 (152) | 1928 (1532−2325) | < .001 | 0.34 (0.29−0.38) |
| Total costs (euro) adjusted for number of comorbiditiese | 2206 (90) | 3837 (158) | 1630 (1230−2030) | < .001 | 0.34 (0.27−0.40) |
| Total costs (euro)d | 2981 (101) | 5862 (174) | 2881 (2410−3353) | < .001 | 0.44 (0.38−0.50) |
| Total costs (euro) adjusted for number of comorbiditiese | 3123 (102) | 5299 (179) | 2176 (1729−2622) | < .001 | 0.45 (0.39−0.51) |
Data are expressed as mean (standard error). Effect size was not calculated when differences (excess cost) showed P-values > .05.
CI: confidence interval; NSAID: non-steroidal anti-inflammatory drug; PC: primary care; SNS: Spanish National Health System.
The projected annual cost per patient with migraine in Spain in 2020, for the total of diagnosed and prevalent patients, shows a societal excess cost attributable to migraine ranging between euro 10.394 billion for diagnosed migraine and euro 14.230 billion for prevalent migraine (Table 4); of these totals, a euro 6.805 billion and euro 9.131 billion, respectively, result from lost work productivity, with euro 3.167 billion and euro 4.537 billion being funded by the SNS, respectively. The section of society contributing the most to this excess cost is patients aged 35 to 64 years, with migraine in the 45-54 years age group being the most costly due to the loss of work productivity (Supplementary Material, Tables S12 and S13).
Estimated annual cost in Spain and excess cost attributable to migraine, according to diagnosed and estimated prevalent cases.
| Diagnosed cases according to the Spanish National Health Survey | ||||||
|---|---|---|---|---|---|---|
| Cost (euro) | Excess cost (euro) attributed to migraine | |||||
| Age group | Total | 95% CI | Total | 95% CI | ||
| Lower limit | Upper limit | Lower limit | Upper limit | |||
| 15−24 years | 635 209 540 | 526 032 900 | 764 236 478 | 313 922 396 | 259 966 984 | 377 687 882 |
| 25−34 years | 2 760 463 818 | 2 426 781 379 | 3 124 481 025 | 1 484 696 236 | 1 305 227 461 | 1 680 480 356 |
| 35−44 years | 4 554 908 324 | 4 136 600 417 | 5 019 694 888 | 2 169 406 190 | 1 970 175 009 | 2 390 774 168 |
| 45−54 years | 6 182 529 602 | 5 631 611 123 | 6 794 661 246 | 3 330 410 503 | 3 033 641 251 | 3 660 154 118 |
| 55−64 years | 5 300 101 234 | 4 781 613 070 | 5 818 589 398 | 2 409 669 272 | 2 173 940 756 | 2 645 397 787 |
| 65−74 years | 854 042 334 | 756 437 496 | 976 048 381 | 524 934 763 | 464 942 218 | 599 925 443 |
| 75+ years | 625 803 120 | 556 269 440 | 704 028 510 | 161 443 890 | 143 505 680 | 181 624 376 |
| 15+ years | 20 913 057 972 | 18 815 345 824 | 23 201 739 926 | 10 394 483 250 | 9 351 399 359 | 11 536 044 131 |
| Estimated prevalence according to the PALM study, 2010 | ||||||
|---|---|---|---|---|---|---|
| Cost (euro) | Excess cost (euro) attributed to migraine | |||||
| Age group | Total | 95% CI | Total | 95% CI | ||
| Lower limit | Upper limit | Lower limit | Upper limit | |||
| 15−24 years | 990 033 619 | 919 741 232 | 1 060 326 006 | 489 277 484 | 454 538 783 | 524 016 185 |
| 25−34 years | 3 435 412 389 | 3 191 498 110 | 3 679 326 669 | 1 847 712 624 | 1 716 525 028 | 1 978 900 220 |
| 35−44 years | 4 601 386 980 | 4 274 688 505 | 4 928 085 456 | 2 191 542 988 | 2 035 943 436 | 2 347 142 540 |
| 45−54 years | 10 559 270 855 | 9 809 562 624 | 11 308 979 086 | 5 688 077 345 | 5 284 223 853 | 6 091 930 836 |
| 55−64 years | 6 135 443 276 | 5 699 826 804 | 6 571 059 749 | 2 789 454 102 | 2 591 402 861 | 2 987 505 344 |
| 65−74 years | 1 532 395 959 | 1 423 595 846 | 1 641 196 072 | 941 882 946 | 875 009 256 | 1 008 756 635 |
| 75+ years | 1 091 678 776 | 1 014 169 583 | 1 169 187 969 | 281 629 897 | 261 634 174 | 301 625 620 |
| 15+ years | 28 345 621 854 | 26 333 082 703 | 30 358 161 006 | 14 229 577 386 | 13 219 277 391 | 15 239 877 380 |
Costs are expressed in 2020 euros.
The total annual cost of migraine was significantly higher in men than among women (euro 7301 vs euro 5398), with an adjusted difference of euro 2172 (95% CI, euro 1125-euro 3218; P < .001) (Table 5). This difference was due to significantly higher work-related costs among men as compared to women with migraine (euro 5870 vs euro 3522; P < .001). Healthcare costs, whether financed by the SNS or by patients themselves, did not show statistically significant differences between sexes (Table 5). Age constitutes a determining factor for total cost and its main components, with a generalised significant increase up to the age of 64 years (P < .001) as a result of increased work-related costs (Figs. 1 and 2), whereas healthcare costs funded by the SNS showed an upward trend as age increased; this trend became more apparent from the age of 65 years, both in patients and in controls without migraine (Fig. 1). Migraine was associated with greater societal costs (both total and per component) in all but the > 75 years age group.
Total and component annual cost per person and excess cost (2020 euros) in patients with migraine and controls without migraine, by sex.
| Women | |||||
|---|---|---|---|---|---|
| Migraine | Excess costa (95% CI) | P | Effect size (95% CI) | ||
| No (n = 3287) | Yes (n = 1114) | ||||
| Healthcare costs funded by the SNS (euro) | 740 (52) | 1628 (89) | 888 (615−1161) | < .001 | 0.30 (0.23−0.37) |
| Healthcare costs funded by the patient (euro) | 134 (13) | 273 (22) | 139 (92−187) | < .001 | 0.18 (0.11−0.25) |
| Costs of loss of productivity (euro) | 1946 (89) | 3522 (152) | 1577 (1183−1971) | < .001 | 0.32 (0.25−0.39) |
| Total cost per person (euro) | 2820 (107) | 5398 (184) | 2578 (2076−3081) | < .001 | 0.42 (0.36−0.49) |
| Men | |||||
|---|---|---|---|---|---|
| Migraine | Excess costa (95% CI) | P | Effect size (95% CI) | ||
| No (n = 1001) | Yes (n = 328) | ||||
| Healthcare costs funded by the SNS (euro) | 559 (49) | 1206 (86) | 647 (394−901) | < .001 | 0.42 (0.29−0.54) |
| Healthcare costs funded by the patient (euro) | 101 (16) | 234 (28) | 133 (61−204) | < .001 | 0.26 (0.14−0.39) |
| Costs of loss of productivity (euro) | 2889 (236) | 5870 (417)b | 2980 (1880−4081)c | < .001 | 0.40 (0.27−0.52) |
| Total cost per person (euro) | 3549 (249) | 7301 (440)b | 3752 (2582−4922)c | < .001 | 0.48 (0.35−0.60) |
Data are expressed as mean (standard error).
CI: confidence interval; SNS: Spanish National Health System.
: total (A) and funded by the National Health System (B), by age group, in patients with migraine and controls. Data are presented as means adjusted for propensity score and covariates with 95% confidence intervals calculated with robust regression. SNS: Spanish National Health System.")
Annual cost per person and excess cost (euros, year 2020): total (A) and funded by the National Health System (B), by age group, in patients with migraine and controls.
Data are presented as means adjusted for propensity score and covariates with 95% confidence intervals calculated with robust regression.
SNS: Spanish National Health System.
: due to lost work productivity (A) and funded by the patient (B), by age group, in patients with migraine and controls. Data are presented as means adjusted for propensity score and covariates with 95% confidence intervals calculated with robust regression.")
Annual cost per person and excess cost (euros, year 2020): due to lost work productivity (A) and funded by the patient (B), by age group, in patients with migraine and controls.
Data are presented as means adjusted for propensity score and covariates with 95% confidence intervals calculated with robust regression.
The sensitivity analysis (Fig. 3) showed that the results from the base case are robust, confirming the excess cost observed in patients with migraine in all scenarios, both for total cost and for its main components, with magnitudes whose 95% CIs overlapped with the excess cost observed in the base case: no statistically significant difference was observed between the base case and any of the alternative scenarios evaluated.
, and its main components, in the base case compared with the alternative scenarios included in the sensitivity analysis. Excess cost is expressed as a mean adjusted for covariates with a 95% confidence interval calculated with robust regression. Comparison of the alternative scenarios against the base case identified no significant differences. No matching: costs calculated without propensity index matching, but controlling for covariates and variables included to calculate the propensity score in the base case; 103 matching: propensity score matching with a 0.001 calliper; 105 matching: propensity score matching with a 0.00001 calliper; 1:1 matching: propensity score matching with 1 control per patient with migraine, without application of optimal matching. SNS: Spanish National Health System.")
Sensitivity analysis of the total annual excess cost in patients with migraine (euros, year 2020), and its main components, in the base case compared with the alternative scenarios included in the sensitivity analysis.
Excess cost is expressed as a mean adjusted for covariates with a 95% confidence interval calculated with robust regression. Comparison of the alternative scenarios against the base case identified no significant differences. No matching: costs calculated without propensity index matching, but controlling for covariates and variables included to calculate the propensity score in the base case; 103 matching: propensity score matching with a 0.001 calliper; 105 matching: propensity score matching with a 0.00001 calliper; 1:1 matching: propensity score matching with 1 control per patient with migraine, without application of optimal matching. SNS: Spanish National Health System.
The results of this study further expand the current understanding of the cost and burden of migraine in Spain; as an original aspect, it contributes a comparison against controls without migraine, enabling quantification of the costs that may be attributed specifically to migraine. The 2020 EHSS is a robust data source, due both to its representativeness of the national population and to its capacity to guarantee a sufficiently large sample size19; in contrast, other studies have used different approaches including non-probability convenience sampling.14,15 In particular, this is the first study in Spain to include a control group without migraine selected using propensity score matching to control for potential bias; this enabled us to estimate the excess cost attributable specifically to migraine. In turn, we were able to calculate the excess cost of migraine both for the published prevalence rate and for the total diagnosed cases reported by the EHSS.4,5,19 While various international studies have provided information on the cost of migraine as a function of type of migraine or frequency of episodes,7,8,13,15–17 few studies to date have included a control group; examples include the recent study by Buse et al.29 and the study by Vo et al.,30 conducted in 5 European countries including Spain. The annual cost per person with migraine observed in this study (euro 5862) was considerably lower than those reported by the Atlas study (euro 10 303)15 and in the study by Caronna et al.26 (euro11 112), both of which were conducted recently in our healthcare setting. This difference may be explained by the use of non-probability convenience sampling of patients with migraine recruited from patients’ associations, with over-representation of chronic migraine (39% of participants), in the Atlas study, or the exclusive recruitment of hospital employees, in the study by Caronna et al.,26 rather than the use of a sample from the general population (whether in active employment or unemployed), as in our study. Our results showed that the cost per person among patients with migraine was twice that of controls without migraine, with an annual excess cost of euro 2881 per person; this was mainly attributed to the considerable excess cost due to lost work productivity (euro 1928 per person with migraine), which amounted to nearly 67% of the total excess cost. This work-related excess cost was explained by the number of additional days of absence (22.35) and presenteeism (31.39), as well as an unemployment rate of 21.6% (8.1% higher than that observed in controls). These data are not far removed from those reported in recent studies conducted in the United States and Brazil, which used similar study designs and control groups to those of our own study31,32; however, the difference in unemployment rates in our study may be considered a novel contribution, as similar studies do not report this finding. Some 29% of the excess cost was funded by the SNS, whereas only 4% was funded by patients themselves. The excess cost funded by the SNS is mainly attributed to a greater healthcare burden, with higher numbers of primary care consultations, although specialist and emergency consultations also played a role. These findings have not always been observed in previous studies, which have reported limited use of specialist consultations with respect to primary care consultations.32 However, the costs attributed to medication use did not include antibodies against the calcitonin gene–related peptide receptor or ligand, which were not commercially available at the time the fieldwork for our study was conducted.33 The percentage distribution of excess cost in our study (two-thirds indirect and one-third direct costs) largely coincides with those reported in other recent studies in Spain (the Atlas study15 and the hospital study by Caronna et al.26).
The sensitivity analysis confirmed that the results from the base case were robust: the alternative scenarios showed similar excess costs in patients with migraine versus controls, with no significant differences as compared to the base case. The subgroup analysis by sex showed an excess cost in men as compared to women with migraine (euro 3752 vs euro 2578), which is explained by greater loss of productivity; this finding has not been reported by other authors. The subgroup analysis by age group found age to be a determinant of total cost and of its main components (in both patients and controls): we observed a significant increase in total costs up to the age of 64 years, as a result of increased work-related costs; costs funded by the SNS trended upwards with age, with a stronger association from 65 years of age. In any case, migraine was associated with greater societal and direct healthcare costs in all but the > 75 years age group. A literature search identified no studies including a similar subgroup analysis to our own that would enable us to place our results in context, although this result is in line with what we may expect, given these patients’ high demand for medical consultations.
Loss of productivity in patients with migraine, which our analysis found was related to work absences and presenteeism, as well as excess unemployment among these patients, appears to be a direct consequence of migraine; this has been noted in previous studies, both in Spain and internationally, and in both hospital and non-hospital settings.7–11,15–17,26,29–35 In fact, three-quarters of the total excess cost observed was directly attributable to migraine (85% in the case of work-related costs), although this decreased to 55% for healthcare costs funded by the SNS, with the healthcare-related excess cost being explained by the excess comorbidity (mainly depression and anxiety) observed in patients with migraine, compared to controls without migraine. This, together with the increased use of healthcare resources by patients with migraine, explains the excess costs observed. Though the impact of migraine on work productivity seems obvious, given the interference of headache in work performance, the excess comorbidity in these patients may also contribute to the healthcare-related excess cost, in addition to migraine itself, as mentioned previously.36,37 Specifically, patients with migraine presented a particularly high prevalence of depression and anxiety (OR ≥ 4); other disorders showing a strong association with migraine (OR ≥ 2.5) included arthrosis, chronic back pain, stomach ulcers, and kidney and liver disease (Supplementary Material, Tables S12 and S13), which would also have led to the use of healthcare resources. These findings are consistent with previous studies in other settings.16,17,36–40 Comorbid disorders may hinder the diagnosis and treatment of migraine, negatively impacting quality of life and increasing migraine-related disability and the risk of chronic transformation40–42; although our study did not differentiate between types of migraine, this transformation often leads to an increase in direct and indirect costs, as reported in recent studies.43
The observed magnitude of the annual excess cost of migraine (euro 1928 for work-related costs and euro 836 for healthcare costs; total, euro 2881) is consistent with those reported in previous Spanish and European studies,14–17,26,30 although somewhat distant from those reported in studies conducted in the United States,29,32–35 as we may expect. The projected total annual excess cost of prevalent and diagnosed migraine in Spain for the year 2020, based on the annual cost per person, amounts to a societal cost of between euro 10.394 billion, for diagnosed migraine, and euro 14.230 billion, for prevalent migraine (somewhat more conservative but not very distant from the values reported by the Eurolight Project for Spain17); of these totals, euro 6.805 billion and euro 9.131 billion, respectively, are attributed to lost productivity, euro 3.167 billion and euro 4.537 billion to healthcare costs funded by the SNS, and euro 422 million and euro 560 million to healthcare expenses paid out-of-pocket by patients. The reason for this dual projection of the costs attributable to migraine in Spain is the potential uncertainty that may arise due to the fact that the study is based on a health survey, rather than a prevalence study, as was the case for previous studies published in Spain. Due to this, we are unable to estimate the excess cost of undiagnosed prevalent cases of migraine, of which there are a considerable number, according to the Spanish Society of Neurology25 and other recent studies in our setting.26 This excess cost attributable to migraine is equivalent to 0.84%-1.14% of Spain’s gross domestic product for the year 2019,44 with the healthcare-related excess costs amounting to 4.22%-6.04% of public healthcare expenditure.45 It is also interesting to note that, according to our results, migraine is responsible for 63.6 million to 87.3 million additional lost work days per year in comparison to the working population without migraine; this is equivalent to 0.19%-0.28% of the days worked by the Spanish workforce in 2019.44 These findings are, therefore, consistent with those of the Eurolight project, which also reported a considerable number of lost work days in other European countries.46
LimitationsDue to its design, this study is based on data from a health survey. Although it used the CAPI methodology, this approach may result in incorrect estimations due to the absence of a healthcare professional during interviews, and the lack of electronic medical records of survey respondents. Nonetheless, the methodology applied, which is widely used, standardised, and normalised with the health surveys conducted in other European countries, is included in the National Statistics Plan, and surveys are conducted jointly by the National Statistics Institute and the Ministry of Health. Therefore, the data sources used in this study may be considered sufficiently robust. Some variables that are useful for calculating the cost of illness could not be collected, as they were not recorded in the data sources used. For instance, we did not account for the use of day hospital appointments for the administration of intravenous analgesic medications and/or lumbar puncture procedures, although this is not a common practice47; as well as resources funded by patients, such as physical exercise, diet, costs of transport related to the disease, special diets, and home adaptations. The EHSS did not classify migraine diagnosis by type of presentation (chronic or episodic), or collect information on the frequency of migraine attacks over a given period or whether they were accompanied by such other symptoms as aura, etc; therefore, we were unable to establish whether there was any association between the type or frequency of migraine and its cost. We also cannot rule out the possibility that the control group may include individuals with undiagnosed migraine, which may have resulted in some errors in the cost calculation. Nonetheless, we consider that given the method used for the identification of individuals with and without migraine in this study, the number of undiagnosed cases potentially included would be too small to cause any relevant bias in the calculations made. Finally, the calculation of medication use by patients with migraine was based on data from the BDCAP, as the EHSS did not collect detailed enough information to estimate the cost of medication funded by the SNS or by patients themselves. As a result, we were unable to infer the cost of some prophylactic therapies, such as calcium antagonists and botulinum toxin injections, as well as treatments that became commercially available in Spain after 2019.
ConclusionOur results support and expand the findings of previous research into the cost of migraine in Spain, which are mainly made up of a greater loss of work productivity and increased use of healthcare resources, compared to individuals without migraine. The annual excess cost was considerable, reaching twice the value observed in controls without migraine, particularly due to the loss of productivity and increased healthcare-related costs. Three-quarters of the excess cost can be attributed directly to migraine, with the remainder being explained by the excess comorbidities observed in patients with migraine, compared to controls. Given the high prevalence of migraine, the economic impact attributable to the disorder ranges between euro 10.394 billion and euro 14.230 billion, in Spain in the year 2020. Approximately 65% of these costs are due to lost productivity, and 30% are funded by the SNS.
This study has been funded by Lundbeck Iberia. Javier Rejas-Gutiérrez and Belén Ferro-Rey received consulting honorary. Susana Gómez-Lus is employee of Lundbeck Iberia. José Fernández-Ferro, Carlos Ordás-Bandera and José Miguel Láinez Andrés declare no conflict of interest in connection with this work.
The following is Supplementary data to this article:
