


Quantitative assessment of macular and nerve fibre layer thickness in multiple sclerosis patients with regard to expanded disability status scale (EDSS) and presence or absence of previous optic neuritis episodes.
MethodsWe recruited 62 patients with multiple sclerosis (53 relapsing-remitting and 9 secondary-progressive) and 12 disease-free controls. All patients underwent an ophthalmological examination, including quantitative analysis of the nerve fibre layer and macular thickness using optical coherence tomography. Patients were classified according to EDSS as A (lower than 1.5), B (between 1.5 and 3.5), and C (above 3.5).
ResultsMean nerve fibre layer thickness in control, A, B, and C groups was 103.35±12.62, 99.04±14.35, 93.59±15.41, and 87.36±18.75μm respectively, with statistically significant differences (P<.05). In patients with no history of optic neuritis, history of episodes in the last 3 to 6 months, or history longer than 6 months, mean nerve fibre layer thickness was 99.25±13.71, 93.92±13.30 and 80.07±15.91μm respectively; differences were significant (P<.05). Mean macular thickness in control, A, B, and C groups was 220.01±12.07, 217.78±20.02, 217.68±20.77, and 219.04±24.26μm respectively. Differences were not statistically significant.
ConclusionsThe mean retinal nerve fibre layer thickness in multiple sclerosis patients is related to the EDSS level. Patients with previous optic neuritis episodes have a thinner retinal nerve fibre layer than patients with no history of these episodes. Mean macular thickness is not correlated to EDSS level.
Evaluar cuantitativamente el grosor macular y de la capa de fibras nerviosas en pacientes con esclerosis múltiple en relación con la escala expandida del estado de discapacidad (EDSS) con o sin antecedentes previos de neuritis óptica.
MétodosSesenta y dos pacientes diagnosticados de esclerosis múltiple (53 remitente recidivante y 9 secundariamente progresiva) y 12 libres de enfermedad fueron reclutados para el estudio. Se les realizó una exploración oftalmológica, incluyendo el análisis cuantitativo de la capa de fibras nerviosas retinianas y el grosor macular mediante tomografía óptica de coherencia. Los pacientes fueron clasificados según la escala EDSS en: A: inferior a 1,5; B: entre 1,5 y 3,5, y C: superior a 3,5.
ResultadosEl grosor medio ± desviación estándar de la capa de fibras nerviosas en los grupos control, A, B y C fue de 103,35±12,62, 99,04±14,35, 93,59±15,41 y 87,36±18,75μm, respectivamente, con diferencias estadísticamente significativas (p<0,05). En pacientes sin una historia previa de neuritis, o con un episodio de esta patología entre 3 y 6 meses de evolución o anterior a 6 meses, el grosor medio fue de 99,25±13,71, 93,92±13,30, 80,07±15,91μm, respectivamente, con diferencias significativas (p<0,05). El grosor macular medio en el grupo control, A, B y C se situó en 220,01±12,07, 217,78±20,02, 217,68±20,77 y 219,04±24,26μm, respectivamente. Las diferencias observadas entre grupos no fueron estadísticamente significativas.
ConclusionesEl grosor medio de la capa de fibras nerviosas en pacientes con esclerosis múltiple se relaciona con el nivel en la escala EDSS. Los pacientes con historia previa de neuritis óptica cursan con una disminución del grosor de esta capa respecto a aquellos sin antecedentes de neuritis. El grosor macular no se relaciona con el grado de afectación en la EDSS.
Optical coherence tomography is an easy-to-perform, non-invasive technique that quantitatively analyses the thickness of the retinal nerve fibre layer (RNFL). It uses low-coherence light, which is produced by a superluminescent diode coupled with an optical fibre interferometer, at a wavelength of 843nm.1 Studies using optical coherence tomography in patients with multiple sclerosis (MS) have shown that the RNFL is thinner in these patients than in healthy individuals.2,3
In a sample of 14 patients with MS and a history of optic neuritis with complete recovery of visual acuity, Parisi et al.4 reported a 48% decrease in RNFL thickness. In the contralateral eye, which had not been affected by optic neuritis, RNFL thickness decreased a mean of 28% compared to the control group.
Most published studies have analysed the connection between RNFL thickness and grey matter fraction, brain volume, degree of brain atrophy, optic neuritis, some clinical forms of MS, visual field sensitivity, and the contrast sensitivity test.2,5–11 However, few studies have addressed the relationship between RNFL thickness and the expanded disability status scale (EDSS) and these include patients with no history of optic neuritis.12–14
The purpose of our study was to quantitatively analyse macular and RNFL thickness in patients with MS both with and without a history of optic neuritis, and to assess their association with certain clinical forms of MS and EDSS scores.
Material and methodsWe conducted a retrospective study including 62 patients diagnosed with MS (53 with relapsing-remitting MS and 9 with secondary-progressive MS) and a control group of 12 patients without the disease. In compliance with the Declaration of Helsinki, confidentiality of the results was guaranteed and all patients were apprised of the characteristics of the study before signing informed consent forms.
The patients were recruited from the neurology department at Hospital Universitario Virgen de la Victoria in Málaga, Spain, between February 2012 and January 2013. Controls were randomly selected from the patients with no eye disorders or systemic diseases who visited the ophthalmology polyclinic and who met the following criteria: visual acuity 10/10 on a Snellen chart, intraocular pressure <21mmHg, and absence of anterior or posterior segment abnormalities. The MS diagnosis was confirmed by the neurology department based on clinical examinations and neuroimaging studies.
The ophthalmological examination of all participants included: a visual acuity test using a Snellen chart (values expressed in decimals), intraocular pressure determination with a Perkins applanation tonometer, and an eye fundus examination with a non-contact biomicroscopy with a Volk 84D lens.
Clinical diagnosis of a previous episode of optic neuritis involved the following clinical findings: visual acuity loss associated with painful eye movements, visual field defects, colour vision defects, afferent pupillary defect, and poor performance on the contrast sensitivity test, with either apparently normal or oedematous papilla. We excluded the patients who less than 3 months prior to the study experienced an episode of optic neuritis.
We used the EDSS15 to assess neurological impairment. This quantitative scale ranges from 0 (normal) to 10 (death due to MS) in 0.5 unit increments. Scoring is based on a functional scale that assesses pyramidal, cerebellar, brainstem, sensitivity, bowel and bladder, visual, and mental functions, as well as difficulties in walking, communicating, and swallowing. Visual function included 7 grades: 0: normal; 1: scotoma with visual acuity better than 20/30 (corrected); 2: worse eye with scotoma with maximal visual acuity (corrected) between 20/30 and 20/59; 3: worse eye with large scotoma, or moderate decrease in fields, but with maximal visual acuity (corrected) between 20/60 and 20/99; 4: worse eye with marked decrease of fields and maximal visual acuity (corrected) between 20/100 and 20/200; 5: worse eye with maximal visual acuity (corrected) less than 20/200; and 6: grade 5 plus maximal visual acuity of better eye of 20/60 or less.
To study macular and RNFL thickness, we used the Stratus OCT 3000 optical coherence tomography system (Zeiss Humphrey Systems, Dublin, CA, USA) and 2 scan acquisition protocols: Macular Thickness Map, which performs 6 6-mm radial scans in 9seconds, and the Fast RNFL Thickness, which performs 3 3.4-mm diameter circular scans in a single 1.92-second scan (Figs. 1 and 2).


The Retinal Thickness/Volume Tabular protocol was used to quantitatively analyse macular thickness. This protocol yielded 2 circular maps for measuring macular thickness in the 1000-, 3000-, and 6000-μm-diameter areas centred on the fovea, although we analysed thickness only in the 1000- and 3000-μm-diameter areas.
RNFL thickness was determined with the RNFL Thickness Average protocol, which quantitatively analysed thickness in 4 sectors or quadrants. In our study, we included mean RNFL thickness in the 4 sectors as well as RNFL thickness in each sector (superior, inferior, temporal, and nasal).
Data were gathered using FileMaker version 10 for Windows.
Data analysis was performed using SPSS statistical software version 15.0 for Windows. We used the parametric ANOVA test to compare the means between groups. The comparative analysis of quantitative variables was performed with the Pearson bivariate correlation test. Statistical significance was set at P<.05.
ResultsIn our sample, 36.5% of the participants were men, and 63.5% were women. Mean age±SD was 36.50±8.92 years in the patient group and 32.7±8.33 years in the control group. Disease progression time was 81.54±74.81 months. MS was relapsing-remitting in 85.4% of the patients (53/62) and secondary-progressive in 14.6% (9/62); 70.96% of the patients (44/62) were treated with immunomodulatory drugs (interferon beta).
Eleven patients had a single relapse, 20 had 2, 9 had 3, 10 had 4, and 12 had 5 relapses. Visual acuity was 0.91±0.21 in the patient group and 1.02±0.18 in the control group (Table 1).
Characteristics of patients with, and controls without, MS.
| Patients | Controls | |
|---|---|---|
| n | 62 | 12 |
| Relapsing-remitting: 53 (85.4%) | ||
| Secondary-progressive: 9 (16.6%) | ||
| Eyes (n) | 124 | 24 |
| Age, years (mean±SD) | 36.50±8.92 | 32.7±8.33 |
| Disease duration, months (mean±SD) | 81.54±4.81 | – |
| EDSS score (mean±SD) | 2.46±2.04 | – |
| VA (mean±SD) | 0.91±0.21 | 1.02±0.18 |
| IOP (mean±SD) | 16.3±1.4 | 16.7±0.9 |
VA, visual acuity; SD, standard deviation; EDSS, expanded disability status scale; n, number; IOP: intraocular pressure.
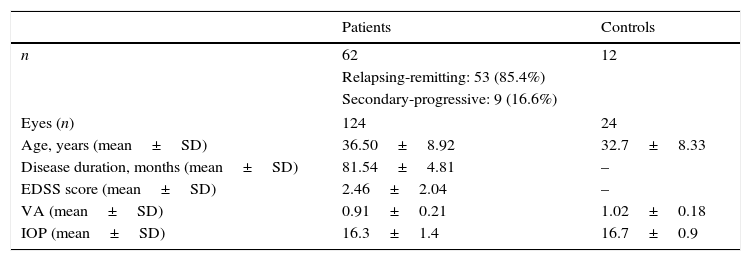
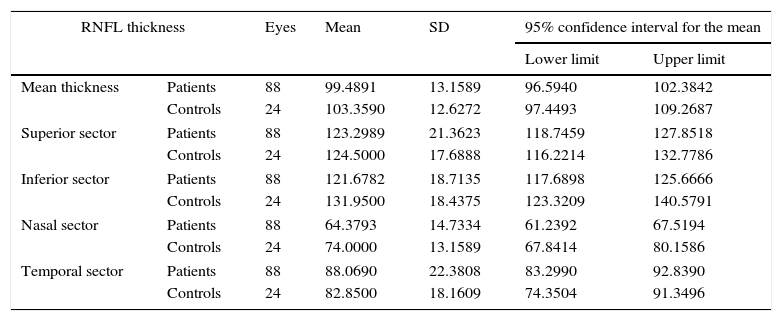
We found statistically significant differences in mean RNFL thickness (P=.02) and in RNFL thickness in the temporal (P=.02) and inferior (P=.01) sectors between patients and controls (Table 2). After excluding the patients who had experienced an episode of optic neuritis, differences were significant only for the temporal sector (P<.05) (Table 3).
RNFL thickness in patients with MS and controls.
| RNFL thickness | Eyes | Mean | SD | 95% confidence interval for the mean | ||
|---|---|---|---|---|---|---|
| Lower limit | Upper limit | |||||
| Mean thickness | Patients | 124 | 94.5418 | 16.2078 | 91.6488 | 97.4348 |
| Controls | 24 | 103.3590 | 12.6272 | 97.4493 | 109.2687 | |
| Superior sector | Patients | 124 | 118.3740 | 23.1557 | 114.2408 | 122.5072 |
| Controls | 24 | 124.5000 | 17.6888 | 116.2214 | 132.7786 | |
| Inferior sector | Patients | 124 | 115.5203 | 22.1323 | 111.5698 | 119.4708 |
| Controls | 24 | 131.9500 | 18.4375 | 123.3209 | 140.5791 | |
| Nasal sector | Patients | 124 | 83.1545 | 23.4430 | 78.9700 | 87.3389 |
| Controls | 24 | 82.8500 | 18.1609 | 74.3504 | 91.3496 | |
| Temporal sector | Patients | 124 | 61.2276 | 15.6476 | 58.4346 | 64.0207 |
| Controls | 24 | 74.0000 | 13.1589 | 67.8414 | 80.1586 | |
Comparison of mean thickness and thickness in each sector of the RNFL. Values are expressed in microns. 95% confidence intervals for means±SD.
RNFL thickness in controls and MS patients without optic neuritis.
| RNFL thickness | Eyes | Mean | SD | 95% confidence interval for the mean | ||
|---|---|---|---|---|---|---|
| Lower limit | Upper limit | |||||
| Mean thickness | Patients | 88 | 99.4891 | 13.1589 | 96.5940 | 102.3842 |
| Controls | 24 | 103.3590 | 12.6272 | 97.4493 | 109.2687 | |
| Superior sector | Patients | 88 | 123.2989 | 21.3623 | 118.7459 | 127.8518 |
| Controls | 24 | 124.5000 | 17.6888 | 116.2214 | 132.7786 | |
| Inferior sector | Patients | 88 | 121.6782 | 18.7135 | 117.6898 | 125.6666 |
| Controls | 24 | 131.9500 | 18.4375 | 123.3209 | 140.5791 | |
| Nasal sector | Patients | 88 | 64.3793 | 14.7334 | 61.2392 | 67.5194 |
| Controls | 24 | 74.0000 | 13.1589 | 67.8414 | 80.1586 | |
| Temporal sector | Patients | 88 | 88.0690 | 22.3808 | 83.2990 | 92.8390 |
| Controls | 24 | 82.8500 | 18.1609 | 74.3504 | 91.3496 | |
Comparison of mean thickness and thickness in each sector of the RNFL. Values are expressed in microns. 95% confidence intervals for means±SD.
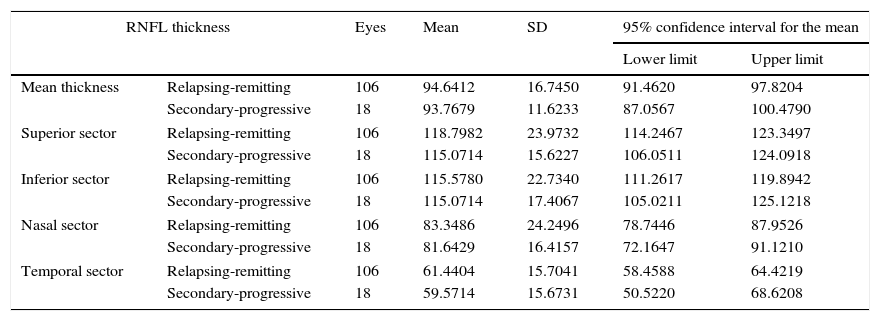
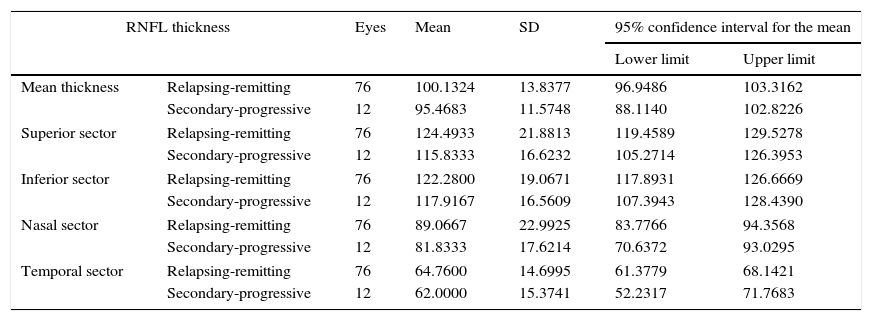
Table 4, which analyses mean RNFL thickness and RNFL thickness in each sector by the clinical form of MS, shows a decrease in thickness in the patients with secondary-progressive MS compared to those with relapsing-remitting MS; however, these differences were not statistically significant. When excluding those patients with a history of optic neuritis, the differences were still not significant (Table 5).
RNFL thickness in the patient group, broken down by clinical form of MS.
| RNFL thickness | Eyes | Mean | SD | 95% confidence interval for the mean | ||
|---|---|---|---|---|---|---|
| Lower limit | Upper limit | |||||
| Mean thickness | Relapsing-remitting | 106 | 94.6412 | 16.7450 | 91.4620 | 97.8204 |
| Secondary-progressive | 18 | 93.7679 | 11.6233 | 87.0567 | 100.4790 | |
| Superior sector | Relapsing-remitting | 106 | 118.7982 | 23.9732 | 114.2467 | 123.3497 |
| Secondary-progressive | 18 | 115.0714 | 15.6227 | 106.0511 | 124.0918 | |
| Inferior sector | Relapsing-remitting | 106 | 115.5780 | 22.7340 | 111.2617 | 119.8942 |
| Secondary-progressive | 18 | 115.0714 | 17.4067 | 105.0211 | 125.1218 | |
| Nasal sector | Relapsing-remitting | 106 | 83.3486 | 24.2496 | 78.7446 | 87.9526 |
| Secondary-progressive | 18 | 81.6429 | 16.4157 | 72.1647 | 91.1210 | |
| Temporal sector | Relapsing-remitting | 106 | 61.4404 | 15.7041 | 58.4588 | 64.4219 |
| Secondary-progressive | 18 | 59.5714 | 15.6731 | 50.5220 | 68.6208 | |
Comparison of mean thickness and thickness in each sector of the RNFL. Values are expressed in microns. 95% confidence intervals for means±SD.
RNFL thickness in MS patients without optic neuritis, broken down by clinical form of MS.
| RNFL thickness | Eyes | Mean | SD | 95% confidence interval for the mean | ||
|---|---|---|---|---|---|---|
| Lower limit | Upper limit | |||||
| Mean thickness | Relapsing-remitting | 76 | 100.1324 | 13.8377 | 96.9486 | 103.3162 |
| Secondary-progressive | 12 | 95.4683 | 11.5748 | 88.1140 | 102.8226 | |
| Superior sector | Relapsing-remitting | 76 | 124.4933 | 21.8813 | 119.4589 | 129.5278 |
| Secondary-progressive | 12 | 115.8333 | 16.6232 | 105.2714 | 126.3953 | |
| Inferior sector | Relapsing-remitting | 76 | 122.2800 | 19.0671 | 117.8931 | 126.6669 |
| Secondary-progressive | 12 | 117.9167 | 16.5609 | 107.3943 | 128.4390 | |
| Nasal sector | Relapsing-remitting | 76 | 89.0667 | 22.9925 | 83.7766 | 94.3568 |
| Secondary-progressive | 12 | 81.8333 | 17.6214 | 70.6372 | 93.0295 | |
| Temporal sector | Relapsing-remitting | 76 | 64.7600 | 14.6995 | 61.3779 | 68.1421 |
| Secondary-progressive | 12 | 62.0000 | 15.3741 | 52.2317 | 71.7683 | |
Comparison of mean thickness and thickness in each sector of the RNFL. Values are expressed in microns. 95% confidence intervals for means±SD.
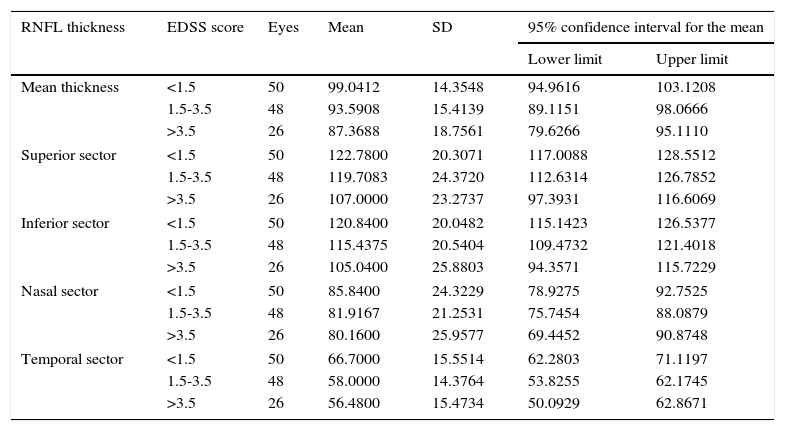
Degree of disability was established based on EDSS scores. The mean EDSS score was 2.46±2.04. We established the following ordinal scale for EDSS scores: A: <1.5; B: 1.5 to 3.5; and C: >3.5. Twenty-five patients were classified into level A, 24 into level B, and 13 into level C. In our sample, none of the patients scored above 6.5.
Table 6 shows RNFL thickness by EDSS level. The statistical analysis revealed significant differences between EDSS levels in terms of mean thickness (P=.011), and thickness in the superior (P=.017), inferior (P=.013), and temporal (P=.005) sectors.
RNFL thickness broken down by EDSS level.
| RNFL thickness | EDSS score | Eyes | Mean | SD | 95% confidence interval for the mean | |
|---|---|---|---|---|---|---|
| Lower limit | Upper limit | |||||
| Mean thickness | <1.5 | 50 | 99.0412 | 14.3548 | 94.9616 | 103.1208 |
| 1.5-3.5 | 48 | 93.5908 | 15.4139 | 89.1151 | 98.0666 | |
| >3.5 | 26 | 87.3688 | 18.7561 | 79.6266 | 95.1110 | |
| Superior sector | <1.5 | 50 | 122.7800 | 20.3071 | 117.0088 | 128.5512 |
| 1.5-3.5 | 48 | 119.7083 | 24.3720 | 112.6314 | 126.7852 | |
| >3.5 | 26 | 107.0000 | 23.2737 | 97.3931 | 116.6069 | |
| Inferior sector | <1.5 | 50 | 120.8400 | 20.0482 | 115.1423 | 126.5377 |
| 1.5-3.5 | 48 | 115.4375 | 20.5404 | 109.4732 | 121.4018 | |
| >3.5 | 26 | 105.0400 | 25.8803 | 94.3571 | 115.7229 | |
| Nasal sector | <1.5 | 50 | 85.8400 | 24.3229 | 78.9275 | 92.7525 |
| 1.5-3.5 | 48 | 81.9167 | 21.2531 | 75.7454 | 88.0879 | |
| >3.5 | 26 | 80.1600 | 25.9577 | 69.4452 | 90.8748 | |
| Temporal sector | <1.5 | 50 | 66.7000 | 15.5514 | 62.2803 | 71.1197 |
| 1.5-3.5 | 48 | 58.0000 | 14.3764 | 53.8255 | 62.1745 | |
| >3.5 | 26 | 56.4800 | 15.4734 | 50.0929 | 62.8671 | |
Comparison of RNFL mean thickness and thickness in each sector. Values are expressed in microns. 95% confidence intervals for means±SD.
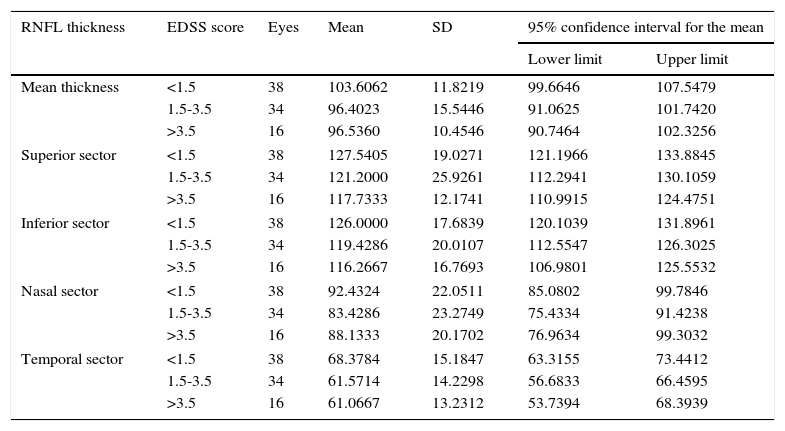
After excluding the patients with optic neuritis, the differences between EDSS levels were significant only for mean thickness (P<.05) (Table 7).
RNFL thickness by EDSS level in the group of MS patients without optic neuritis.
| RNFL thickness | EDSS score | Eyes | Mean | SD | 95% confidence interval for the mean | |
|---|---|---|---|---|---|---|
| Lower limit | Upper limit | |||||
| Mean thickness | <1.5 | 38 | 103.6062 | 11.8219 | 99.6646 | 107.5479 |
| 1.5-3.5 | 34 | 96.4023 | 15.5446 | 91.0625 | 101.7420 | |
| >3.5 | 16 | 96.5360 | 10.4546 | 90.7464 | 102.3256 | |
| Superior sector | <1.5 | 38 | 127.5405 | 19.0271 | 121.1966 | 133.8845 |
| 1.5-3.5 | 34 | 121.2000 | 25.9261 | 112.2941 | 130.1059 | |
| >3.5 | 16 | 117.7333 | 12.1741 | 110.9915 | 124.4751 | |
| Inferior sector | <1.5 | 38 | 126.0000 | 17.6839 | 120.1039 | 131.8961 |
| 1.5-3.5 | 34 | 119.4286 | 20.0107 | 112.5547 | 126.3025 | |
| >3.5 | 16 | 116.2667 | 16.7693 | 106.9801 | 125.5532 | |
| Nasal sector | <1.5 | 38 | 92.4324 | 22.0511 | 85.0802 | 99.7846 |
| 1.5-3.5 | 34 | 83.4286 | 23.2749 | 75.4334 | 91.4238 | |
| >3.5 | 16 | 88.1333 | 20.1702 | 76.9634 | 99.3032 | |
| Temporal sector | <1.5 | 38 | 68.3784 | 15.1847 | 63.3155 | 73.4412 |
| 1.5-3.5 | 34 | 61.5714 | 14.2298 | 56.6833 | 66.4595 | |
| >3.5 | 16 | 61.0667 | 13.2312 | 53.7394 | 68.3939 | |
Comparison of RNFL mean thickness and thickness in each sector. Values are expressed in microns. 95% confidence intervals for means±SD.
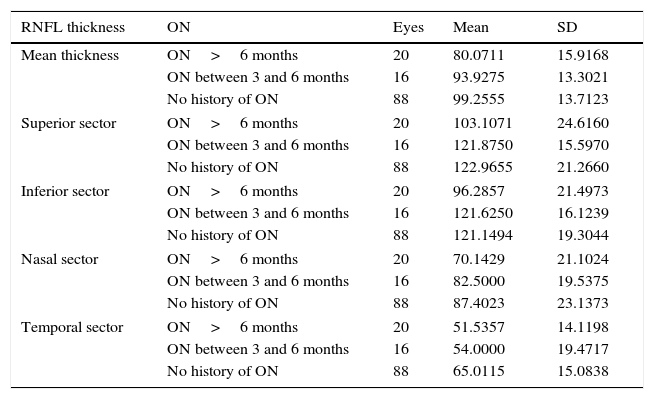
Table 8 shows mean thickness and thickness of each sector in the eyes both with and without a history of optic neuritis (eyes with optic neuritis are further classified by time elapsed since the episode of optic neuritis). Mean thickness was greater in the patients with no optic neuritis than in those with a history of the disorder (onset between 3 and 6 months or more than 6 months previously). Differences between these groups were statistically significant (P<.01) for mean thickness and thickness in the 4 peripapillary sectors.
RNFL thickness in patients with and without optic neuritis.
| RNFL thickness | ON | Eyes | Mean | SD |
|---|---|---|---|---|
| Mean thickness | ON>6 months | 20 | 80.0711 | 15.9168 |
| ON between 3 and 6 months | 16 | 93.9275 | 13.3021 | |
| No history of ON | 88 | 99.2555 | 13.7123 | |
| Superior sector | ON>6 months | 20 | 103.1071 | 24.6160 |
| ON between 3 and 6 months | 16 | 121.8750 | 15.5970 | |
| No history of ON | 88 | 122.9655 | 21.2660 | |
| Inferior sector | ON>6 months | 20 | 96.2857 | 21.4973 |
| ON between 3 and 6 months | 16 | 121.6250 | 16.1239 | |
| No history of ON | 88 | 121.1494 | 19.3044 | |
| Nasal sector | ON>6 months | 20 | 70.1429 | 21.1024 |
| ON between 3 and 6 months | 16 | 82.5000 | 19.5375 | |
| No history of ON | 88 | 87.4023 | 23.1373 | |
| Temporal sector | ON>6 months | 20 | 51.5357 | 14.1198 |
| ON between 3 and 6 months | 16 | 54.0000 | 19.4717 | |
| No history of ON | 88 | 65.0115 | 15.0838 | |
Comparison of mean thickness and thickness in each sector of the RNFL. Values are expressed in microns. Mean±SD.
ON, optic neuritis.
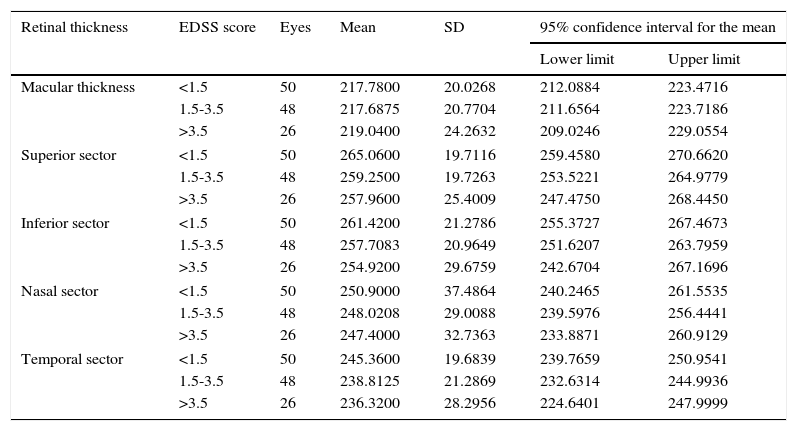
We found no significant differences between EDSS levels in terms of mean macular thickness in either the 1000-μm-diameter area or the sectors of the 3000-μm-diameter area (Table 9).
Retinal thickness in the central 1000- and 3000-μm-diameter areas by EDSS level.
| Retinal thickness | EDSS score | Eyes | Mean | SD | 95% confidence interval for the mean | |
|---|---|---|---|---|---|---|
| Lower limit | Upper limit | |||||
| Macular thickness | <1.5 | 50 | 217.7800 | 20.0268 | 212.0884 | 223.4716 |
| 1.5-3.5 | 48 | 217.6875 | 20.7704 | 211.6564 | 223.7186 | |
| >3.5 | 26 | 219.0400 | 24.2632 | 209.0246 | 229.0554 | |
| Superior sector | <1.5 | 50 | 265.0600 | 19.7116 | 259.4580 | 270.6620 |
| 1.5-3.5 | 48 | 259.2500 | 19.7263 | 253.5221 | 264.9779 | |
| >3.5 | 26 | 257.9600 | 25.4009 | 247.4750 | 268.4450 | |
| Inferior sector | <1.5 | 50 | 261.4200 | 21.2786 | 255.3727 | 267.4673 |
| 1.5-3.5 | 48 | 257.7083 | 20.9649 | 251.6207 | 263.7959 | |
| >3.5 | 26 | 254.9200 | 29.6759 | 242.6704 | 267.1696 | |
| Nasal sector | <1.5 | 50 | 250.9000 | 37.4864 | 240.2465 | 261.5535 |
| 1.5-3.5 | 48 | 248.0208 | 29.0088 | 239.5976 | 256.4441 | |
| >3.5 | 26 | 247.4000 | 32.7363 | 233.8871 | 260.9129 | |
| Temporal sector | <1.5 | 50 | 245.3600 | 19.6839 | 239.7659 | 250.9541 |
| 1.5-3.5 | 48 | 238.8125 | 21.2869 | 232.6314 | 244.9936 | |
| >3.5 | 26 | 236.3200 | 28.2956 | 224.6401 | 247.9999 | |
Macular thickness: retinal thickness in the central 1000-μm diameter area. Superior, inferior, nasal, and temporal sectors: thickness in the 3000-μm-diameter area. Comparison of RNFL mean thickness and thickness in each sector. Values are expressed in microns. 95% confidence intervals for means±SD.
EDSS, expanded disability status scale.
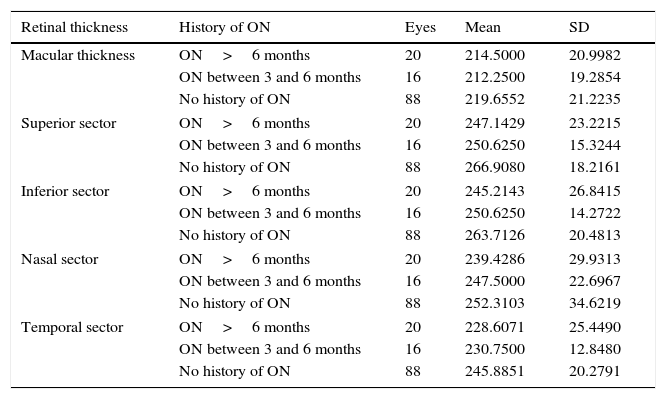
When comparing quantitative values of macular thickness in the sectors of the 3000-μm-diameter area between patients without optic neuritis and those with a history of optic neuritis (between 3 and 6 months, or more than 6 months) (Table 10), differences were found to be statistically significant in the superior, temporal, and inferior sectors (P<.01).
Retinal thickness in the central 1000- and 3000-μm-diameter areas in patients with and without optic neuritis.
| Retinal thickness | History of ON | Eyes | Mean | SD |
|---|---|---|---|---|
| Macular thickness | ON>6 months | 20 | 214.5000 | 20.9982 |
| ON between 3 and 6 months | 16 | 212.2500 | 19.2854 | |
| No history of ON | 88 | 219.6552 | 21.2235 | |
| Superior sector | ON>6 months | 20 | 247.1429 | 23.2215 |
| ON between 3 and 6 months | 16 | 250.6250 | 15.3244 | |
| No history of ON | 88 | 266.9080 | 18.2161 | |
| Inferior sector | ON>6 months | 20 | 245.2143 | 26.8415 |
| ON between 3 and 6 months | 16 | 250.6250 | 14.2722 | |
| No history of ON | 88 | 263.7126 | 20.4813 | |
| Nasal sector | ON>6 months | 20 | 239.4286 | 29.9313 |
| ON between 3 and 6 months | 16 | 247.5000 | 22.6967 | |
| No history of ON | 88 | 252.3103 | 34.6219 | |
| Temporal sector | ON>6 months | 20 | 228.6071 | 25.4490 |
| ON between 3 and 6 months | 16 | 230.7500 | 12.8480 | |
| No history of ON | 88 | 245.8851 | 20.2791 | |
Macular thickness: thickness in the central 1000-μm-diameter area. Superior, inferior, nasal, and temporal sectors: thickness in the 3000-μm-diameter area. Comparison of RNFL mean thickness and thickness in each sector. Values are expressed in microns. Mean±SD.
ON, optic neuritis.
Our study analysed RNFL thickness using time-domain optical coherence tomography. RNFL thickness measurements obtained with this tool are strongly correlated with the values obtained with spectral-domain optical coherence tomography; however, the results from these 2 techniques are not interchangeable.16
Our results show a statistically significant decrease in mean RNFL thickness in patients with MS compared to controls. These differences were also statistically significant in the temporal and inferior sectors. However, if we exclude the patients with a history of optic neuritis, differences were significant only in the temporal sector. Pueyo et al.3 and Bock et al.11 described a decrease in thickness in the temporal sector exclusively.
Gundogan et al.17 compared a series of patients with MS with no visual symptoms and a control group without MS, and found a statistically significant reduction in thickness in the temporal sector.
According to Costello et al.,18 the temporal sector is more sensitive to retinal axonal damage in patients with MS. In this study, decreases in mean thickness manifested 2 months after the episode of optic neuritis, whereas decreases in thickness in the superior and inferior sectors manifested after 3 or 4 months. Decreases in RNFL thickness during progression of MS were independent of immunomodulatory therapy.10
In our sample, 85.4% of the patients (53/62) had relapsing-remitting MS and 14.6% (9/62) had secondary-progressive MS. These percentages are similar to those reported by Fisher et al.2 (80% vs 20%) and Iester et al.19 (78.2% vs 21.8%) in their studies of RNFL thickness in patients with MS.
We found differences in mean thickness and thickness in each sector between the patients with secondary-progressive and relapsing-remitting MS both before and after excluding the patients with a history of optic neuritis. Although these differences were not statistically significant, our findings suggest that RNFL thickness is lower in patients with secondary-progressive MS than in those with relapsing-remitting MS.
Oberwahrenbrock et al.20 and Albrecht et al.13 reported differences in RNFL thickness between these 2 clinical forms of MS. Pulicken et al.,21 however, found no statistically significant differences in thickness between these 2 groups.
Henderson et al.22 analysed the differences in RNFL thickness in patients with MS. According to this study, the patients with secondary-progressive MS and no history of optic neuritis showed a significant decrease in thickness compared to controls.
The discrepancies between these results and our own may be due to the heterogeneity of the series, the differences in the number of patients included in each subgroup, and the lack of a model for estimating thickness according to age, sex, and disease duration.
Mean RNFL thickness in patients with MS decreases with disease severity. These decreases are statistically significant in the superior, inferior, and temporal sectors.
In the study by Fisher et al.,2 thickness decreased as EDSS scores increased, which suggests a direct relationship between the degree of optic nerve axonal loss and the level of neurological impairment.
The comparative analysis of RNFL thickness between the eyes with and without optic neuritis showed significant differences in terms of mean thickness and thickness in all the peripapillary sectors. García-Martín et al.23 found more pronounced axonal loss in the eyes with a history of optic neuritis. Optic neuritis episodes in patients with MS cause axonal degeneration during the acute phase. After 6 months, however, RNFL atrophy is associated with MS progression regardless of the history of optic neuritis.
Regarding macular thickness in 1000- and 3000-μm-diameter areas, we found no significant differences between EDSS levels. However, we did find significant differences in macular thickness in the temporal, superior, and inferior sectors of the 3000-μm-diameter area between the patients with a history of optic neuritis and those without. The patients with a history of optic neuritis had greater thickness in those sectors than the patients without optic neuritis.
In our study, we measured thickness in the central 1000-μm-diameter area since it has a higher ratio of bipolar cells to ganglion cells, which led us to hypothesise that there may be a connection between RNFL thickness and retinal thickness. However, the differences between groups were not statistically significant.
Burkholder et al.24 studied RNFL thickness and macular volume in a series of patients with MS and no history of optic neuritis and found statistically significant differences in both parameters between patients with MS and controls.
In summary, mean RNFL thickness decreases as EDSS scores increase. Patients with a history of optic neuritis usually show a more marked axonal loss; this decrease in thickness has been shown to depend on the time elapsed from the last episode of optic neuritis. In contrast, we found no connection between macular thickness within the central 1000- and 3000-μm-diameter areas and EDSS scores.
Conflicts of interestThe authors have no conflicts of interest to declare.
Please cite this article as: Soler García A, Padilla Parrado F, Figueroa-Ortiz LC, González Gómez A, García-Ben A, García-Ben E, et al. Análisis del grosor macular y de capa de fibras nerviosas en pacientes con escle rosis múltiple en relación con su nivel de gravedad y antecedentes previos de neuritis óptica. Neurología. 2016;31:379–388.
