


Due to the unbalanced and inadequate development of fintech among various provincial regions, this paper proposes a novel sparse quantile model to explore the heterogeneous impacts of fintech on green total factor productivity (GTFP) in the provinces of China based on the annual data from 2011 to 2020. Quantile estimators of the proposed method are used as empirical “location” measures for the heterogeneous influence of fintech on GTFP. Two nonparallel twin functions at each quantile level capture the unbalanced information between fintech and GTFP. The empirical results show that fintech effectively promotes the quality of economic growth in every province, while the effects of fintech on GTFP are heterogeneous and unbalanced. Specifically, the effects in high-green-development regions are more powerful than those in low-green-development regions. Moreover, the influencing strength of fintech on GTFP among provincial regions has become weaker in recent years. The impact mechanism test indicates that fintech mainly promotes GTFP through the upgrading of industrial structure. Based on these results, this paper discusses some policy recommendations, such as optimizing the allocation of financial technology resources, improving the quality of innovation, promoting the upgrading of industrial structure, and strengthening foreign exchange and cooperation for the sustainable development.
Sustainable development has taken resource utilization and environmental protection as important development constraints of economic growth (Zhang et al., 2021). Sustainable development goals are achieved through boosting economic growth by improving resource utilization efficiency and reducing environmental damage (Lin & Benjamin, 2017; Yuan & Zhang, 2020; Shahzad et al., 2022). To reflect economic growth under the goal of sustainable development (Zhang, 2021), green total factor productivity (GTFP) comprehensively considers resource utilization and environmental protection as well as the input constraints of traditional economic growth (Liu & Xin, 2019; Debbarma et al., 2022). Thus, GTFP has become an effective indicator to measure the level of economic sustainable development. China's current economy is transforming from a stage of high-speed growth to a stage of high-quality development, which aims to move from an input-driven economy to an innovation-driven one with the promotion of GTFP (Ji & Zhang, 2019; Lu et al., 2020; Liu et al., 2021).
Technology innovation, as a branch of technological progress (Zhang et al., 2021), has become an important force in promoting GTFP (Du & Liu, 2019; D'Attoma et al., 2020; Wang et al., 2021b). Financial technology (fintech), as technology-driven financial innovation, has become prominent in global financial markets (Cheng & Qu, 2020). Financial technologies of digitization in China such as payment systems, online insurance, and wealth management have developed much more rapidly than those in other countries (Chen, 2016). The development of fintech in China can be divided into three stages: the financial IT stage (before 2010), the internet finance stage (2011-2015), and the third stage (after 2015). The third stage is the combination of finance and emerging data technologies, such as artificial intelligence, blockchain, cloud computing, and big data (Cheng & Qu, 2020; Sun et al., 2022). These emerging data technologies have deeply integrated with financial business and subsequently promoted the vigorous development of fintech. However, China's regional fintech development is unbalanced and inadequate (Zhao et al., 2023).
The booming development of fintech in China has drawn considerable attention from academics (Cheng & Qu, 2020; Lee et al., 2021; Kong & Loubere, 2021; Bu et al., 2021), who have mainly focused on the impact of technological progress on green economic growth (Du & Li, 2019; Wang et al., 2021b; Luo et al., 2022; Zhou et al., 2022). Little academic literature has been devoted to the effect of fintech on GTFP and the heterogeneity of such effects across provincial regions. Hence, we obtain the following research questions to meet the need of green economic development in China. First, does fintech play a positive role in GTFP among the Chinese provinces? Second, is there regional heterogeneity in the impact of financial technology on GTFP? Third, what is the impact mechanism of fintech on GTFP among the Chinese provinces?
To seek answers to these research questions, this paper explores the impact of fintech on GTFP among Chinese provinces. We first use the SBM-DDF model to construct a Malmquist-Luenberger index (ML) (Fukuyama & Weber, 2009) to measure the level of GTFP. Due to the imbalance in fintech among provincial regions in China (Ye et al., 2022a; Luo et al., 2022), we propose a novel sparse twin support vector quantile regression to examine the heterogeneous and unbalanced impact of fintech on GTFP at different quantile levels. To seek the answer of the third research question, we test the influence mechanism of fintech on GTFP through the channel of upgrading of industrial structure.
The proposed sparse twin support vector quantile regression (STSVQR), as a branch of the powerful machine learning tools of support vector machines (Cortes & Vapnik, 1995), is quite suitable for solving the second research question. The main reasons are as follows. First, STSVQR adopts a quantile parameter to reflect the heterogeneous information between fintech and GTFP, maintaining the advantage of quantile regression (Koenker, 1978). As the quantile parameter increases, the estimated regression curves of STSVQR move up corresponding to various percentage points of the distributions. STSVQR uses a quantile parameter to obtain a family of regression curves and thus reflects the heterogeneous information between fintech and GTFP. Second, STSVQR generates two nonparallel twin functions at each quantile level to determine the ε−insensitive lower and upper bounds for capturing the unbalanced information between fintech and GTFP. Therefore, STSVQR simultaneously captures the heterogeneous and unbalanced information between fintech and GTFP among China's provinces. Third, the proposed model has an inherent variable selection ability due to theL1−norm regularization term, which can effectively select the representative variables among the independent variables for GTFP (Ye et al., 2022a).
The contributions of this paper mainly include the following aspects. (1) A novel quantile regression approach is proposed to address the heterogeneous and unbalanced impact of financial technology on GTFP among China's provinces, where quantile estimators are adopted as empirical “location” measures for GTFP. (2) The proposed sparse twin support vector quantile regression effectively solves the main influencing factor selection problem since the L1-norm regularization term has an inherent variable selection ability. (3) We examine whether the rationalization of industrial structure and advanced industrial structure play an intermediary role in the process of fintech promoting GTFP among the Chinese provinces.
The rest of the paper is organized as follows. In Section 2, a review of the research on fintech and GTFP is presented. Section 3 proposes a novel quantile regression method to cope with the heterogeneity in the impact of fintech on GTFP among various provincial regions. Section 4 describes data sources and variables. Section 5 examines the heterogeneous impact and mechanism of fintech on GTFP. Section 6 concludes this paper and gives corresponding suggestions for future research.
Literature reviewMeasurement of financial technologyThe Financial Stability Board (FSB) defines fintech as technologically enabled financial innovation (FSB, 2016). Leong and Sung (2018) referred to fintech as the combination of finance, technology and innovation. Thakor (2020) claimed that fintech is the use of technology to provide new financial services. Wójcik (2021) regarded fintech as the application of emerging digital technology innovation to financial services. Although there is no standard definition of fintech, it is evident that fintech plays a significant role in the financial field. A financial technology index has been constructed to measure the level of fintech development in China. Cheng and Qu (2020) constructed a bank fintech index to measure fintech development in the banking industry. Lee et al. (2021) and Wang et al. (2021a) focused on the technology dimension and employed principal component analysis to construct a fintech index. Deng et al. (2021) directly used the digital inclusive financial index to measure the development level of fintech, which was constructed by the Peking University Digital Finance Research Center. To reflect the development level of fintech more broadly and detail, Ye et al. (2022a) used web crawler technology and word frequency analysis to collect new variables and then used the geometric mean approach to construct a fintech index composed of the depth of digital finance usage, the level of digitization, and the level of technology innovation. It can be illustrated that there is no standard fintech index in China. Some academic literature emphasizes the financial service dimension, while others emphasize on the technology dimension. This paper first adopts the fintech definition given by Leong and Sung (2018) and accordingly use the fintech index to measure the development level of fintech (Ye et al., 2022a).
Measurement of green total factor productivityTotal factor productivity (TFP) is a traditional tool for measuring economic sustainability. TFP only takes labour and capital as inputs and desirable outputs into consideration, ignoring resource inputs and undesired outputs (e.g. sewage, SO2, and solid waste). To overcome the disadvantages of TFP, increasing number of scholars have incorporated resource inputs and environmental impacts into the TFP framework and proposed various models to measure GTFP. Pittman (1983) used data envelopment analysis (DEA) to refer to undesirable output for the first time. Regarding energy and pollution emissions as inputs, Chung (1997) formed a directional distance function (DDF) and proposed a Malmquist-Luenberger index, which is more authentic and effective in measuring the development level of GTFP. Subsequently, some scholars applied this method to measure GTFP (Chen & Golley, 2014; Li & Lin, 2017). However, the DDF as a radial model neglects slack variables which tends to overestimate the efficiency score (Zhang & Choi, 2014). Tone (2001) proposed a slack-based measure (SBM) of efficiency in DEA. Fukuyama and Weber (2009) formulated a more general SBM directional distance function that follows the nonradial and nonoriented basis (Tone, 2001). Combining radial and non-radial models, Tone and Tsutsui (2010) proposed “epsilon-based” measure (EBM). Since the production frontier cannot be compared horizontally, Oh (2010) proposed the Global Malmquist-Luenberger (GML) index. To measure the development level of GTFP among China's provincial regions, this paper uses the SBM-DDF model to construct the global Malmquist-Luenberger index (Fukuyama & Weber, 2009; Oh, 2010; Liu & Xin, 2019; Zhao et al., 2022).
Technological progress and green productivityThe literature has widely examined the impact of technological progress on green productivity. Cheng et al. (2018), for example, explored the impact of technological progress on total-factor carbon productivity and showed that technical progress has played a major role in promoting the economy and the environment. Du and Li (2019) focused on the heterogeneous effects of green technology innovations on total-factor carbon productivity among 71 economies worldwide and found that green technology innovations contribute to promoting total-factor carbon productivity in economies with high income while having an insignificant effect for other less developed economies. Yuan and Zhang (2020) explored the institutional scenario that drives sustainable development of Chinese industry, and found that technological innovation significantly and positively impacts industrial sustainable development. Wang et al. ( 2021b) adopted a spatial Durbin model to test the effect of green technology innovation on GTFP from a regional perspective, and their empirical results indicate that green technology innovations in the eastern and central regions have negative effects on GTFP while having positive effects in the western region. Zhou et al. (2022) tested the impact of fintech on green growth for China's provincial panel data and found that fintech innovation mainly promotes green economic growth by improving the development level of green finance. Chen et al. (2023) examined the impact of green technology innovation on GTFP, and found that technological innovation contributes significantly to green production.
It can be seen that these academic studies have focused on the impact of technological progress on green economic growth, indicating that technological progress has been regarded as a positive factor affecting green productivity. Although the fintech industry has rapidly developed in China (Kong & Loubere, 2021), little literature has been devoted to the heterogeneous and unbalanced effect of fintech on GTFP across provincial regions. Thus, this paper fills the above knowledge gaps by proposing a novel sparse twin support vector quantile regression model to explore the heterogeneous and unbalanced effect of fintech on GTFP.
MethodologyGML index based on the SBM direction distance functionSuppose we are given k decision-making units (DMUs) at time t, and each DMU uses an N-vector of inputs x¯=(x1¯,…,xN¯)∈RN+ to produce an M-vector of desirable outputs y¯=(y1¯,…,yM¯)∈RM+ and I-vector of undesirable outputs b¯=(b1¯,…,bI¯)∈RI+. Input-output factors are supposed to be nonzero. (xkt¯,ykt¯,bkt¯)is the input-output of the k-th (k=1,…,K) province at time t(t=1,…,T). The production possibility set is defined as follows:
where βkt¯ denotes the weight of each cross-sectional observation. Suppose the weight sum is 1, where the weight constraint is nonnegative, indicating that the production conditions are based on constant return to scale. Following Fukuyama and Weber (2009), the directional distance is:where (xt,k′¯,yt,k′¯,bt,k′¯) represents the input-output vector of k' in provincial areas, (gx¯,gy¯,gb¯) represents the direction vector of input-output, and (snx¯,smy¯,sib¯) represents the relaxation vector of input-output. Then, the global Malmquist-Luenberger (GML) index is established as follows (Oh, 2010):


GML represents the growth rate of GTFP relative to the former period. When GMLtt+1>1, the GTFP in this province increases from period t to t +1. When GMLtt+1<1, the GTFP in this province decreases from period t to t+1. When GMLtt+1=1, the GTFP in this province does not change from period t to t+1. Then, GTFP can be calculated as:
Sparse twin support vector quantile regression
To address the heterogeneity and imbalance of fintech and GTFP among provincial regions in China, we propose a novel sparse twin support vector quantile regression to examine how fintech affects GTFP in China using a provincial data set covering 2011 to 2020. Suppose Y is a dependent variable, X is a matrix including independent variables, and β is an unknown parameter vector. Consider the following linear regression function:
where μ is the random error. To effectively estimate β0 and β, we propose the following minimization problems of sparse twin support vector quantile regression:andwhere ∥·∥2 represents the L2-norm, ∥·∥1 represents the L1-norm, ξ and ξ* are slack variables, ε1 and ε2are insensitive parameters, C1 and C2 are tuning parameters determining the trade-off between the regularization term and empirical risk, and τ(0<τ<1)is the quantile parameter. The parameters in the final regression function can be estimated asβ0=0.5(β01+β02) and β=0.5(β1+β2). A convergent successive linear algorithm (SLA) can be adopted to solve the proposed model (Ye et al., 2017).


It can be seen that the sparse twin support vector quantile regression uses the quantile parameter τ to depict the heterogeneous information of the distribution of samples, maintaining the spirit of quantile regression (Koenker, 1978). As the quantile parameter increases, the estimated regression function moves up through the samples, providing multiple trends of the distribution of the samples, with the aim of capturing the disparity caused by heterogeneity. Thus, sparse twin support vector quantile regression offers a more complete picture of the distribution information than ordinary least squares (OLS) regression (Dempster, 1977). The main reason is that least squares regression as a conditional mean model only reflects the mean trend of the conditional distribution of samples, while sparse twin support vector quantile regression uses a quantile parameter to estimate the relationships between variables for all portions of a probability distribution. Moreover, sparse twin support vector quantile regression also maintains the spirit of twin support vector regression (Peng, 2010; Shao et al., 2013), which generates two nonparallel functions to determine the lower and upper bounds for capturing the unbalanced information in data points. The sparse twin support vector quantile regression thus effectively captures the heterogeneous and unbalanced information in data points simultaneously. Furthermore, the proposed support vector quantile regression has an inherent variable selection ability for the sparseness property of theL1−norm regularization term. The L1−norm regularization term in the proposed model shrinks some coefficients of an estimator toward 0, and some coefficients are shrunk exact 0 (Ye et al., 2022b). Therefore, the sparse twin support vector quantile regression discards some redundant factors and retains the important influence factors of GTFP selected.
Data sources and variablesData sources and variablesConsidering the availability of provincial data, this paper uses the cross-sectional data of 31 provinces in China from 2011 to 2020. Our explanatory variables include: fintech, measured by the fintech index coming from Ye et al. (2022a); labor, measured by the ratio of employment to the population; capital, measured by the share of fixed asset investment in GDP; education, measured by the ratio of education expenditure to GDP; development, measured by log per capita GDP; foreign direct investment (FDI), measured by the ratio of FDI to GDP; and government, measured by public budget expenditure to GDP. The data of all these variables are collected from China's National Bureau of Statistics, China Energy Statistical Yearbook, and China Statistical Yearbook of Environment. Some missing data are supplemented by the interpolation method.
Financial technology indexTo measure the development level of fintech in China's provincial regions, we adopt the fintech index, which is composed of the depth of digital finance usage, the level of digitization, and the level of technology innovation (Ye et al., 2022a). The depth of digital finance usage measures the actual use of internet financial services, including payment services, insurance services, monetary fund services, investment services, credit services, and credit investigation services (Guo et al., 2020). The level of digitization is composed of mobility, affordability, credit level, and facilitation (Guo et al., 2020). The level of technology innovation encompasses artificial intelligence, distributed technology, and internet technology (Ye et al., 2022a). The specifications of detailed variables and fintech-related keywords can be found in Table 1 in Ye et al. (2022a).
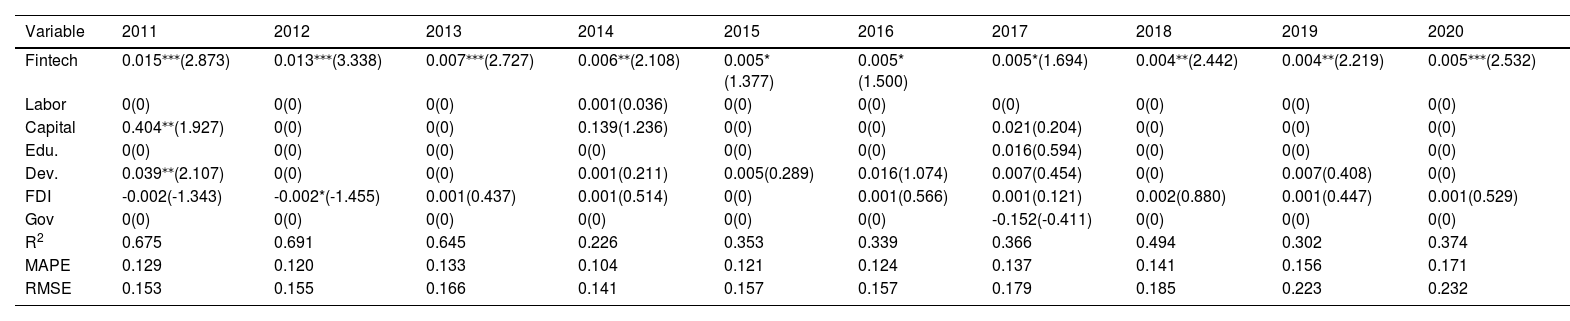
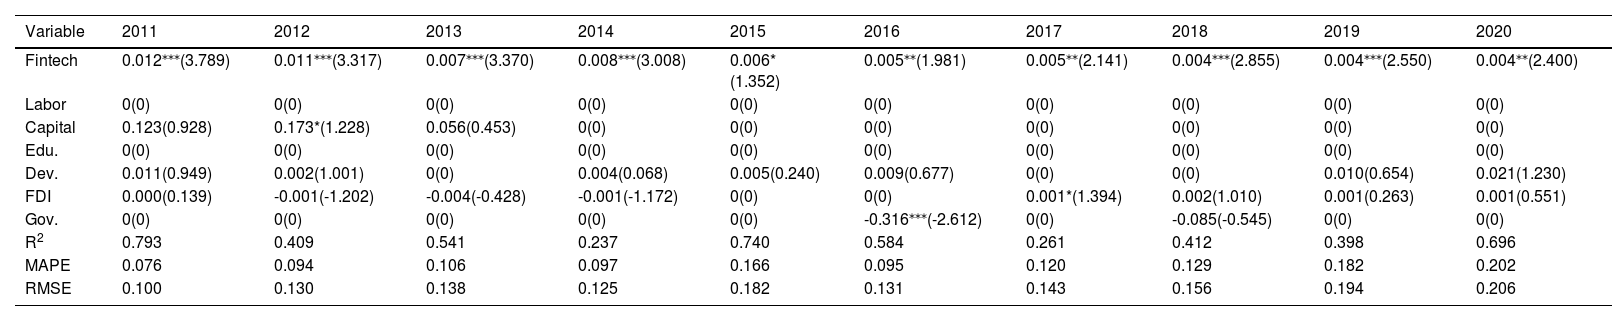
Regression results at 0.25th quantile level.
*, **, and *** indicate significance at the 0.10, 0.05, and 0.01 levels, respectively.
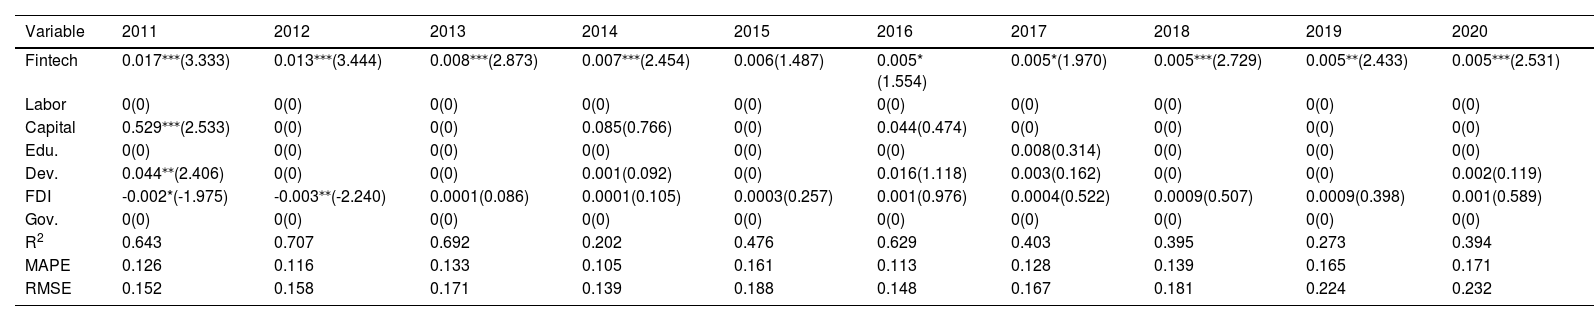
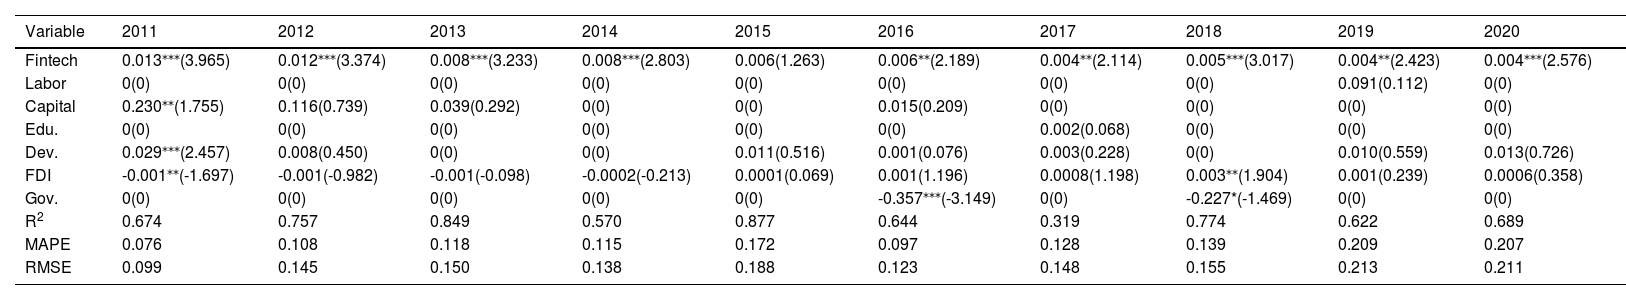
Regression results at 0.50th quantile level.
*, **, and *** indicate significance at the 0.10, 0.05, and 0.01 levels, respectively.
We use ArcGIS10.2 software to draw the fintech index spatial distribution of 2011, 2015, 2020 and the average level in each province of China, as shown in Fig.1. There are obvious spatial differences in fintech among provinces in China, and fintech in eastern China is relatively higher than that in central China and western China. The fintech of some provinces changed over time, resulting in their rank. The differences of average fintech in Fig.1 (d) reflect the unbalanced regional development. We further adopt the K-means clustering algorithm (Hartigan & Wong, 1979) to divide China's provincial fintech index into 3 clusters (excluding Hong Kong, Macao, and Taiwan): high-development level, intermediate-development level, and low-development level. According to the cluster results, we use boxplots to demonstrate the development level of fintech among provincial regions in China, as shown in Figs. 2-4. Form Fig. 2, we find that the development level of fintech in Beijing, Zhejiang, and Shanghai is very high, and their level is approximately 200. The intermediate-development level of fintech is shown in Fig. 3, which includes 16 provinces, such as Tianjin, Hubei, and Anhui. From Fig. 3, we can see that the median level of fintech is approximately 170. The low-development regions of fintech include 12 provinces and their level of fintech is approximately 160, as shown in Fig. 4. Figs. 2-4 indicate a large gap and heterogeneity in fintech levels among China's provincial regions.

Spatial distribution of provincial fintech index in China.

Fintech index of the high-development region.

Fintech index of the intermediate-development region.

Fintech index of the low-development region.
We adopt SBM-DDF model to construct a Malmquist-Luenberger index (Fukuyama and Weber, 2009) to measure the GTFP of 31 provinces in China for the period from 2011 to 2020, using MaxDEA Utral 9 software. Input factors include employed people, fixed capital stock, energy consumption, real gross domestic product (GDP), carbon dioxide (CO2) emissions, and sulfur dioxide (SO2) emissions. ArcGIS software is also used to draw the GTFP spatial distribution of 2011, 2015, 2020 and the average level in each province of China, as shown in Fig. 5. Obviously, there are spatial differences in GTFP among provinces in China. GTFP in some provinces changed over time. This means that some provinces are transitioning from a stage of high-speed growth to a stage of high-quality development, aiming to move from an input-driven economy to an innovation-driven economy with the promotion of GTFP. Focusing on the average level of GTFP, we can see that GTFP in eastern China is relatively higher than that in central China and western China. The GTFP of Tibet and Xinjiang is lower than that of other provinces since the gross domestic product in Tibet and Xinjiang is lower than that in other provinces.

We also use the K-means clustering algorithm (Hartigan & Wong, 1979) to divide China's provincial GTFP into 3 clusters (excluding Hong Kong, Macao, and Taiwan): high-level GTFP, intermediate-level GTFP, and low-level GTFP. Based on the cluster results, we draw boxplots to demonstrate the GTFP level among China's provincial regions, as shown in Figs. 6-8. From Fig. 5, we can see that the GTFP level of Beijing and Chongqing is very high, and their level is approximately 1.3. The intermediate GTFP is shown in Fig. 7, which includes 25 provinces, such as Zhejiang, Guangdong, and Tianjin. From Fig. 7, we can see that the intermediate GTFP is approximately 1. As shown in Fig. 8, the low GTFP includes Tibet and Xinjiang. The GTFP in Tibet and Xinjiang is approximately 0.5, and 0.6, respectively. Figs. 6-8 indicate the heterogeneity in fintech level among China's provincial regions.
Empirical analysisMain results


We propose a sparse twin support vector quantile regression to examine the potentially heterogeneous and unbalanced impacts of fintech on GTFP. Define β=(β1,β2,⋯,β7)′and X=(Fintech,Labor,Capital,Education,Development,FDI,Govenment). The quantile parameter τ is chosen from the following cases: 0.25th quantile level, 0.50th quantile level, and 0.75th quantile level. Fig. 9 illustrates the dynamic regression coefficients of fintech when τ=0.25, 0.50, and 0.75. In Fig. 9, the blue regression coefficient curve with large values τ represents the results of high-level GTFP. The green regression coefficient curve represents the results of intermediate-level GTFP. The purple regression coefficient curve represents the results of low-level GTFP. From Fig. 9, we see that all coefficients of fintech at different quantile levels are positive, but their trends are decreasing. Moreover, different quantile levels of fintech with different impacts on GTFP indicate that the effects of fintech on GTFP across China's provincial regions are heterogeneous and unbalanced.

The findings obtained from Fig. 9 have several meaningful interpretations. First, the positive coefficients of fintech mean that fintech plays a major role in promoting the economy and environment in all provinces of China. Second, the impact of fintech on GTFP among provincial regions has decreased in recent years, indicating that the effects of fintech on GTFP have become weaker. Third, the values of coefficients with the same period become larger as τ increases, suggesting that the impact of fintech on GTFP in high-green-development regions is stronger than that in low-green-development provinces, which means that fintech in high-green-development provinces plays a more important role in promoting the economy and environment than that in low-green-development provinces.
The main reasons for the heterogeneous and unbalanced effects of fintech on GTFP across China's provincial regions are as follows. From the macro perspective, high financial technology can reduce transaction costs and information asymmetry, which may optimize the allocation of resources and improve the industrial structure and energy mix (Duan et al., 2022). From the micro perspective, high financial technology can reduce energy consumption and pollution emissions in the power industry. Moreover, the use of emerging financial technology requires a certain level of education. The boxplots of fintech level among provincial regions in Figs. 2-4 indicate that there is a large gap of fintech between provinces in China. Regions with high fintech level usually have a better industrial base, a higher level of green technology innovation, and strong ability to apply emerging green products (Zhao et al., 2022). In this context, high fintech can be more quickly transformed into a driving force for GTFP than in low-green-development provinces (Zhou et al., 2022).
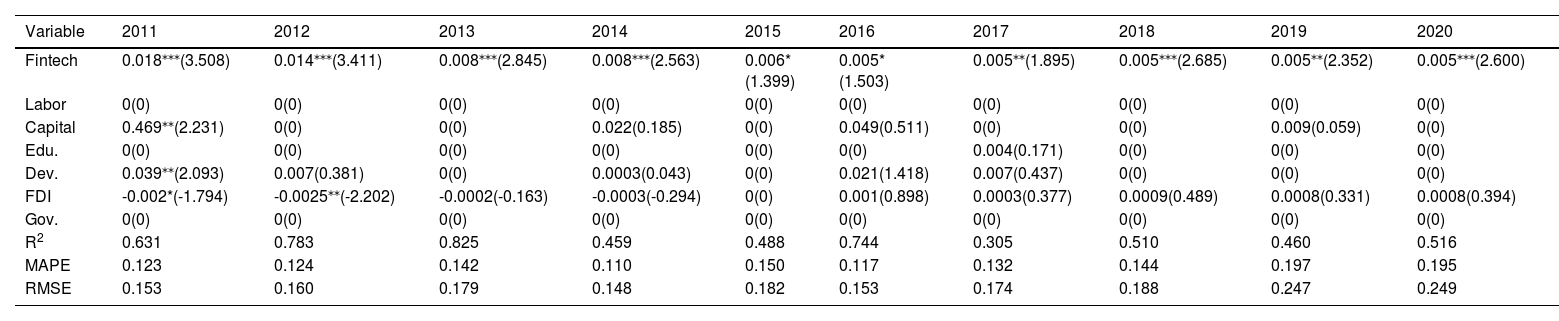
Tables 1-3 show the regression results at different quantile levels. The positive coefficients and t-statistic value of fintech indicate that fintech significantly promotes GTFP. Moreover, the coefficients and t-statistic value in Tables 1-3 also indicate that labor, capital, education, development, foreign direct investment, and government insignificantly impact on GTFP in most cases. Some coefficients in Tables 1-3 are exactly zero, which shows the sparseness of STSVQR. Tables 1-3 also list the regression results of R2 values, the mean absolute percentage error (MAPE), and the root mean square error (RMSE). It can be seen that STSVQR selects a few variables in every regression case with large R2 values and small MAPE and RMSE values, which indicates that the very few selected variables by STSVQR capture the useful statistical information from the samples.
Regression results at 0.75th quantile level.
*, **, and *** indicate significance at the 0.10, 0.05, and 0.01 levels, respectively.
To test the robustness of the above regression results, we change the input factors of GTFP, which include fixed capital stock, number of employment population, electricity consumption, real gross domestic product (GDP), chemical oxygen demand (COD) discharge, sulfur dioxide (SO2) emissions, and solid waste discharge. Then, we use the SBM-DDF model to construct the GML index to measure the level of GTFP.
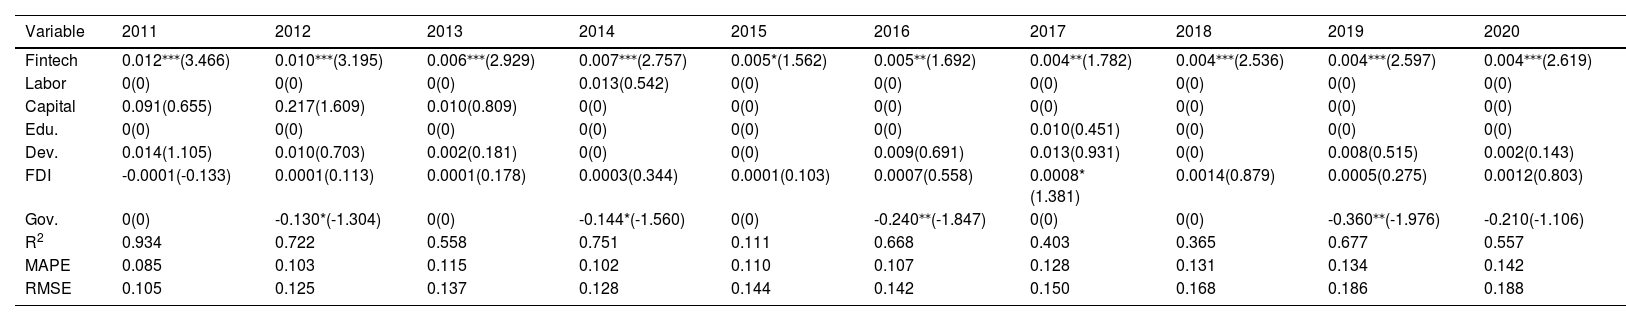
Fig. 10 illustrates the coefficients of fintech at the quantile of 0.25, 0.5, and 0.75. The upper curve represents the regression results at the 0.75th quantile level. The middle curve represents the regression results at the 0.50th quartile level. The low curve represents the regression results at the 0.25th quantile level. The estimated coefficient for the impact of fintech on GTFP increases with increasing quantiles. These results are in line with those in Fig. 9, which demonstrate that the impacts of fintech on GTFP are positive across China's provincial regions. The effect of fintech on GTFP is heterogeneous and unbalanced, and the effect in provinces with high GTFP is stronger than that in provinces with low GTFP. The decreasing trends of these three regression coefficient curves are consistent with those in Fig. 9, indicating that the effect of fintech on GTFP becomes weaker across all provinces in China. Tables 4-6 present the regression results at different quantile levels, which also illustrate the significant influences of fintech on GTFP. R2 and NMSE values also demonstrate the effectiveness and sparseness of the proposed model.

Robust test results at the 0.25 quantile level.
*, **, and ***indicate significance at the 0.10, 0.05, and 0.01 levels, respectively.
Robust test results at the 0.50 quantile level.
*, **, and *** indicate significance at the 0.10, 0.05, and 0.01 levels, respectively.
Robust test results at the 0.75 quantile level.
*, **, and *** indicate significance at the 0.10, 0.05, and 0.01 levels, respectively.
To test the impact mechanism of fintech on GTFP, this paper selects the industrial structure upgrading as the intermediary variable, which includes two dimensions: the rationalization of industrial structure (RIS) and the advancement of industrial structure (AIS) (Su & Fan, 2022; Hao et al., 2023). The former refers to whether the allocation of resources in different industries is coordinated, which is measured by Theil index (Wang et al., 2021c). The latter refers to the three industrial structures moving from the primary industry to the secondary and tertiary industries, which is measured by the ratio of output value of the tertiary industry to the secondary industry (Wang et al., 2019). The data of both variables are collected from China Statistical Yearbook.
We use the following models to analyze whether the transmission mechanism of intermediary variable exists:


In this influence mechanism test process, there exists the following cases:
- (1)
If β1,α1, and γ1 are significant and γ2is not significant, there will be no intermediary effect.
- (2)
If β1,α1,γ1, and γ2 are significant, there will be a partial intermediary effect.
- (3)
If β1,α1, and γ2are significant, and γ1 is not significant, there will be a complete mediation effect.
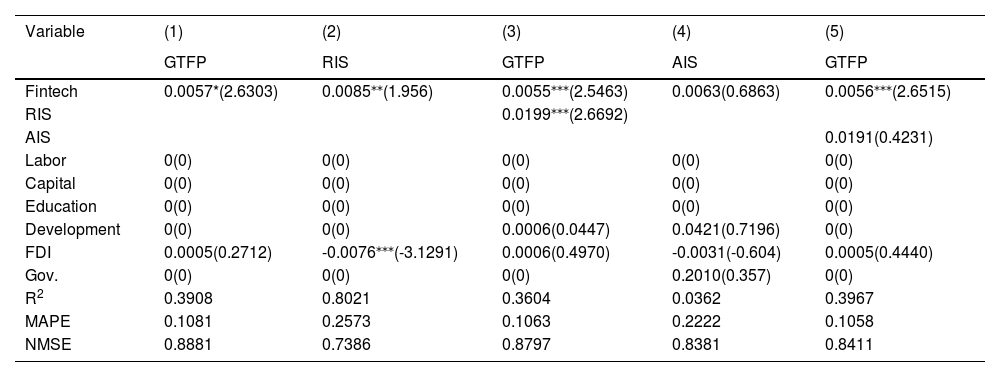
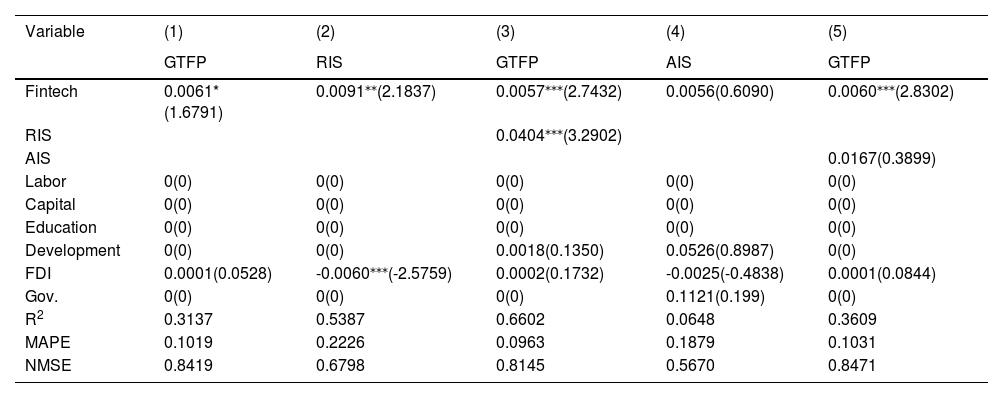
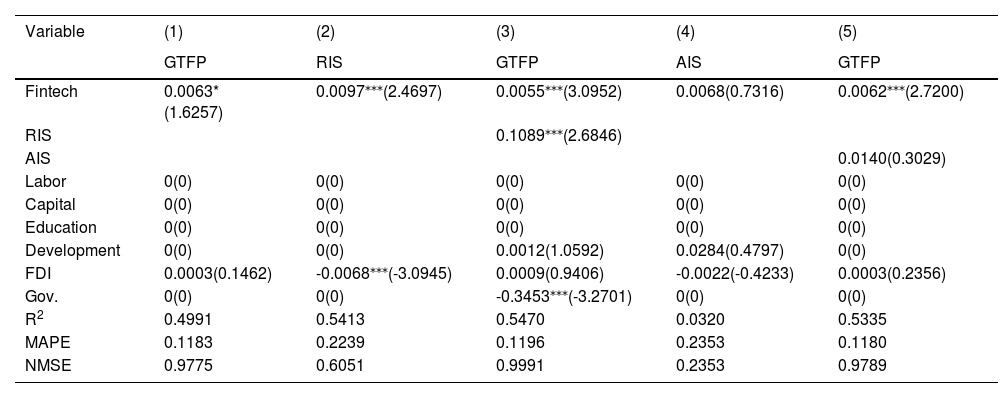
We adopt the proposed sparse twin support vector quantile regression to estimate the coefficients in functions (3) - (5) at the quantile of 0.25, 0.5, and 0.75, using area-average data over the period of 2011 to 2020. The mechanism test results are shown in Tables 7-9. Concerning the mediation effect of the rationalization of the industrial structure, we find that the regression coefficient of β1, α1, γ1, and γ2 of columns (1)-(3) in Tables 7-9 are significantly positive and pass the significance test, suggesting that a partial mediating effect exists in provinces with low, moderate, and high GTFP. This means that Fintech promotes GTFP development through the rationalization of the industrial structure in various regions. The regression coefficient α1 in column (2) of Tables 7-9 are 0.0085, 0.0091, and 0.0097, respectively, which means that the impact of fintech on RIS in high-green-development regions is stronger than that in low-green-development provinces. The level of fintech in high-green-development region is usually higher and advanced technologies are often firstly introduced, which results in the industrial structure upgrading. The regression coefficient γ2 in column (3) of Tables 7-9 are 0.0199, 0.0404, and 0.1089, respectively. It means that the mediation effect of RIS is greater in high-green-development region than that in low-green-development region. The high level of RIS effectively avoids having a certain industry with a strong effect on social development. That is, rationalizing the industrial structure can reduce the inhibitory effect of primary and secondary industries on GTFP (Su & Fan, 2022). Concerning the regression coefficients of α1 and γ2 in columns (4)-(5) of Tables 7-9, we find that they are positive but insignificant, suggesting no intermediary effect of the advancement of industrial structure in all provinces. Therefore, fintech promotes the industrial structure upgrading mainly through the rationalization of the industrial structure, which is of great significant for driving the improvement in green economy.
Mechanism test at the 0.25 quantile level.
Mechanism test at the 0.50 quantile level.
Mechanism test at the 0.75 quantile level.
Although the influencing factors of green total factor productivity (GTFP) have attracted attention from academics, little academic literature has been devoted to addressing the heterogeneous and unbalanced effect of financial technology (fintech) on GTFP among the Chinese provinces. This paper explored the impacts of financial technology on green total factor productivity in China's 31 provincial regions. We constructed a GML index to evaluate the development level of GTFP. Due to the presence of imbalance of fintech among provincial regions in China, we proposed a novel sparse twin support vector quantile regression to explore whether fintech across provinces influences GTFP heterogeneously. On the one hand, the proposed model adopts a quantile parameter to reflect the heterogeneous information between fintech and GTFP. On the other hand, the proposed model uses two nonparallel twin functions at each quantile level to capture the unbalanced information between fintech and GTFP.
The regression results showed that fintech is a driver that promotes the development of GTFP in every province in China, while the impacts of fintech on GTFP have obvious regional heterogeneity and imbalance. Specifically, the impacts of fintech on GTFP have been more powerful in high-GTFP regions than in intermediate- and low-GTFP provinces. Moreover, all coefficients of fintech at different quantile levels have decreased as time has passed, demonstrating that the driving force of fintech on GTFP has become weaker across all provinces in recent years. The mechanism test results showed that fintech significantly promotes the rationalization of the industrial structure, and the rationalization of the industrial structure further significantly improves the GTFP level, which implies that the rationalization of the industrial structure has a partial mediating effect in the process. Moreover, the partial mediating effect in high-GTFP regions is stronger than that in intermediate- and low- GTFP regions.
Policy recommendationsThe above analysis results are used as a basis to explore policy recommendations to promote GTFP. The main policy recommendations are described as follows.
- (1)
Due to the large gap in fintech levels between provinces in China, policy-makers and practitioners should increase investment in digital technology industries to strengthen the construction of information systems, improving digital services to narrow the large gap between regions. The effect of fintech on GTFP in low-development regions, such as Tibet and Xinjiang, is weaker than that in eastern regions. It is necessary to guide the flow and diffusion of emerging financial green products to the western regions and optimize the allocation of financial technology resources. The application ability of financial technology should also be improved in western regions.
- (2)
It is urgent to actively promote the financial technology innovations since the driving force of fintech on GTFP has become weaker across all provinces in recent years, requiring the cultivation of high-level scientific research talent in various fields, such as digital economy, finance, and the environment. Therefore, the Chinese government should pay attention to the improvement of quality of research level since the key to the quality and level of scientific research results lies in high-level researchers (Cao, 2020). The government should keep the balance between the growth rate of R&D personnel and scientific research fund investment, and improve the competitive mechanism and supervision mechanism for scientific research funds to support the high quality scientific research.
- (3)
The mechanism test results indicate that Fintech promotes GTFP development through the industrial structure upgrading in various regions. The intermediary effect of the rationalization of the industrial structure on GTFP is significant, while the intermediary effect of the advancement of industrial structure on GTFP is insignificant. Therefore, the structure of the industry should be further optimized. The Chinese government should supervise pollution emissions in high-pollution areas and encourage improving technological progress, and encourage low pollution, low energy consumption, and high innovation areas to improve production efficiency. The government should strengthen the regulation and guidance of the high value-added and competitive service industry development (Wu & Liu, 2021), meeting the need for high-quality development.
- (4)
China promotes the sustainable development based on “win-win” cooperation, receiving attention from countries all over the world (Wang & Wang, 2021). Due to the unbalanced and inadequate development of China's regional fintech, the country should cooperate with other countries to promote the development of fintech, and fully realize its positive effect on GTFP. Meanwhile, China should actively help other developing countries to promote the financial technological innovation, encourage them to participate in the construction on “the Belt and Road”, and finally realize the sustainable development of the national economy.
This study has some limitations. First, to evaluate the development level of GTFP, the GML index in this paper only focuses on efficiency change. In fact, the GML index can be divided into an efficiency change index and a technical change index, which will be considered in future studies. Second, how to reasonably construct a fintech index to measure the level of financial technology should be discussed in future studies. Third, the proposed method can capture homogeneous and unbalanced information among provincial regions in China. However, the regression coefficients were estimated year by year, which can not reflect the dynamic effects of fintech on GTFP. The online twin support vector quantile regression method should be proposed in future studies. Finally, in addition to technological progress, there are other influencing mechanisms of fintech that affect GTFP, which need to be further explored.
This work is supported by the National Natural Science Foundation of China (Nos. 12101552 and 61603338), the Natural Science Foundation of Zhejiang Province (No. LY21F030013), the Philosophy and Social Sciences Leading Talent Training Project of Zhejiang Province (No. 21YJRC07-1YB).