


Current Economic Policy Uncertainty (EPU) indicators are highly correlated with macroeconomic growth. To better reveal the EPU perceived by each firm, a firm-level EPU index is constructed using a text mining method. Using data of Chinese A-share listed companies from 2011 to 2020, this study examines the impact of a firm's perception of EPU on corporate innovation efficiency, computed using Stochastic Frontier Analysis (SFA) with a time-varying decay model. The empirical results show that corporate innovation efficiency decreases with a firm's perception of EPU. Additionally, the impact of traditional EPU indicators on innovation efficiency becomes statistically insignificant after the macroeconomic variable is added, demonstrating the importance of introducing firm-specific perceptions of EPU. Moreover, this negative impact is attenuated for firms with higher board independence and lower board ownership, while State-Owned Enterprises (SOEs) are less impacted. Furthermore, the impact of a firm's perception of EPU on corporate innovation efficiency is more pronounced for high-tech firms and those without political connections. We propose the following policy implications: First, it is vital for governments to provide stable economic circumstances to maintain corporate innovation efficiency. Second, mixed ownership reform is crucial in China; the risk-taking of non-state-owned firms will be greatly improved; thus, the innovation efficiency of non-state-owned firms will improve.
Innovation is an important way to gain competitive advantage and maintain long-term growth (Solow, 1957;Arkolakis, Ramondo, Rodríguez-Clare & Yeaple, 2018) and plays a significant positive role in the improvement of country-level multifactor productivity (Égert, 2016). A growing number of studies have focused on the innovation-economic growth nexus at the global or national level (Hasan & Tucci, 2010; Namazi & Mohammadi, 2018; Segerstrom, 1991). Firms are the main body of innovation, and corporate innovation directly affects the value of enterprises and the economic growth of a region or country (Cruz-Cázares, Bayona-Sáez & García-Marco, 2013; Fitzgerald, Balsmeier, Fleming & Manso, 2021; Hirshleifer, Hsu & Li, 2018).
The determinants of corporate innovation have been extensively studied. The literature mainly focuses on two aspects: the firm and market levels. Firm-level characteristics that influence corporate innovation include managerial features (He & Hirshleifer, 2022; Sunder, Sunder & Zhang, 2017; Ting, Wang, Yang & Tuan, 2021; Yuan & Wen, 2018), financial analyses (Bellstam, Bhagat & Cookson, 2021; Goldman & Peress, 2016), institutional investors (Aghion, Van Reenen & Zingales, 2013; Brav, Jiang, Ma & Tian, 2018), stock market traders (Dong, Hirshleifer & Teoh, 2017), CDS market investors (Chang, Chen, Wang, Zhang & Zhang, 2019) and firm stakeholders (Chu, Tian & Wang, 2018; Flammer & Kacperczyk, 2016). Product Market Competition (PMC) can also affect firms’ incentives to corporate. Positive (Blundell, Griffith & Van Reenen, 1999; Geroski, 1990; Nickell, 1996), negative (Mansfield, 1968; Scherer, 1967), and nonlinear (Aghion, Bloom, Blundell, Griffith & Howitt, 2005) relationships between the two have all been confirmed.
The influence of uncertainty on corporate innovation has recently become a popular topic. The literature includes the effects of market uncertainty (Wang et al., 201 7), financial uncertainty (Beladi, Deng & Hu, 2021; Lartey, Danso & Owusu-Agyei, 2020), and oil price uncertainty (Amin & Aktas, 2022). In related research, the impact of policy uncertainty on corporate innovation is currently the focus of attention. Wen, Lee and Zhou (2022) empirically confirm that fiscal policy uncertainty negatively affects corporate innovation investments. Shen and Hou (2021) find that trade policy uncertainty is positively associated with corporate R&D inputs and patents.
One strand of literature examines the role of ((EPU) in corporate innovation. One view holds that an increase in EPU could decrease corporate innovation because of an increase in the option value of waiting to invest (Lou, Chen, Yin, Zhang & Yu, 2022; Xu, 2020). Another hypothesis is that an increase in EPU can induce an increase in corporate innovation. Bloom (2007) asserts that R&D may respond differently to uncertainty due to differences in the adjustment costs of investment in capital and knowledge stocks. He, Ma and Zhang (2020) propose that competition among companies may eventually lead to the option value of waiting to invest towards zero. Under a high EPU, all companies choose to increase their investments in innovation instead of waiting, which may be the final result of the game. There is heterogeneity in firms’ responses to changes in EPU. For instance, financially constrained firms are more affected (Xu, 2020), whereas firms with strong risk-taking abilities are less affected (Lou et al., 2022). If we assume that all firms are homogeneous and do not account for differences in individual firms' responses to changes in EPU, our estimates may be biased.
Market-and corporate micro-level factors have significant impacts on corporate innovation. A challenge in empirically studying the impact of EPU on corporate innovation is whether it can solve the endogeneity problem caused by the omission of variables in the model. For instance, variations in EPU would cause changes in the macro environment and further affect corporate innovation. Controlling the macroeconomic environment in the empirical model affects the empirical results. Furthermore, the EPU index widely used in the literature is only time-varying, whereas corporate innovation varies with individuals and over time. Such characteristics would make the model sensitive to the selection of the sample time, and the robustness of the model is questionable.
In this study, we calculate the index of a firm's perception of EPU based on text mining of annual reports of Chinese A-share listed companies. Traditional EPU indicators only measure EPU in the macroeconomy, which is highly related to macroeconomic growth and may not be fully perceived by firms, and different firms may have different perceptions. For example, in recent years, firms have experienced intense environmental regulations in China because of carbon emission reduction policies; thus, companies in highly polluting industries are greatly impacted, whereas those in low-polluting industries are not. A firm's perception of EPU measures and distinguishes the differences in the perceptions of EPU among different firms. This index considers both the macro-level EPU and micro-level differences among firms. Yu, Xiao and Li (2021a) also construct an index of the firm-level perception of uncertainty; their index focuses on uncertainty, which is a broad concept, whereas the word list they use is quite limited. We improve this index by focusing on economic policy using a more specific word list. As a result, with this improved index, a firm's heterogeneity in terms of perceived economic policy uncertainty can be considered which is limited by the EPU index of Baker, Bloom and Davis (2016). Moreover, Yu et al. (2021a) studied the impact of the firm-level perception of uncertainty on corporate R&D input and patent applications, focusing on corporate innovation efficiency, which is more important for firms because both the input and output of R&D should be considered together instead of only one side of R&D.
Using Chinese stock market data from 2011 to 2020, this study investigates the impact of a firm's perception of EPU on corporate innovation efficiency. Our findings reveal a negative correlation between corporate innovation efficiency and firms’ perceptions of EPU. Moreover, this negative impact is attenuated for firms with higher board independence and lower board ownership; state-owned companies are less impacted. Furthermore, the impact of a firm's perception of EPU on corporate innovation efficiency is more pronounced for high-tech firms and those without political connections.
The marginal contributions of this study could be stated in the following aspects.
First, we construct a firm-specific EPU index of economic policy uncertainty after text-mining MD&A. Most current studies concerning EPU apply the index proposed by Baker et al. (2016); however, it is a nationwide index that cannot reflect the EPU perceived by different firms because firms’ perceptions and reactions differ across different policies and macroeconomic circumstances. Second, we employ an SFA method with a time-varying decay model to measure the innovation efficiency of Chinese A-share listed firms and find that, overall, enterprises’ innovation efficiency is not high, but it continues to improve over the years. Third, the impact of a firm's perception of Economic Policy Uncertainty (FEPU) on innovation efficiency is significantly negative, and this relationship is robust after controlling for macroeconomic growth. However, in terms of the EPU index proposed by Baker et al. (2016) and Huang and Luk (2020), the impact of traditional EPU indicators on innovation efficiency becomes statistically insignificant after the addition of a macroeconomic variable, indicating the importance of introducing firm-specific perceptions of EPU. Fourth, the underestimation problem induced by the omission of variables in the model was alleviated using instrumental variables. Owing to the two-stage least squares method, the coefficient of a firm's perception of EPU changes from −0.156 to −5.171.
The remainder of this paper is organized as follows. Section 2 reviews the related literature and presents testable hypotheses. Section 3 describes the measurement of the variables and introduces the empirical model specifications. Section 4 summarizes the data and examines the possible effects of a firm's EPU perception on corporate innovation efficiency. Section 5 examines the robustness of the empirical findings, including possible endogeneity issues. The final section concludes the paper.
Literature reviewThe determinants of corporate innovationCorporate governance has a significant effect on innovation. Tian and Wang (2014) state that improvements in corporate governance can promote innovation. Ownership structure plays an important role in explaining corporate innovation. Many studies have conducted in-depth discussions on the impact of ownership concentration on corporate innovation; however, no consensus has been reached. One strand of literature supports the idea that ownership concentration can reduce corporate innovation (Nguyen, Tran & Truong, 2022; Rapp & Udoieva, 2017; Rossi & Cebula, 2015). Two types of agency problems explain this perspective. Higher ownership concentration leads to higher risk aversion for managers of enterprises because of the exacerbation of agency problems between managers and shareholders (Denis, Denis & Sarin, 1997), which is detrimental to corporate innovation. Conflicts between large and minority shareholders may be exacerbated by an increase in ownership concentration, which is unfavorable for corporate innovation because of the intervention and expropriation of large shareholders in management (Lin, Lin, Song & Li, 2011).
Some scholars hold the opposite view, believing that ownership concentration can alleviate agency problems (Nguyen, Locke & Reddy, 2015; Shleifer & Vishny, 1986). Scholars holding this view generally believe that effective monitoring by large shareholders is an important means of alleviating agency problems (Yafeh & Yosha, 2003). Moreover, several studies have found that large shareholders are more concerned about the market value of the firm and the long-term value of investment projects, including innovation activities (Belloc, 2012; Lee, 2005).
Investors with different identities have different effects on corporate innovation. This study focuses on institutional investors (Aghion et al., 2013; Kochhar & David, 1996; Sakaki & Jory, 2019), state ownership (Zhang, Yu & Chen, 2020a), foreign investors (Kong, Zhu & Yang, 2020; Luong, Moshirian, Nguyen, Tian & Zhang, 2017), individual investors (Jiang & Yuan, 2018; Sakaki & Jory, 2019) and family ownership (Cucculelli & Peruzzi, 2020). The board of directors (BOD) plays an important role in corporate innovation. The addition of independent directors can reconcile board disagreements and alleviate agency conflicts, which is conducive to corporate innovation (Yoo & Sung, 2015; Zhang, 2022). In addition to independent directors, other factors such as board size (Chindasombatcharoen, Chatjuthamard, Jiraporn & Treepongkaruna, 2021), board gender diversity (Griffin, Li & Xu, 2021), and directors’ cultural backgrounds (Tang, Shi, Han, Shu & Xiao, 2021) could also affect corporate innovation.
The corporate financing structure plays an important role in determining corporate innovation. Hall and Lerner (2010) assert that large-scale firms rely on internal funds to smooth innovation spending, thus maintaining sufficient cash flow, which is beneficial to corporate innovation. Yang (2016) proves that firms with a background of both debt and equity holders have fewer agency conflicts and, thus, are more efficient in corporate innovation and likely to have more high-value patents granted. Aibar-Guzmán, García-Sánchez, Aibar-Guzmán and Hussain (2022)) empirically confirm that debt financing can promote corporate innovation in agri-food companies. The PMC also plays an important role in corporate innovation. However, there is no consensus on whether PMC is beneficial or detrimental to corporate innovation. The negative effect of PMC on corporate innovation is proved by Schumpeter (2013) and Grossman and Helpman (1993), which could be called “the “Schumpeterian effect. “However, with the creative work of Aghion et al. (2005), the “Schumpeterian effect” is challenged by the “escape competition effect,” which reveals a positive effect of PMC on corporate innovation. The contemporary issue of whether political connections facilitate or impede corporate innovation has received considerable attention. Zhang, Zhou and Tian (2022a) confirm that political connections can promote corporate green innovation through corporate entrepreneurship strategies, whereas Zhang, Xiong, Li and Deng (2022b) find that political connections with local government officials inhibit corporate innovation.
EPU and corporate innovationThere is a growing number of studies on the influence of EPU, especially after the EPU index is reasonably measured. The literature focuses on the influence of EPU at both macro and micro levels. Some scholars have studied whether EPU has a significant impact on the economy of an entire country or region (Barrero, Bloom & Wright, 2017; Bloom, 2009), whereas others have shed light on the impact of EPU at the micro level, such as corporate investment decisions (Kahle & Stulz, 2013) and financial institutions’ leverage decisions (Lee, Lee, Zeng & Hsu, 2017). An enterprise's external environment significantly impacts corporate innovation. Bhattacharya, Hsu, Tian and Xu (2017) believe that economic systems and market environments are the two main factors driving corporate innovation. Since Baker et al. (2016) used newspaper coverage frequency to measure EPU, a growing number of scholars have paid attention to the research topic of the impact of EPU on corporate innovation.
Most studies show that increasing EPU hinders corporate innovation. Xu (2020) find that rising EPU could induce an increase in the cost of capital, which inhibits corporate innovation. Operational risk and financial distress also explain the negative effects of EPU on corporate innovation (Cui, Wang, Liao, Fang & Cheng, 2021). Lou et al. (2022) find that EPU has a negative effect on corporate innovation for firms with weak risk-taking abilities and whose executives have a low-risk preference. Hao, Zhang and Wei (2022) confirm that an increase in EPU hinders both breakthroughs and incremental innovation. Some studies adopt different perspectives. He et al. (2020) claim that in the low EPU period before 2008, China's EPU had a positive impact on corporate innovation. However, China's EPU remained high after 2008 and had a negative impact on corporate innovation. Guan, Xu, Huo, Hua and Wang (2021) assert that EPU positively affects corporate technological innovation but negatively affects corporate business model innovation, and that market competition is an important transmission channel.
It is evident that prior studies generally used EPU indicators by Baker et al. (2016) and Huang and Luk (2020); as these indicators are nationwide, it is hard to reflect the EPU perceived by each firm. Additionally, the current literature on EPU and innovation mainly focuses on innovation output, whereas few studies have focused on innovation efficiency.
Hypothesis developmentThe real options theory indicates that enterprises’ future investment plans can be regarded as a series of options (Myers, 1977). In a highly uncertain market environment, the real options value depends on the adjustment of corporate investment decisions. Rising uncertainty could increase the likelihood that firms will lag in their long-term project investments due to the irreversibility of investment projects (Bernanke, 1983). Dixit and Pindyck (1994) suggest that opportunity costs could be used as a supplement to the traditional NPV analysis framework to judge a project.
The option value of waiting increases when firms experience an increase in EPU, and corporate managers may choose to postpone their long-run projects to maximize the real option value. R&D investment projects are normally long-run and irreversible, and are more affected by uncertainty than non-R&D investment projects (Goel & Ram, 2001). Faced with various uncertainties, R&D managers use real options valuations to make decisions about the allocation of resources among R&D projects (Trigeorgis & Reuer, 2017). Under limited resources, an increase in EPU can induce R&D managers to choose short-term innovative opportunities driven more by planned obsolescence than true innovation (Soete, 2013). True innovation is normally driven by long-term innovation plans, which have a higher option value for waiting and are less favorable for short-term profit maximization.
Faced with high EPU, firms are more inclined to postpone their long-term innovation plans and choose short-term innovation opportunities. Compared to long-term innovation investments, short-term innovative opportunities such as patents are less likely to generate innovation output. Therefore, when firms perceive high EPU, increasing short-term innovation investment and reducing long-term innovation investment reduce the number of patent applications scaled by R&D inputs or government grants, that is, corporate innovation efficiency. Thus, we propose the first hypothesis:
H1 Firms' innovation efficiency decreases as their perceived EPU increases.
Since 2005, China has implemented independent innovation as part of its national policy (Bichler & Schmidkonz, 2012). State-Owned Enterprises (SOEs) bear the policy burden of national development to a certain extent (Lin, Cai & Li, 1998; Tõnurist, 2015). They are more active in responding to government pro-innovation policies than non-state-owned companies (Jia, Huang & Man Zhang, 2019). Government intervention in SOEs has lower transaction costs (Sappington & Stiglitz, 1987). Moreover, SOEs own “soft” budgets and face lower financing constraints (Berglof & Roland, 1998; Cao, Cumming & Zhou, 2020). When SOEs perceive an increased EPU, they will not easily change their innovation strategies, especially long-term innovation projects, not only because SOEs could better represent the will of the country, but also because many SOE executives have civil servant status, which helps them more easily acquire the talents needed in R&D. Accordingly, we propose the following hypothesis:
H2 State-owned firms mitigate the impact of perceived EPU on corporate innovation efficiency.
Corporate governance affects a firm's perception of the effect of EPU on corporate innovation efficiency. Independent directors play a unique role in corporate governance. Numerous studies show that board independence can alleviate agency problems (Dalton, Hitt, Certo & Dalton, 2007; Setia-Atmaja, Haman & Tanewski, 2011). When the conflict between shareholders and managers becomes serious, managers prefer short-term projects with high profits in their own interests. The management of firms with a higher shareholding of independent directors will receive stricter monitoring and better strategic advice (Booth, Cornett & Tehranian, 2002; Fama & Jensen, 1983), thereby mitigating the impact of firms’ high perceptions of EPU on management's long-term investment decisions and ultimately reducing its impact on corporate innovation efficiency. Hence, our third hypothesis is as follows:
H3 An increase in independent directors’ shareholdings mitigates the impact of perceived EPU on corporate innovation efficiency.
Monitoring is not always beneficial to a firm. Excessive monitoring caused by high board ownership is costly and may enhance a firm's perception of the effect of EPU on corporate innovation efficiency. High board ownership makes the board of directors strengthens firm executives’ monitoring of their interests. Excess monitoring may destroy the trust necessary between the board and CEO and exacerbate the agency problem (Faleye, Hoitash & Hoitash, 2011; Holmstrom, 2005). When firms’ perception of EPU increases, the CEO of firms with high board ownership will become more shortsighted and more inclined to reduce long-term investments, such as long-term innovation projects, and the innovation efficiency of the firms will be more negatively affected. This leads to the fourth hypothesis.
H4 Increased board ownership enhances the impact of perceived EPU on corporate innovation efficiency.
Our model's dependent variable is innovation efficiency, with measures including DEA frameworks (Cruz-Cázares et al., 2013; Guan & Chen, 2010; Guan, Yam, Mok & Ma, 2006; Lee, Kim & Choi, 2019), SFA methods (Piao, Miao, Zheng & Xu, 2022; Wang, 2007), and patent applications or citations scaled by R&D expenditure (Hirshleifer et al., 2018; Xie, Zhou, Zong & Lu, 2020), etc. Each method has advantages. One advantage of the DEA method for measuring innovation efficiency lies in the decomposition and comparative analysis of regional and industrial technological innovation efficiency. However, DEA does not consider the influence of random factors and is highly sensitive to outliers. Due to the strong heterogeneity of enterprises, it may be more appropriate to use the SFA method and patent applications or citations scaled by R&D expenditure to measure corporate innovation efficiency.
Many studies support the idea that government subsidiaries positively affect corporate innovation output (Fang, Lerner, Wu & Zhang, 2018; Wang, Wang & Zhou, 2022). Following Wang (2007) and Piao et al. (2022), the following equation is set:
whereyit denotes innovation outputs,yit=ln(3×inventionsit+2×utilitymodelsit+designsit+1)1; RDit denotes the natural logarithm of firm i's R&D expenditure in year t; Govit denotes the natural logarithm of government grants received by firm i in year t; vit is the idiosyncratic error term; vit conforms to an independent and identically distributed normal distribution; uit is referred to as the inefficiency term.where ui conforms to an independent and identically distributed truncated-normal distribution; Ti is the last year in the ith firm, φ is the decay parameter.where InnoEf1it denotes the innovation efficiency of firm i in year t, and ranges from zero to 100.


The estimation results in Table 1 show that both R&D expenditures and government grants have significant positive effects on patent applications. μ is significantly positive, which means that the inefficient effects are statistically significant. φ is significantly positive, which indicates that the level of inefficiency decays toward the base level, which confirms the fact that generally the innovation efficiency of Chinese A-share listed companies has been improving over time. Sigma_u2 is the estimate of σu2 and Sigma2 is the estimate of σS2, which equals σv2+σu2.
This table provides the estimation results of SFA with a time-varying decay model.
| RD | Gov | μ | φ | Sigma_u2 | Sigma2 | |
|---|---|---|---|---|---|---|
| Coefs | 13.157*** (0.731) | 0.212*** (0.007) | 3.297*** (0.170) | 0.012*** (0.001) | 1.730 | 2.830 |
Note: ***, **, and * represent significance at the 1%, 5%, and 10% levels, respectively. The standard errors are reported in parentheses.
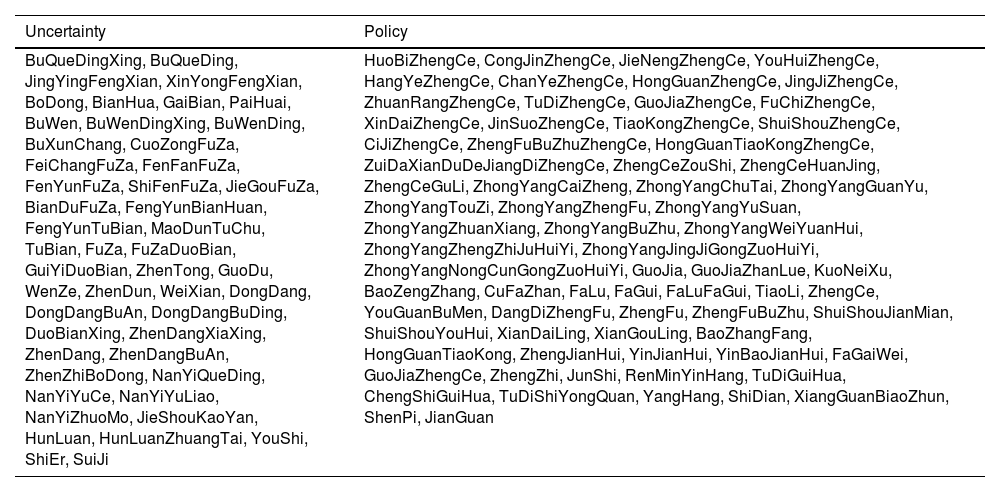
Following Yu et al. (2021a), the index of firm's perception of EPU is constructed on the basis of its annual report using a text-mining method. With the development of information technology, unstructured data have been introduced in corporate finance studies, and text mining methods have been widely used in previous research (Loughran & McDonald, 2011, 2014; Tetlock, 2007). Following Baker et al. (2016), a lexicon-based approach is applied; once some specific words are found in one text, then this text is identified as text containing specific meanings. In this paper, if one phrase contains simultaneously words like “policy” and “uncertainty,” then, this phrase will be considered as expressing that the firm faces economic policy uncertainty. A detailed list of words is presented in Table 2.
Words list in Chinese Pinyin.
More specifically, the text we analyzed is from Management Discussion and Analysis (MD&A). All numbers, English letters, punctuation marks, and special symbols, except full stops, were removed. We then split the MD&A text into phrases by Chinese period, taking phrases as the basic unit for analysis and considering the habits of Chinese expression. Assuming the number of sentences in MD&A is Sit for listed firm i of year t, if one phrase s has words related to “government,” “policy,” and also contains words expressing uncertainty, then we consider this phrase referring to EPU (P). We used the number of phrases referring to EPU (nP) scaled by the total number of sentences (Sit). Thus, a firm's perception of EPU, FEPU is defined as
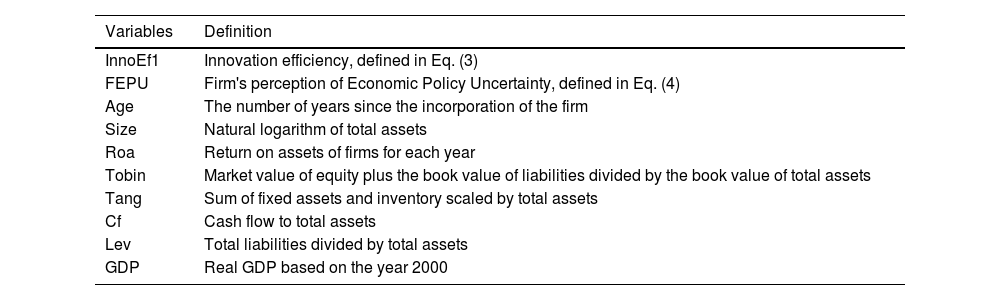
Model specificationwhere InnoEfitrefers to the innovation efficiency of firm i in year t. Following Cui et al. (2021) and Gao and Chou (2015), lagged measures of FEPU and controls are applied in our model to alleviate possible reverse causality. FEPUit−1 denotes the perception of EPU of firm i in year t−1. CONTROLit−1k represents a set of control variables. According to previous studies (Cui et al., 2021; Gao & Chou, 2015; Guan et al., 2021; Hao et al., 2022), numerous control variables are included in our model: firm age (Age), corporate size (Size), Tobin's Q (Tobin), tangible assets (Tang), cash flow (Cf), leverage ratio (Lev), and gross domestic product (GDP). Year represents the year dummy variable and industry represents the industry dummy variable.εit is the unobserved random error. The detailed definitions of the variables are presented in Table 3.

This table provides the definitions of the variables.
| Variables | Definition |
|---|---|
| InnoEf1 | Innovation efficiency, defined in Eq. (3) |
| FEPU | Firm's perception of Economic Policy Uncertainty, defined in Eq. (4) |
| Age | The number of years since the incorporation of the firm |
| Size | Natural logarithm of total assets |
| Roa | Return on assets of firms for each year |
| Tobin | Market value of equity plus the book value of liabilities divided by the book value of total assets |
| Tang | Sum of fixed assets and inventory scaled by total assets |
| Cf | Cash flow to total assets |
| Lev | Total liabilities divided by total assets |
| GDP | Real GDP based on the year 2000 |
Our sample contained annual data from 2011 to 2020. Data were extracted from the China Stock Market and Accounting Research database (CSMAR). Our sample comprised firms from the Shanghai Stock Exchange, Shenzhen Stock Exchange, Small and Medium Enterprise Board, and Growth Enterprise Market. Financial sector firms were excluded from the sample. Our dataset was reduced to unbalanced panel data because of missing observations due to the incomplete datasets of some firms. The data were winsorized at the 1% and 99% levels.
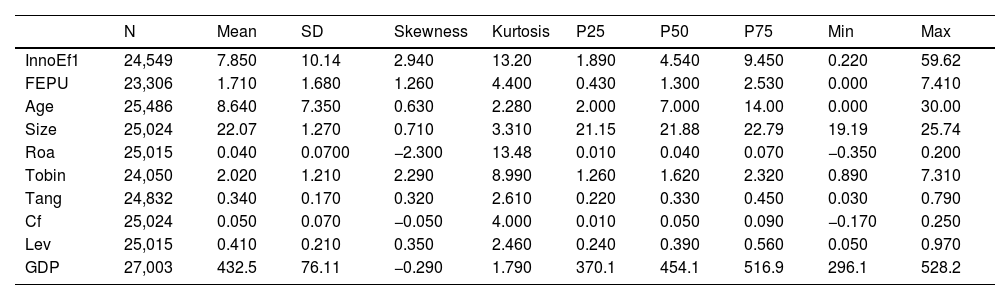
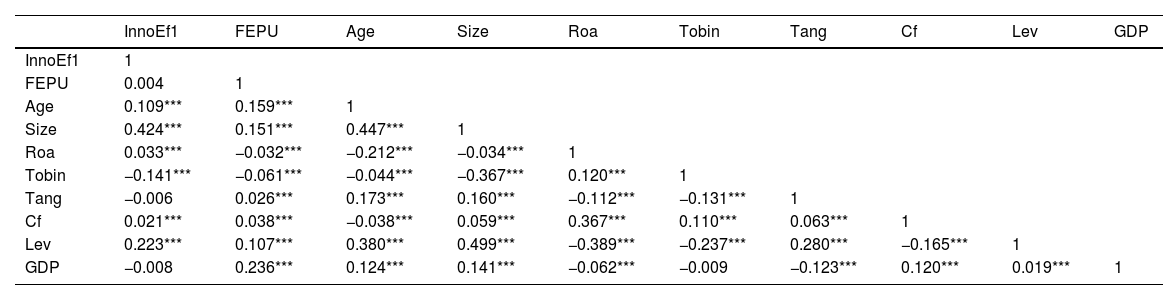
Table 4 presents the summary statistics of all the variables. On average, firms’ innovation efficiency was 7.85 with a standard deviation of 10.14. This indicated that most Chinese A-share listed companies had low innovation efficiency, whereas only a few companies had high innovation efficiency. The mean of a firm's perception of EPU was 1.71 with a standard deviation of 1.68. Table 5 reports the Pearson correlation coefficients of the variables. The Pearson correlation coefficients indicated that the correlation between a firm's perception of EPU and corporate innovation efficiency was not significant. However, there was no necessary connection between correlation and causation. We further explored the causal effect of a firm's perception of EPU on corporate innovation efficiency and possible endogeneity issues. In general, the values of the correlation coefficients were small and there was no serious multicollinearity.
This table reports the descriptive statistics of the variables.
This table shows the Pearson correlation coefficients of the variables.
Note: ⁎⁎⁎ indicates significance at the 1% level, ⁎⁎ indicates significance at the 5% level, and * indicates significance at the 10% level.
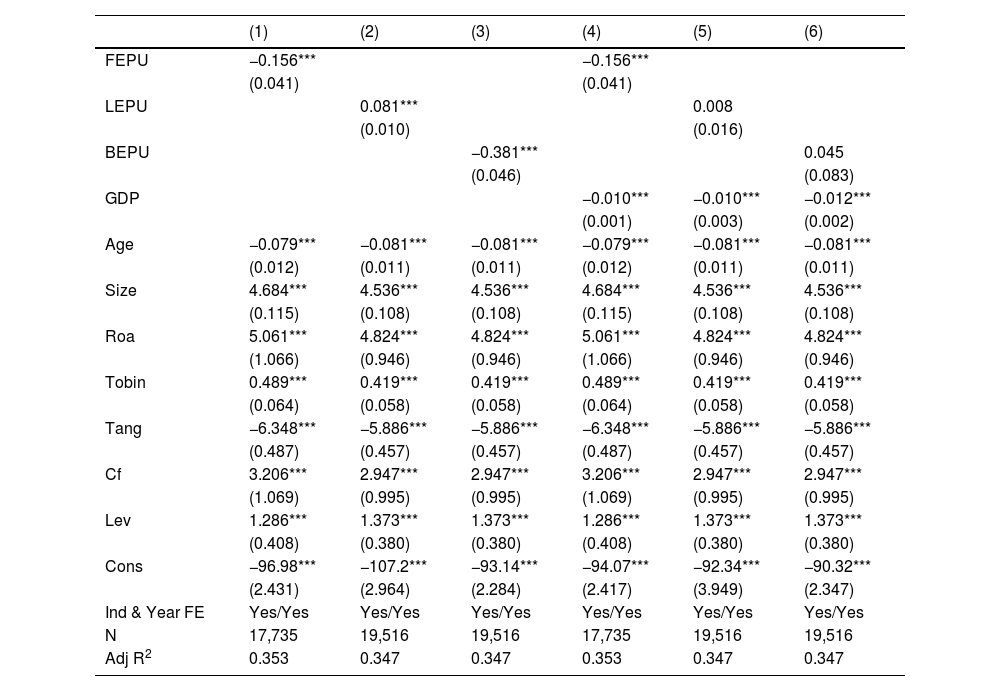
Two other EPU indicators have been widely used in previous studies, specifically by Baker et al. (2016) and Huang and Luk (2020). For comparison, we also investigated the impact of these two indicators on corporate innovation efficiency. Table 6 presents the empirical results. To test the correlation between macroeconomic conditions and the EPU indicators of Baker et al. (2016) and Huang and Luk (2020), we added GDP as a control variable. Columns 1–3 present the results without GDP, and Columns 4–6 add GDP. Moreover, the results for firms’ perceptions of EPU are presented in Columns 1 and 4; Columns 2 and 5 report the results for EPU proposed by Huang and Luk (2020) (LEPU), and Columns 3 and 6 report the results for EPU proposed by Baker et al. (2016) (BEPU). In addition, fixed effects of industry and year were controlled for in all specifications, and white-robust standard errors were used.
This table shows the results of impact of EPU on innovation efficiency, three measures of EPU are investigated. LEPU denotes the EPU index developed by Huang and Luk (2020); BEPU denotes the EPU index developed by Baker et al. (2016). Dependent variable: InnoEf1.
Note: ***, **, and * represent significance at the 1%, 5%, and 10% levels, respectively. The standard errors are reported in parentheses.
The empirical results in Table 6 show that when GDP is not included in the model. The coefficients of the three EPU measures were consistently significant. However, as we added GDP, the coefficients of “LEPU” and “BEPU” became insignificant, and the coefficient of firm's perception of EPU remained significant. These two indicators, “LEPU” and “BEPU,” were based on text analysis of Chinese newspapers, and were nationwide indicators. Thus, they were highly correlated with macroeconomic growth. A firm's perception of EPU was affected by at least two factors: EPU itself and management's attitude towards it.
Moreover, the coefficients of a firm's perception of EPU were significantly negative in Columns 1 and 4, revealing that corporate innovation efficiency decreases with a firm's perception of economic policy uncertainty, which supported our first hypothesis. Specifically, the estimation results indicated that an increase of one unit in a firm's perception of EPU produceed an estimated 15.6% decrease in innovation efficiency relative to an average innovation efficiency of 7.85. In addition, larger and more profitable firms tended to innovate more efficiently. Firms with greater growth opportunities were associated with higher innovation efficiency, but firms with higher age and more tangible assets tended to have lower innovation efficiency. Cash flow and the leverage ratio were positively correlated with innovation efficiency.
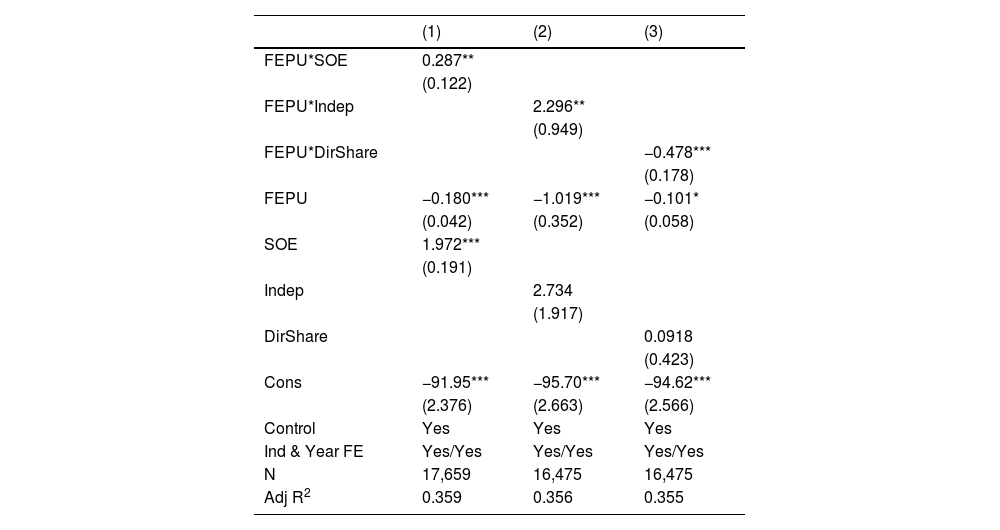
Moderating effect of firm nature and corporate governanceThe impact of firm's perception of EPU on innovation efficiency depends highly on its nature and corporate governance, as the reaction of firms to perceived EPU is greatly determined by these two features. The empirical results are presented in Table 7. The moderating effect of SOE is reported in Column 1, the results for board independence are shown in Column 2, and Column 3 presents the moderating effect of board ownership. Both industry- and year-fixed effects were controlled for and white-robust standard errors were used.
This table shows the results of moderating effect of SOEs, board independence, and board ownership. SOE in this table is a dummy variable, which equals 1 if the firm is state-owned. Indep denotes the proportion of independent non-executive directors on corporate boards, calculated from the number of independent members divided by the number of members on the board. DirShare denotes the board ownership, calculated as the shareholdings of all board members divided by the total assets. Dependent variable: InnoEf1. In order to save space, the coefficients of the control variables are not reported in the table.
Note: ***, **, and * represent significance at the 1%, 5%, and 10% levels, respectively. The standard errors are reported in parentheses.
As presented in Table 7, the interaction term between firm's perception of EPU and SOE is significantly positive, which confirms H2 and indicates that the negative impact of firm's perception of EPU on its innovation efficiency is attenuated if it is state-controlled. In China, numerous SOEs undertake social and political burdens, in addition to profit maximization (Carpenter, Lu & Whitelaw, 2021; Zhang & Zhou, 2022; Zhang et al., 2022; Zhang, Zhang & Zhou, 2020b). Consequently, they are less affected by firms’ perceptions of EPU.
In terms of independent directors, our results show that the impact of firm's perception of EPU was mitigated as the ratio of independent directors increases, which confirms our third hypothesis. Board independence can mitigate the impact of a firm's perception of EPU for two reasons: First, firms can benefit from the resource dependence of independent directors (Hillman & Dalziel, 2003), which further relieves the impact of a firm's perception of EPU; second, current studies show that agency problems can be mitigated by board independence, thus improving decision efficiency and enhancing firm performance (Brickley, Coles & Terry, 1994; Nguyen & Nielsen, 2010). As a result, board independence increases firms’ risk-taking, which further moderates the impact of firm's perception of EPU on innovation efficiency.
The results in Column 3 show that the impact of a firm's perception of EPU increases as the share of board directors increases, thus confirming Hypothesis H4. The monitoring function increases with an increase in the number of directors (Brickley, Lease & Smith, 1988). However, as the share of board directors increases, board support as perceived by managers weakens, which in turn causes managerial myopia due to intense monitoring (Adams, 2009). Consequently, an increase in the share of the board of directors enhances the negative impact of a firm's perception of EPU on innovation efficiency.
Heterogeneity of firmsWe conducted a heterogeneity analysis of firms and investigated political connections (PC) and high-tech features. Firms’ perceptions of EPU could have a weaker impact on corporate innovation efficiency for politically connected firms. Politically connected firms could receive more corporate bailouts than non-politically connected firms (Faccio, Masulis & McConnell, 2006) and the cost of making incorrect decisions could be mitigated if the firms are politically connected. The innovation process requires a firm to take risks since innovation is always accompanied by high risk (Wales, Gupta & Mousa, 2013). Current research showed that firms with political connections could easily obtain more resources when facing high levels of uncertainty; thus, their risk-taking could be higher than that of firms without political connections (Boubakri, Cosset & Saffar, 2013; Ding, Jia, Qu & Wu, 2015).
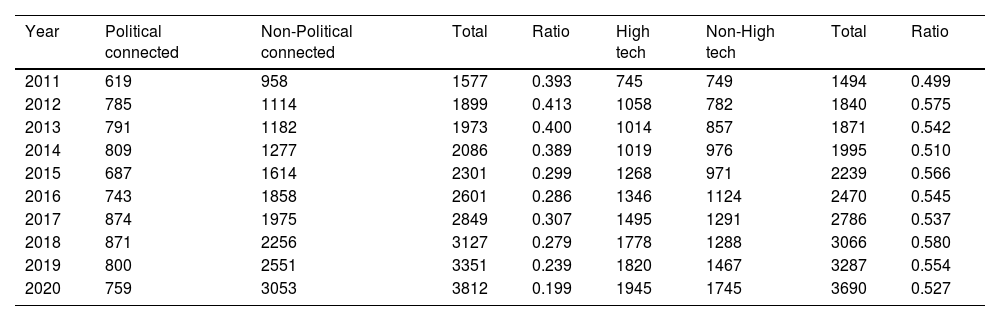
Moreover, politically affiliated companies can receive high-quality information because of their close ties with the government and enjoy more face-to-face time" with government officials (Hojnacki & Kimball, 2001). As a result, politically connected firms have a lower option value for waiting and a higher option value for growth in the face of high economic policy uncertainty. Compared to non-politically connected companies, they are less likely to reduce long-term investments, such as innovation projects. Following Hou, Hu and Yuan (2017) and Su, Xiao and Yu (2019), we defined a firm as politically connected if its chairman or general manager formerly or currently serves as a government official, deputy, or Chinese People's Political Consultative Conference committee member. The descriptive statistics in Table 8 show that the ratio of politically connected firms generally decreased over the years, from approximately 40% to 20%.
This table reports the descriptive statistics of the political connection and high-tech features.
Generally, high-tech firms invest in riskier projects that are more idiosyncratic than routine tasks (Holmstrom, 1989), and such investments are likely to be irreversible. Thus, based on real options theory, when facing high levels of EPU shocks, high-tech firms are likely to delay or postpone their long-term investment in R&D and Innovation (Bernanke, 1983; Zhang et al., 2020). Consequently, the impact of firm's perception of EPU is greater for high-tech firms. Following Gao, Shen, Li, Mao and Shi (2020), we manually identified high-tech firms among Chinese A-share listed companies from 2011 to 2020 based on the criteria set by the No. 32 Document published by the Chinese National Science and Technology Focus [2016]2. The statistics in Table 8 indicate that the proportion of high-tech firms ranged from 50% to 58% between 2011 and 2020.
Fig. 1 depicts histograms of innovation efficiency for different firms from 2011 to 2020. Fig. 1.1 and Fig. 1.2 show the innovation efficiencies of high- and non-high-tech firms, respectively. The median innovation efficiency values of high-tech firms have increased over the years; however, this growing trend is not evident among non-high-tech firms. Similar findings exist when comparing firms with and without political connections. Fig. 1.3 shows that the median values of innovation efficiency of politically connected firms have increased over the years, while Fig. 1.4 illustrates that this is not significant for firms without political connections.

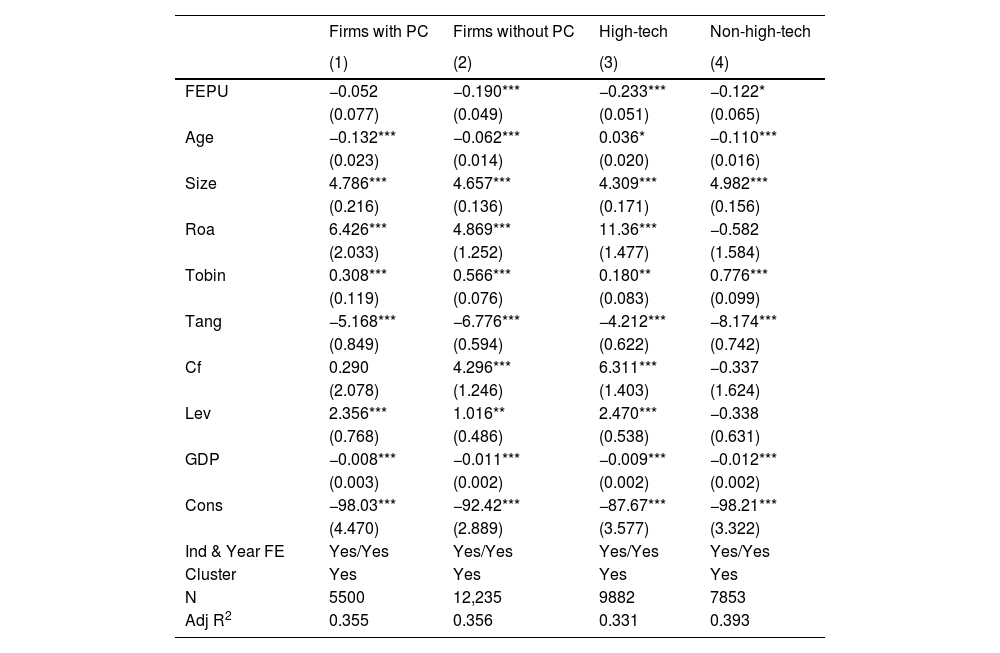
Table 9 presents the estimation results for the subsamples. First, regarding political connections, we split our sample into two subsamples, the first of which contains firms with political connections (Column 1). The second subsample contains firms without political connections, and the results are reported in column 2. Columns 3 and 4 report the results for high-tech and non-high-tech firms, respectively. Our findings showed that the impact of firm's perception of EPU on corporate innovation efficiency was more pronounced for firms without political connections, which coincides with previous studies that face uncertainties because firms with political connections can undertake more risks than those without political connections. Moreover, the impact of firm's perception of EPU on corporate innovation efficiency is greater for high-tech firms than it is for firms in traditional industries are less impacted.
This table shows the results of heterogeneity analysis. Column 1 shows the results for firms with political connection, and the results for firms without political connection is reported in Column 2. Column 3 shows the results for high-tech firms, and the results for non-high-tech firms are presented in Column 4. Dependent variable: InnoEf1.
Note: ***, **, and * represent significance at the 1%, 5%, and 10% levels, respectively. The standard errors are reported in parentheses.
To check the robustness of our model, we replaced our dependent variables with two other measures of innovation efficiency. Following Bereskin, Campbell and Hsu (2016), we used the ratios of innovation outputs to innovation inputs as alternatives to measure corporate innovation efficiency. The formulae for the alternative dependent variables are as follows:


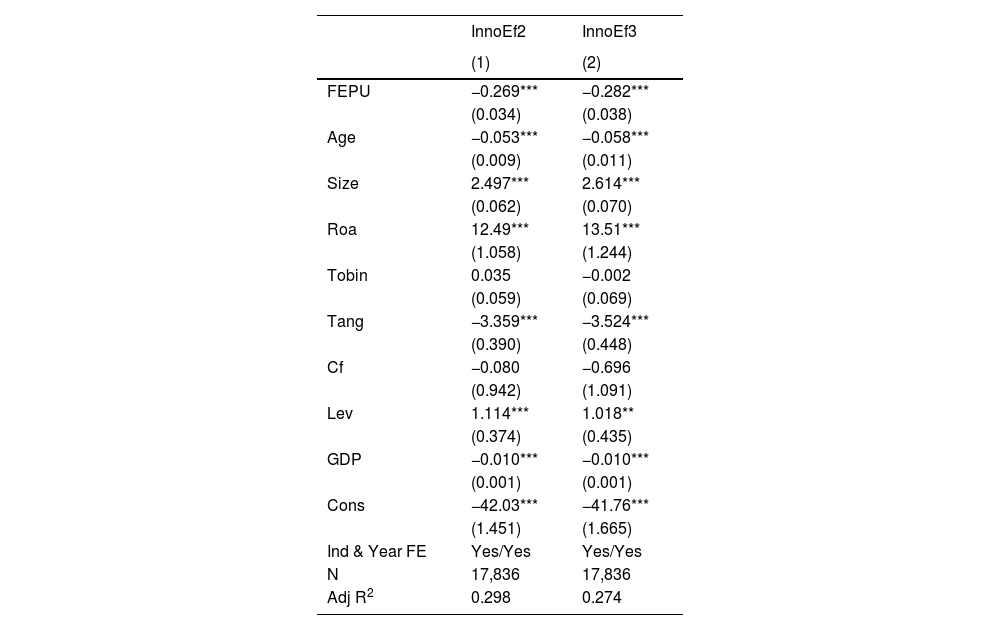
The empirical results are presented in Table 10, indicating that the results were consistent with the modification of measures of innovation efficiency; the coefficients of firm's perception of EPU in both Columns 1 and 2 were significantly negative, suggesting that corporate innovation efficiency decreases with firm's perception of EPU.
This table shows the results for two others measures of innovation efficiency. Dependent variable: InnoEf2 and InnoEf3.
Note: ***, **, and * represent significance at the 1%, 5%, and 10% levels, respectively. The standard errors are reported in parentheses.
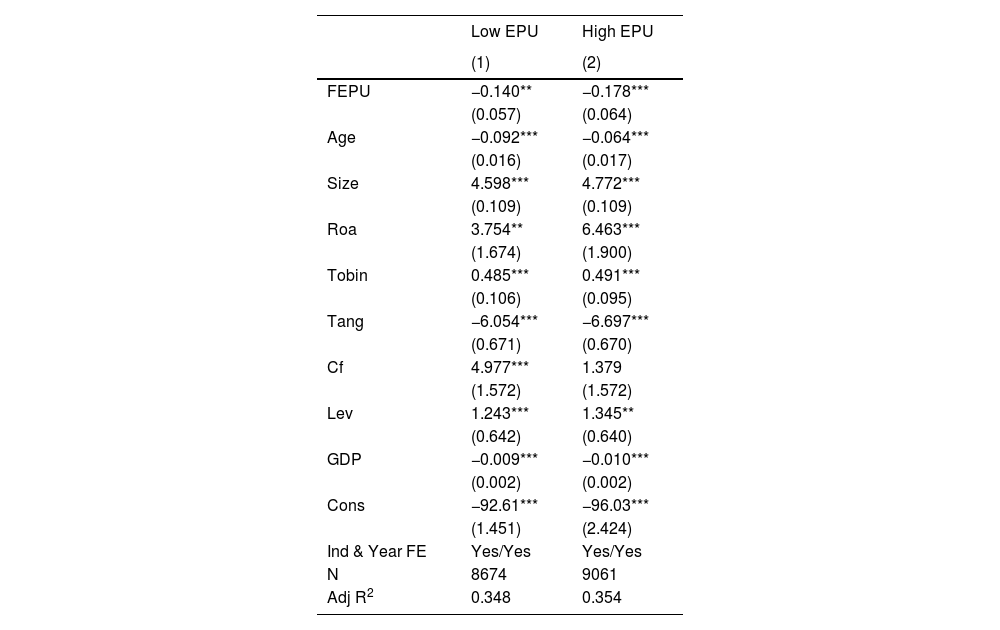
The sample selection could have biased the estimation results. The effect of a firm's perception of EPU on corporate innovation efficiency can vary under different policy uncertainties. In view of this, we split the sample into two subsamples: one sample with BEPU values above the median (High EPU group) and the other with BEPU values below the median (Low EPU group). Table 11 shows the estimation results for these two subsamples, showing that the negative effect of a firm's perception of EPU on corporate innovation efficiency remained robust.
This table shows the estimation results for Low EPU group and High EPU group. Dependent variable: InnoEf1.
Note: ***, **, and * represent significance at the 1%, 5%, and 10% levels, respectively. The standard errors are reported in parentheses.
The frequency of uncertainty statements in MD&A is related to management's risk preferences, which can also affect corporate innovation efficiency. Low corporate innovation efficiency may be because its management level is too conservative and risk-averse, resulting in insufficient investment in innovation. Management conservatism and risk aversion could also lead to a higher firm's perception of EPU compared to other firms. It is challenging to directly measure management's risk attitude, and not controlling for the risk attitude factor can lead to the omission of variables in the model, resulting in biased estimates. To alleviate this problem, we use the average values of a firm's perception of the EPU of other firms in the same province as the instrumental variable, which has been confirmed and successfully applied in many studies, including Liu and Feng (2015). One firm's perception of EPU is highly correlated with the average firm's perception of the EPU values of other firms in the same province because Chinese provincial features significantly affect firms’ perceptions of EPU. Yu, Shi, Guo and Yang (2021b) confirm that the EPU index of the eastern coastal provinces is higher than that of the western inland provinces. In addition, one firm's innovation efficiency can only be affected by its perceived EPU, instead of the average firm's perception of the EPU of other firms in the same province. Therefore, theoretically, an average firm's perception of the EPU of other firms in the same province could serve as a suitable instrumental variable for our empirical setting.
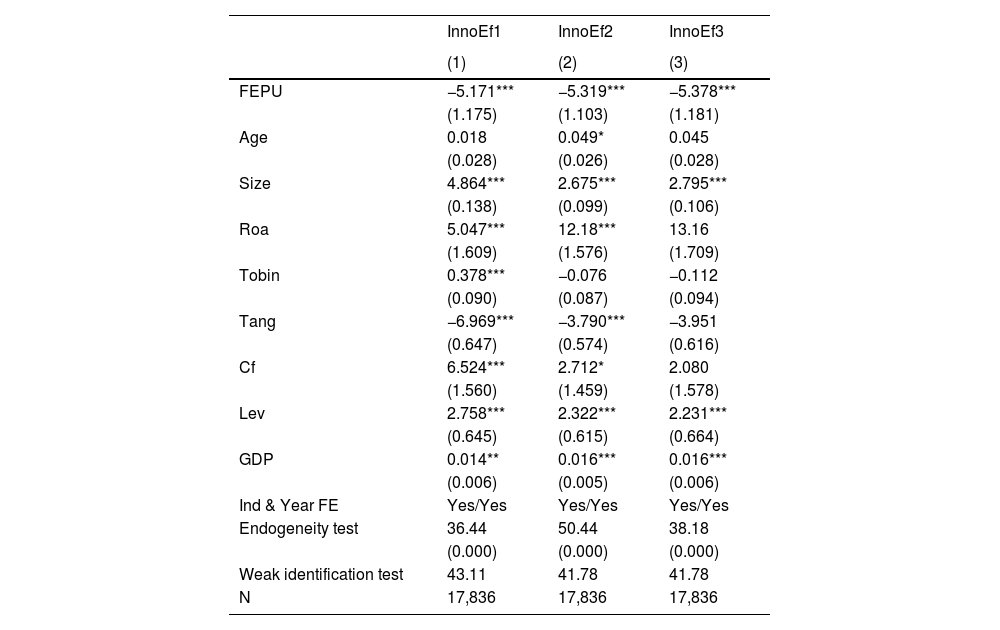
Table 12 shows the estimation results using the average values of a firm's perception of the EPU of other firms in the same province as the instrumental variable. The endogeneity test statistics, defined as the difference between the two Sargan-Hansen statistics, show that the firm's perception of EPU was endogenous, and instrumental variables were needed. We calculated Cragg-Donald Wald F-statistics to detect whether our model has a weak identification issue. The F-value was greater than the 10% maximal IV size 16.38 (Stock & Yogo, 2002) and the model was not weakly identified. It is evident that the underestimation problem caused by reverse causality was alleviated. The estimation results in Column 1 indicate that one unit increase in firm's perception of EPU could induce a −5.171 decrease in corporate innovation efficiency with the average value of corporate innovation efficiency equal 7.850. Moreover, the estimation results in columns 2 and 3 show that the IV estimations are robust to the other two corporate innovation efficiency measures.
This table shows the results using the average firm's perception of EPU of other firms in the same province as the instrumental variable. Dependent variables: InnoEf1, InnoEf2, and InnoEf3.
Note: ***, **, and * represent significance at the 1%, 5%, and 10% levels, respectively. The standard errors are reported in parentheses.
Corporate innovation is vital for a firm's sustainable growth and the innovation process is highly affected by macroeconomic circumstances. Recent studies show that EPU has a significant impact on innovation (Bloom, 2007; Lou et al., 2022; Xu, 2020). Most of the current literature employs the EPU index proposed by Baker et al. (2016); however, this index is nationwide and identical for all firms at a given time. However, perceptions of EPU differ significantly among firms. A firm's perception of EPU may differ across different policies, and the impact of one policy may differ across firms. As a result, following Yu et al. (2021a), we calculate the index of a firm's perception of EPU based on text-mining firms’ MD&As and further investigate the impact of firms’ perceptions of EPU on corporate innovation efficiency. The SFA method with a time-varying decay model was applied to measure corporate innovation efficiency.
Using a dataset of Chinese listed firms from 2011 to 2020, our empirical results show that the corporate innovation efficiency of Chinese A-share listed firms is relatively low, but has increased over the years. Meanwhile, the impact of FEPU on innovation efficiency is significantly negative, and this relationship is robust after controlling for macroeconomic growth. However, in terms of the EPU index proposed by Baker et al. (2016) and Huang and Luk (2020), the impact of traditional EPU indicators on innovation efficiency becomes statistically insignificant after the addition of a macroeconomic variable, indicating the importance of introducing firm-specific perceptions of EPU. Moreover, the negative impact of firm's EPU perception on corporate innovation efficiency is attenuated when the firm is state-owned. In terms of corporate governance, the impact of firm's perception of EPU is mitigated as the ratio of independent directors increases, and this impact increases as board ownership increases. Furthermore, the impact of firm's perception of EPU is more pronounced for firms without political connections and high-tech firms. Finally, the underestimation problem caused by reverse causality between corporate innovation efficiency and firm's perception of EPU is alleviated using IV regressions.
DiscussionOur study enriches the literature on the effects of EPU on corporate decisions and innovation efficiency; however, there are still some limitations. First, our study focuses on the direct effect of FEPU on innovation efficiency and the moderating effect of firm nature and corporate governance; however, the impact mechanism is ignored, which helps us understand how innovation efficiency is affected by FEPU. Second, the FEPU index is presented by the words’ frequency,’ and the construction of FEPU could be more explicit because the industry policies could be positive or negative to the firms, which is ignored in this study.
Therefore, impact channels can be further investigated in future research. For example, human capital is a possible channel, because human capital levels can influence the efficiency of R&D fund use and corporate innovation efficiency (Ramírez, Gallego & Tamayo, 2020) and EPU has a significant negative effect on enterprises’ human capital investment (Naidenova, 2021). In terms of the construction of FEPU, one can further investigate the nature of policies; thus, the impact of FEPU can be investigated more explicitly.
Based on our empirical results, we propose the following policy implications: First, to maintain corporate innovation efficiency, it is vital for governments to provide stable economic circumstances because corporate innovation efficiency is reduced as firms perceive economic policy uncertainty. Second, mixed ownership reform is crucial in China, and our empirical results show that SOEs are less impacted by FEPU. Thus, with mixed ownership reform in non-state-owned firms, the risk-taking of non-state-owned firms will be greatly improved, thus improving the innovation efficiency of non-state-owned firms.
Footnotes- 1
The Patent Law of the People's Republic of China stipulates that patents can be classified into three types: inventions, utility models, and designs. The term “invention” refers to any new technical solution relating to a product, a process, or an improvement thereof. The term “utility model” refers to any new technical solution related to a product's shape, structure, or combination thereof that is suitable for practical use. “Design” refers to a new design of the shape, pattern, or a combination thereof, as well as a combination of the color, shape, and pattern of the entire or a portion of a product, which creates an esthetic feeling and is suitable for industrial applications. We give three types of patents a 3:2:1 wt based on the difficulty of applying for different types of patents, we provided three types of patents.
- 2
For the specific criteria, please refer to Note 1 in Gao et al. (2020).
The authors would like to thank Yanjun Pu from Chongqing University of Technology for her research assistance. This research is financially supported by the Key Projects of the National Social Science Fund of China (Grant No. 22AZD095).