


As global warming increases, the need for the coordinated development of the economy and the environment is becoming increasingly apparent, urgently requiring a low-carbon transition. A conceptual framework was constructed originally from the perspective of innovation and the spillover effect, exploring the influencing pathways of intelligent manufacturing on the low-carbon transition. The dynamic linkages among intelligent manufacturing, carbon efficiency, and industrial structure upgrading were demonstrated by the PVAR model, based on a panel data set of 30 provinces in China from 2006 to 2020. The empirical result shows that intelligent manufacturing promotes low-carbon transition mainly through industrial structure upgrading, and the spillover effect plays a more significant and widespread role in the low-carbon transition. Furthermore, the level of industrial structure upgrading was determined as the variable that explains the change in carbon efficiency the most according to the variance decomposition. Additionally, it is inefficient for intelligent manufacturing to popularize in traditional industries, which implies that it should be taken as a step-by-step approach to achieve a low-carbon transition for traditional industries. Moreover, upgrading the industry structure is an important step with far more priority in a low-carbon transition.
With increasing attention being placed on global warming, the low-carbon transition has become an urgent task for countries worldwide (Carleton & Hsiang, 2016). As the largest emitter of greenhouse gasses (GHGs), China plays a crucial role in global climate change mitigation (Liu & Zhang, 2021) and is struggling to achieve the carbon peak and carbon neutrality goal. China's dual carbon target has attracted wide attention from the international community. Since China's rapid growth is based on high energy consumption and high GHG emissions (Tan, Choi, Wang & Huang, 2020), China's carbon dioxide (CO2) emissions have increased drastically over the past four decades, and the total amount of CO2 emissions is 12.849 billion Mt in 2021, five times that of India. Therefore, China's traditional manufacturing industry faces a complicated process of reducing CO2 emissions. China can transition from an extensive economy to low-carbon development, which will inevitably create challenges in a relatively backward stage where socioeconomic infrastructure and technological power cannot support green development (Wang, Sun & Liu, 2019).
The literature indicates that the popularization of intelligent technologies can improve energy use efficiency (Jin & Chen, 2022), which provides practical solutions for the low-carbon transition. Due to the digitalization and intelligence of the manufacturing industry (Skare & Soriano, 2021), information technology, artificial intelligence, and big data have been widely used in all production stages (He & Bai, 2021), providing technical support for lean production and facilitating energy conservation and emission reduction. The rapid development of intelligent technologies has been a general trend to achieve a low-carbon transition through intelligent manufacturing. However, intelligent manufacturing has a double-edged effect on carbon dioxide emission reduction (Jin, Zhang & Peng, 2014), and it remains unclear whether improving the intelligent manufacturing index is a significant factor in the low-carbon transition.
Some investigators argue that it is uncertain whether intelligent manufacturing can reduce carbon emissions. While intelligent manufacturing reduces carbon emissions through technological changes and lean manufacturing systems, it also increases energy consumption and carbon emissions due to rising productivity and expanding the production scale. Moreover, a low level of intelligent technology application carries the possibility that intelligent manufacturing consumes more electricity because it generates and processes large amounts of data, increasing carbon emissions significantly (Yu, Liu & Zhu, 2022). The initial stage of intelligent manufacturing inevitably allows enterprises to accumulate machine learning experience by running millions of statistical experiments, requiring high energy consumption.
Moreover, the literature still disputes the causality of intelligent manufacturing and the low-carbon transition. Many studies suggest that a series of policies issued to strengthen the enforcement of carbon reduction have motivated enterprises to invest in intelligent manufacturing (Wu, Cheng, Lin & Yao, 2019). As enterprises with high carbon emissions must pay more carbon taxes, placing them in a disadvantaged position in carbon trading, more and more enterprises are trying to achieve intelligent transformation. Meanwhile, under the pressure of environmental regulation, energy-intensive enterprises face higher production costs and lower competitiveness, driving them out of the market. Policy pressure has a more immediate effect on business activity; therefore, provinces with more intensive policy implementation tend to achieve higher carbon efficiency, in which enterprises improve their level of intelligence positively for higher carbon efficiency and competitiveness. Thus, reverse causality is created, meaning that carbon reduction promotes the regional capacity for intelligent manufacturing.
Therefore, whether and how intelligent manufacturing can promote low-carbon transition development is still unknown, causing debates from the research community due to the implement of low-carbon transition and the challenge of deindustrialization. Manufacturing is the main body of the national economy, the foundation of a country's innovation, and the primary determinant of overall national strength. If tertiary industries replace manufacturing on a large scale, it can create supply chain security concerns and become an obstacle to economic growth; therefore, it is crucial to accelerate the development of the low-carbon transition rather than pursue a drastic reduction in carbon emissions (You & Zhang, 2022). Thus, there is great practical significance and value in exploring how intelligent manufacturing can promote carbon efficiency more effectively.
Unlike existing studies discussing intelligent manufacturing and carbon efficiency separately, this paper conducts an empirical analysis to illustrate the dynamic linkages among intelligent manufacturing, carbon efficiency, and industrial structure upgrading. This original approach is valuable for further understanding the influencing mechanism of intelligent manufacturing on the low-carbon transition and the improved measurement method of intelligent manufacturing index and carbon efficiency. The innovation in this paper can be summarized as follows. (1) The innovation spillover effect created the influence pathway of intelligent manufacturing on low-carbon transition, and the spillover effect played a more significant and widespread role. (2) The causality among intelligent manufacturing, industrial structural upgrading, and carbon efficiency was demonstrated with the panel vector autoregressive (PVAR) model based on the generalized method of moments (GMM) estimations, effectively solving the endogeneity problem in regressions. (3) The improved measurement method of carbon efficiency and intelligent manufacturing is more efficient. The carbon efficiency model was constructed to avoid the unsolved problem of intertemporal mixed directional distance function (DDF), and the intelligent manufacturing index was constructed with a comprehensive indicator system.
The rest of this paper is organized as follows. Section 2 reviews the literature and sets up a conceptual framework for the impact of intelligent manufacturing on the low-carbon transition. Section 3 introduces the measurement method and data resources for indicators in this research, and section 4 presents the model specification and descriptive statistics. Furthermore, the empirical results are presented in section 5, section 6 discusses spillover and innovation effects from the empirical results, and section 7 summarizes the conclusion and the proposed policy implications.
Literature review and conceptual frameworkReview of intelligent manufacturing and carbon emissions reductionAs intelligent manufacturing is causing a significant transition in the manufacturing sector, much literature is investigating the impact of intelligent technologies and digital transformation (Peng & Tao, 2022). Due to the sustainability benefits of intelligent manufacturing, intelligent manufacturing has been widely regarded as one of the most practical ways to realize low-carbon development; however, existing literature observes and studies the impact of intelligent manufacturing on carbon emission reduction from a single perspective, ignoring system analysis from different perspectives. Based on a summarization of relevant literature, the impact of intelligent manufacturing on carbon efficiency can be divided into two types, direct and indirect.
- (1)
Many scholars focus on the direct impact of intelligent manufacturing on carbon emissions, arguing that intelligent technology contributes significantly to energy conservation in the manufacturing sector through improved production efficiency and innovation in production modes (Zhang, Shi, Shi & Chen, 2021; Zheng, Ardolino, Bacchetti & Perona, 2020). Some studies have analyzed the contribution of intelligent manufacturing to reducing carbon emissions from the perspective of innovation (Li, Kim, Lang, Kauffman & Naldi, 2020; Liu & Zhang, 2021). Intelligent manufacturing provides technology support to collect, integrate and transform large volumes of data, promoting the optimization and innovation of production processes. Specifically, low-carbon technological innovation significantly impacts carbon efficiency (Yin, Liu & Gu, 2022). Furthermore, intelligent manufacturing makes it more convenient for enterprises to realize interdepartmental cooperation through information management systems. The direct impact of intelligent manufacturing on carbon emission reduction is based on innovation in technology, supply chain management, and business models; thus, this paper summarizes it as innovation effective.
- (2)
Some scholars realize that intelligent manufacturing contributes to industrial structure upgrading, thus indirectly promoting low-carbon transition development. There is a consensus that intelligent manufacturing benefits to industrial structure advancement and rationalization (Zhou, Zhang & Wang, 2020; Zou & Xiong, 2022). With the popularization and application of intelligent manufacturing (Matyushok, Krasavina, Berezin & García, 2021), robots will replace humans, and manufacturing industrial workers will move to the service sector (Calabrese, Dora, Ghiron & Tiburzi, 2020); thus, the labor employment structure will be reshaped and the demand for high-quality talents will increase. Under the pressure of the new trends of replacing the cheap labor force with machines, traditional industries have been forced to upgrade, and enterprises’ development strategies must be adjusted to maintain a competitive advantage (Sun & Hou, 2019). This situation represents a process of industrial upgrading. The indirect impact of intelligent manufacturing on carbon emission reduction can be summarized as a spillover effect because it influences other related areas and mainly depends on industrial structure adjustment and employment structure transformation.
The fusion development between carbon efficiency improvement and industrial structure upgrading has been widely noticed as global warming trends increase in severity. With the swift expansion of intelligent manufacturing, digital applications have transformed production modes in agriculture, manufacturing, and services, influencing the regional industrial structure and carbon efficiency. According to the existing literature, the relationship between industrial structure and carbon efficiency is not unilaterally influencing but bidirectionally and interactively. On the one hand, quite a few studies have demonstrated that industrial structure upgrading improves carbon efficiency (Oliveira, Fleury & Fleury, 2021). On the other hand, industrial structure upgrading has a reverse impact on intelligent manufacturing (An, Zhou, Yu, Shi & Wang, 2021; Wang, Lu, Fan, Hu & Wang, 2022). Both are worthy of attention.
Much literature has demonstrated the significant impact of industrial structure upgrading on carbon efficiency improvement through empirical research. Most literature argues that there are dynamic relationships between industrial structure upgrading, economic growth, and carbon efficiency improvement (Dong, Xu & Fan, 2020). With the upgrading of the industrial structure, the mode of economic growth has changed from an extensive economy to an intensive economy, and the proportion of energy-intensive industries has decreased, which promotes regional carbon efficiency improvement (Deng, 2022); however, the structure currently includes low-level coordination of industrial structure upgrading and carbon efficiency improvement (Zhou, Zhang, Li, Ding & Wang, 2020). Therefore, the need to achieve a win-win situation between economic growth and carbon emission reduction through industrial structure upgrading is a critical problem that must be urgently addressed.
The proposition that carbon efficiency improvement can promote industrial structure upgrading has also been discussed in some studies. Carbon policies and environmental regulation have been found to stimulate enterprises to improve carbon efficiency significantly (An et al., 2021); thus, manufacturing competition tends to focus increasingly on technology and innovation, which can facilitate industrial restructuring (He, Wang, Xu, Cui & Chen, 2022). For an enterprise's long-term development, some heavy industries must change their development methods so that the manufacturing sector can extricate itself from the adverse effects of environmental constraints (Feng, Yang & Yang, 2018).
Conceptual frameworkBased on the above literature reviews, the impact of intelligent manufacturing on carbon efficiency improvement can be summarized in two ways: the innovation effect and the spillover effect. Intelligent manufacturing promotes low-carbon transition development through carbon efficiency improvement and industrial structure upgrading. The innovation effect is the direct influence of intelligent manufacturing on carbon efficiency, and the spillover effect is the indirect influence of intelligent manufacturing on carbon efficiency based on industrial structure upgrading.
Industrial structure upgrading and carbon efficiency improvement are mutually reinforcing. On the one hand, industrial structure upgrading promotes carbon efficiency improvement. As the proportion of tertiary industry increases and high-tech enterprises develop rapidly, higher production technology and operational efficiency generate lower energy consumption, significantly increasing regional carbon efficiency. Moreover, as the industrial structure shifts from labor-intensive to capital-intensive and knowledge-intensive, the amount of carbon emitted per unit of economic output will decrease. On the other hand, carbon efficiency improvement promotes industrial structure upgrading; thus, the higher carbon efficiency pressures traditional industries, making energy-intensive and low-value-added enterprises uncompetitive and forcing them to withdraw from the market. To reduce energy consumption, enterprises try to change production methods and increase productivity, which boosts the process of upgrading the industrial structure.
Furthermore, carbon efficiency improvement is the primary way to reduce carbon emissions. According to the existing literature, there are two main methods to reduce carbon emissions; one is changing the structure of energy use for the low-carbon energy transition and the other is raising energy efficiency, which contributes significantly to improving carbon efficiency (Li, Zhang & Zhou, 2021). As energy structure adjustment is a system engineering project that requires multi-departmental collaboration and key technological innovations, carbon efficiency improvement is currently the primary method for reducing carbon emissions (Zhao, Sun & Qin, 2022). Additionally, due to the lack of literature demonstrating the direct effect of industrial structure upgrading on carbon emissions, this paper assumes that achieving carbon emission reduction depends primarily on carbon efficiency improvement.
Therefore, a clear influence path of industrial structure upgrading on carbon emission reduction becomes apparent. In the process of industrial structure upgrading, traditional resource-intensive and labor-intensive enterprises are substituted by technology-intensive enterprises, which enable them to enhance labor productivity and energy utilization and promote regional carbon efficiency. Combined with realizing carbon emission reduction depends on carbon efficiency improvement, industrial structure upgrading promotes carbon emission reduction through carbon efficiency improvement.
Based on the above analysis, we construct a conceptual framework discussing the relationship among intelligent manufacturing, carbon efficiency, and industrial structure upgrading, a new perspective that differs from the existing literature. The framework for the influence pathway of intelligent manufacturing on low-carbon transition development is shown in Fig. 1.
Indicator measurements and data resourceThe measurement of carbon efficiency
Many researchers have contributed to the measurement of carbon efficiency. Chung, Färe and Grosskopf (1997) proposed the DDF and constructed the Malmquist–Luenberger (ML) index for the measurement of total factor productivity to consider environmental pollution originally. They assumed that the same proportion of desirable and undesirable outputs increase and decrease. Later, several researchers devoted themselves to the modified ML index (Fukuyama & Weber, 2009; Oh, 2010; Arabi, Munisamy, Emrouznejad & Shadman, 2014), constructing the global and biennial ML indices, which provided the necessary foundation for measuring carbon efficiency. Zhou, Delmas and Kohli (2017) defined non-angular and non-radial DDF, considering undesirable outputs of the environment. Afsharian and Ahn (2015) proposed the overall Malmquist index, which is a new approach for measuring productivity changes over time and solved the problem that environmental conditions such as technological level, economic environment, government regulation and policy orientation may be different in different periods so that efficiency measurement results have some errors.
Inspired by existing research, Shao, Fan and Yang (2022) proposed a new efficiency measurement model for carbon emission performance measurement based on the DEA method, which provides a critical measurement model for our research. Based on this research, we constructed a measurement model of carbon efficiency to avoid the unsolved problem of intertemporal mixed DDF.
First, we assume that in every decision-making unit, there are N kinds of input factors denoted by x=(x1,⋯⋯,xN), which produce M kinds of desirable outputs and I kinds of undesirable outputs that are denoted by y=(y1,⋯⋯,yM)and b=(b1,⋯⋯,bI), respectively. Therefore, in the phase t=1,⋯⋯,T, the input–output vector of DMUk(k=1,⋯⋯,K) can be written as (ykt,bkt,xkt). zkt is the weighting of each observed value in the cross-section for constructing the technology frontier. Based on these weights, the production possibility set can be expressed in Eq. (1).

Therefore, the non-angular and non-radial DDF based on the overall technology (D→0) can be expressed in Eq. (2) under energy and environment constraints.

In Eq. (2), wT=(wym,wbi,wxn) is the weight vector related to the number of outputs and inputs. β=(βmy,βib,βnx)T represent scale factors, which mean the possible proportion of expansion of desirable outputs and reduction of undesired outputs and inputs. g=(gy,−gb,−gx) is the direction vector, indicating that the expected directions of efficiency improvement are desirable output expansion and undesirable outputs and inputs reduction.
Thus, the t-th phase, D→0, can be obtained by solving the linear programming model, as shown in Eq. (3).

Determining the output and input factors is fundamental because the measurement method of carbon efficiency is based on the DEA model. We choose gross domestic product GDP (Y) and carbon emissions (C) as desirable and undesirable outputs, respectively, and consider capital (K), labor (L), and energy (E) as input factors. Referring to Zhang (2013), the direction vector was denoted as g=(Y,−C,−K,−L,−E), and the weight of desirable output, undesirable output, and input factors are set to13. The weights are equally distributed according to the specified number of desirable outputs, undesirable outputs, and input factors; thus, the weight vector can be set as wT=(13,13,19,19,19). If we substitute them into the formula, the D→0 can be calculated.
Finally, referring to the form of the Luenberger productivity indicator, the carbon efficiency (CE) of phase t + 1 is calculated in Eq. (4).

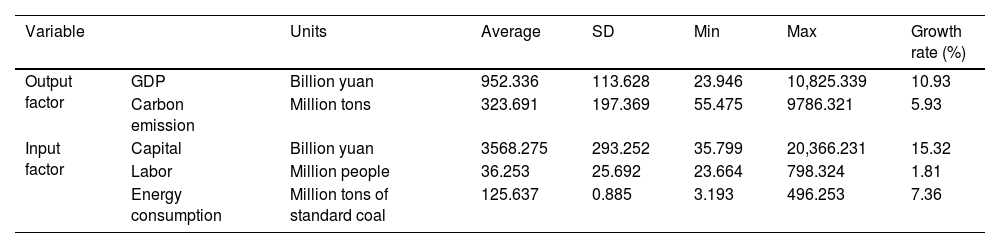
Based on the above formula, we can calculate the CE of every province with available data. The data used for CE calculation is from the China Statistical Yearbook and China Energy Statistical Yearbook. GDP (Y) and carbon emission (C) as output factors can be obtained directly. Input factors include capital, labor, and energy. Among them, capital input is measured by capital stock, estimated by the perpetual inventory method. The average annual employment measures labor input; energy input is represented by total energy consumption, which can be obtained directly. The descriptive statistics of each input and output variable are shown in Table 1.
Descriptive statistics of input–output variable data.
Source: Self-calculated with STATA 15.
The majority of existing literature often use an associated variable representing the capability of intelligent manufacturing, such as the fixed asset investment of the computer software industry (Borland & Coelli, 2017) and robot installation density (Liu, Chang, Forrest & Yang, 2020). However, the above methods have accuracy limitations because individual variables are difficult to cover the capability of intelligent manufacturing accurately. Some scholars propose establishing an indicator system assessing the regional development level of capability of intelligent manufacturing scientifically (Wu, Xu & Tang, 2020). Thus, we construct an indicator system for intelligent manufacturing from various dimensions and measure the intelligent manufacturing index with the entropy method.
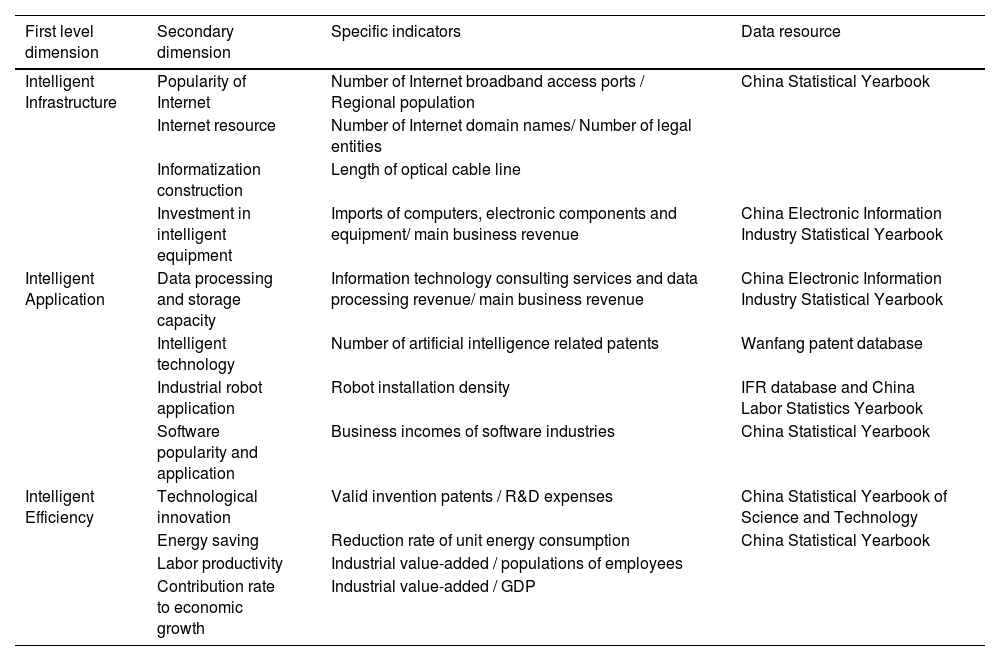
According to the “Outline of China's Manufacturing Industry Development (2015–2025),” intelligent manufacturing is an essential condition for China's high-quality development, so the intelligent manufacturing index focuses on the service capacity of intelligent technologies to promote manufacturing development. Referring to China's 14th Five-Year Plan for Intelligent Manufacturing Development and existing references (Sun & Hou, 2019; Wang, Jiang & Dong, 2022), this paper's indicator system of the intelligent manufacturing index is constructed from infrastructure, application, and efficiency three dimensions. First, intelligent infrastructure is the material premise for implementing intelligent manufacturing. Second, intelligent applications convey the main content of intelligent manufacturing, which is closely related to data processing, intelligent technology popularization, industrial robot application, and software upgradation. Third, intelligent efficiency is the goal of intelligent manufacturing, including innovation, environment, labor productivity, and economic growth.
Meanwhile, the measurement indicators were selected considering the available data, which can be obtained from the China Statistical Yearbook, the China Electronic Information Industry Statistical Yearbook, the China Labor Statistics Yearbook, and the International Federation of Robotics (IFR) and Wanfang patent databases. The detailed assessment indicators are described below.
- (1)
The intelligent infrastructure level includes the popularity of the internet, information resource collection, informatization construction, and investment in intelligent equipment. Informatization and digitalization are the foundation of intelligence (Li, Shi & Liu, 2019); therefore, intelligent manufacturing infrastructure includes internet-related conditions, such as internet popularity, internet resources, and informatization construction. The internet's popularity was measured by the number of internet broadband access ports divided by the regional population. Information resources were calculated from the number of internet domain names divided by the number of legal entities, referring to Guo and Luo (2016). The length of the optical cable line reflects informatization construction. Furthermore, limited to data availability, we select the imports of computers, electronic components, and equipment divided by the primary business revenue reflecting the investment in intelligent equipment.
- (2)
The intelligent application level includes data processing and storage capacity, intelligent technology, industrial robot application, and software popularity and application, reflecting intelligent manufacturer's content (Oztemel & Gursev, 2020). Data processing and storage capacity is calculated from information technology consulting services and data processing revenue divided by the primary business revenue. Due to a lack of data, the popularity of intelligent technology was reflected by the number of artificial intelligence-related patents from the Wanfang patent database using Python. According to the criteria of intelligent manufacturing provided by Acemoglu and Restrepo (2020) and the “Artificial Intelligence Index Report 2021″ published by Stanford University, we determined the keywords for Python, which can ensure the accuracy of the result. Furthermore, limited data availability, software popularity, and application are represented by the business incomes of software industries. Furthermore, industrial robot application is the most appropriate index reflecting the application level of intelligent manufacturing, but the related data at the provincial level are unavailable. We measure the industrial robot application by robot installation density to solve this problem. It is calculated from the number of robots installed multiplied by the proportion of employment in each industry. The data was obtained from the IFR database and the China Labor Statistics Yearbook.
- (3)
The intelligent efficiency level includes technological innovation, energy saving, labor productivity, and contribution rate to economic growth, which reflect the goal of intelligent manufacturing (Matyushok et al., 2021). Calabrese et al. (2020) argued that the manufacturing industry must be successfully transformed to achieve the goals of productivity, quality, profitability, resource efficiency, material circularity, and agility; thus, we select some with significant impact on high-quality development as dimensions of the efficiency level indicated below. Technological innovation was calculated from valid invention patents divided by research and development (R&D) expenses. The reduction rate of unit energy consumption reflected energy saving. Labor productivity was measured by industrial value-added divided by populations of employees. We calculated the contribution rate to economic growth by dividing the industrial value-added by GDP. The indicator system of the intelligent manufacturing index is shown in Table 2.
Table 2.Indicator system of intelligent manufacturing index.
Source: Self-formulated.
The measurement methodology for intelligent manufacturing includes the following two steps. First, we make data dimensionless by the method of linear normalization. Second, we calculate the total score of the intelligent manufacturing index by the ways of principal component analysis method referring to Chao and Ren (2011) and the improved entropy method referring to Ran et al. (2021) and Hou, Zhou, Zhang and Yang (2021). Comparing the principal component analysis method and the entropy method shows that although there are significant differences in result value calculated by the two different methods, the rankings of provinces are almost the same or with slight changes. This result verifies the robustness of the indicator system of the intelligent manufacturing index. Considering that there is no sense to distinguish the different values of the two methods, the following research only uses the entropy method's result.
The measurement of industrial structure upgradingIndustrial structure advancement is an essential dimension of industrial structure transformation and upgrading. There have been well-stablished measure methods for industrial structure advancement from existing research (Ngai & Pissarides, 2007; Krüger, 2008). It is a common index used in the existing literature to measure the industrial structure advancement with the proportion of output value of the non-agricultural industry or the ratio of the output value of the tertiary industry to the secondary industry (Gan, Zheng & Yu, 2011). Another way to measure industrial structure advancement is calculated by the product of the output share of each industrial sector and labor productivity, which was widely used to present the level of industrial structure upgrading in recent research (Yuan &, Zhu,2018; Liu, Xu & Zhang, 2022).
This paper chooses to use the second calculation method of industrial structure advancement, which can directly and quantificationally convey the level of upgrading and innovation of traditional industrial production technology and meet the requirement for expressing the impact of intelligent manufacturing on industrial upgrading in this research. Referring to Han, Huang and Wang (2017), the calculation formula is shown in Eq. (5), indicating that when industries with high labor productivity and high technology occupy a larger proportion in a region, the regional industrial structure advancement is higher.

In Eq. (5)Yit presents the total output of industry I at time t. LPitis the labor productivity of industry I at time t and LPif is the labor productivity of industry I after completing industrialization. The selection of LPif refers to the industrial structure standardization stage model of Han, Huang and Wang (2016). N is the total number of industrial sectors. The data above can be obtained from the China Statistical Yearbook and the China High-tech Industry Statistical Yearbook from 2006 to 2020.
Model specifications and descriptive statisticsModel specificationAnalyzing the relationship between any two variables in a pooled regression model is incorrect due to the interactional and dynamic relationships among intelligent manufacturing, carbon efficiency, and industrial structure upgrading. Few studies have researched the relationship among these variables, so it is difficult to determine their causality; therefore, we select a PVAR model for our research. This approach can reflect the effect of each variable on the other and does not need to consider the theoretical relationship between variables. The PVAR model is proposed based on the vector autoregressive (VAR) model, with the advantages of both panel data analysis and the VAR model, which can increase the degree of freedom of observation and control individual heterogeneity (Love & Zicchino, 2006). All variables are endogenous in the standard PVAR model, making it convenient to analyze the influence of each variable and its lag variable on other variables. Referring to Abrigo and Love (2016), we construct the following PVAR model to empirically differentiate the transmission mechanisms of intelligent manufacturing to carbon efficiency and industrial structure upgrading.

Eq. (6) shows that this model lags p orders. α0 represents the vector of intercept term and αj expresses the autoregressive parameters of j-th order lag. yit represents the vector of the dependent variable and yit=[IM,CE,Upindu] denotes the vector of the intelligent manufacturing index, carbon efficiency, and the level of industrial structure upgrading in each province or city I at each year t. Furthermore, Fi,t represents the vector of exogenous covariates and A is the parameter to be estimated. This paper determined the degree of higher education agglomeration (edu) as an exogenous variable, which was measured by dividing the logarithms of the administrative area into the logarithms of the number of regional colleges and universities. Furthermore, χi is the individual fixed effect of each province and city, reflecting the individual heterogeneity of each sample on the cross-section. ηt is a time effect, which reflects the time trend of each variable. εit represents idiosyncratic errors that follow a normal distribution.
The sample was divided into two groups to compare the difference in impact pathways between high-tech and traditional industries. Given the proportion of high-tech industries’ output value to GDP in each province in 2020, the provinces were classified as being dominated by high-tech or traditional industries. The output value of high-tech industries can be obtained from the China High-tech Industry Statistical Yearbook. The top 15 provinces were classified as those dominated by high-tech industries, including Guangdong, Jiangsu, Beijing, Zhejiang, Shanghai, Tianjin, Chongqing, Hubei, Fujian, Shandong, Henan, Hunan, Sichuan, Jiangxi, and Anhui. The rest were classified as provinces dominated by traditional industries.
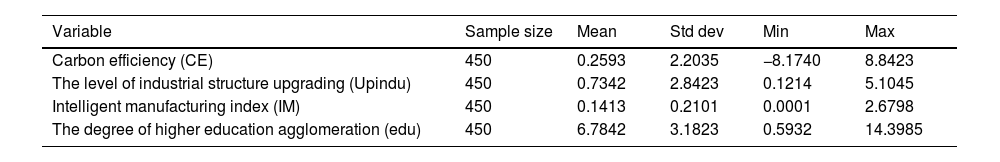
Descriptive statisticsBased on the measurement of CE, the level of industrial structure upgrading (Upindu), intelligent manufacturing index (IM), and the agglomeration degree of higher education (edu) as shown above; furthermore, Table 3 presents a summary of the descriptive statistics of this study's variables. The mean value of CE is 0.2571 and the minimum and the maximum values are −8.1740 and 8.8740, respectively, indicating that the variables of these samples are highly dispersed around the mean. Similarly, the dispersion degree of Upindu, IM, and edu is also high, implying a pronounced difference among 30 provinces and cities.
Descriptive statistical analysis.
Source: Self-calculated with STATA 15.
The correlation among the variables is presented in Table 4. Significant and positive correlations exist among carbon efficiency, the level of industrial structure upgrading, the IM index, and the degree of higher education agglomeration. Notably, the correlation coefficient of higher education agglomeration and industrial structure upgrading reaches up to 0.7374, and the correlation coefficient of carbon efficiency and industrial structure upgrading reaches up to 0.6412, indicating a close relationship between them that is worth investigating.
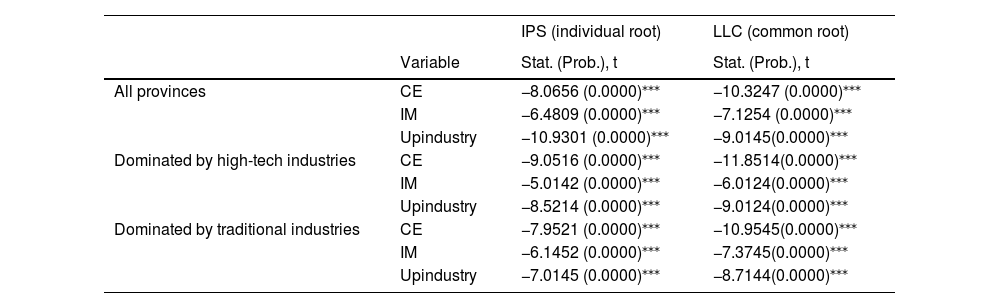
Empirical resultsStationarity test and model selection procedureThe application of the PVAR model generally includes a stationarity test, optimal lag selection, causality analysis, impulse-response stage, and variance decomposition. Before starting the empirical analysis, we must investigate whether all variables are stationary at the level or the first difference. The IPS and LLC panel unit root tests’ results are reported in Table 5, showing that all variables are stationary at the first level in the sample with all provinces, the sample with the province dominated by high-tech industries or the sample with the province dominated by traditional industries. This result indicates that stationary conditions allow the PVAR mode to analyze the dynamic relationship among carbon efficiency, IM index, and industry structure upgrading.
Unit root test results.
| IPS (individual root) | LLC (common root) | ||
|---|---|---|---|
| Variable | Stat. (Prob.), t | Stat. (Prob.), t | |
| All provinces | CE | −8.0656 (0.0000)⁎⁎⁎ | −10.3247 (0.0000)⁎⁎⁎ |
| IM | −6.4809 (0.0000)⁎⁎⁎ | −7.1254 (0.0000)⁎⁎⁎ | |
| Upindustry | −10.9301 (0.0000)⁎⁎⁎ | −9.0145(0.0000)⁎⁎⁎ | |
| Dominated by high-tech industries | CE | −9.0516 (0.0000)⁎⁎⁎ | −11.8514(0.0000)⁎⁎⁎ |
| IM | −5.0142 (0.0000)⁎⁎⁎ | −6.0124(0.0000)⁎⁎⁎ | |
| Upindustry | −8.5214 (0.0000)⁎⁎⁎ | −9.0124(0.0000)⁎⁎⁎ | |
| Dominated by traditional industries | CE | −7.9521 (0.0000)⁎⁎⁎ | −10.9545(0.0000)⁎⁎⁎ |
| IM | −6.1452 (0.0000)⁎⁎⁎ | −7.3745(0.0000)⁎⁎⁎ | |
| Upindustry | −7.0145 (0.0000)⁎⁎⁎ | −8.7144(0.0000)⁎⁎⁎ |
Source: Self-calculated with STATA 15.
The null hypothesis of a unit root, t, denotes a deterministic component and implies that individual intercept and trend probability values are reported in parentheses; automatic lag length selection is based on Bayesian information criteria (SIC).
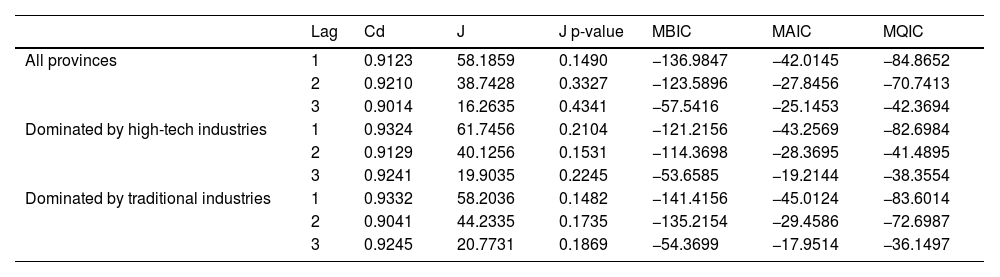
The second step is to determine the most appropriate delay. It is required to select the optimal lag length with the application of moment Bayesian information criteria (MBIC), moment Akaike information criteria (MAIC), and moment Hannan–Quinn information criteria (MQIC); thus, PVAR model analysis is tested following the optimal delay in both PVAR specification and moment conditions. According to the criteria set by Andrew and Lu (2001), Table 6 indicates that the first-order lag with the smallest value of MBIC, MAIC, and MQIC coefficients is selected as the most appropriate delay, and the results are the same in the samples with all provinces, the sample with the province dominated by high-tech industries or the sample with the province dominated by traditional industries,
Panel VAR lag order selection.
Source: Self-calculated with STATA 15.
Based on the optimal lag length, the unit root test based on the roots of the companion matrix is provided in Fig. 2. In the sample with all provinces, the result of the stationarity study based on unit root analysis showed that the moduli of all eigenvalues are 0.9314, 0.8536, and 0.3879. These values are less than 1 and illustrate the stability condition, as demonstrated in Fig. 2(a). As for the provinces dominated by high-tech industries and those dominated by traditional industries, the moduli of all eigenvalues are all less than 1, as demonstrated in Fig. 2(b) and (c). Therefore, all variables used in this research are within the unit circle at the first level, and the stability condition is satisfied in three different samples.
Results of the PVAR and Granger causality test
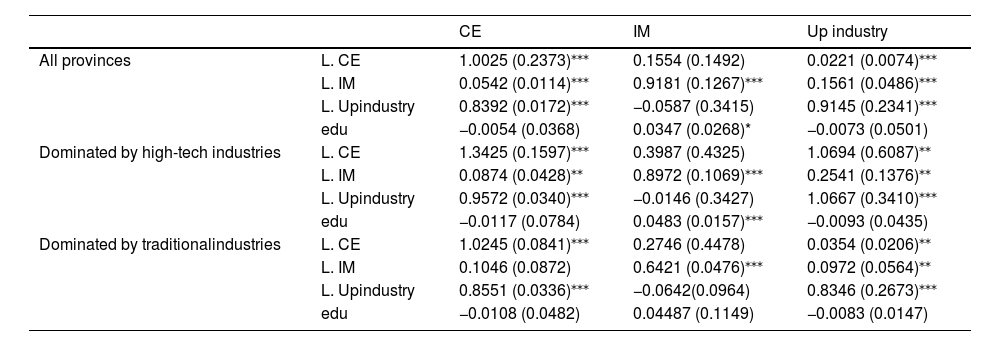
After determining the most appropriate delay and testing the stability of the variables included in the model, PVAR analysis can be implemented. Holtz-Eakin, Newey and Rosen (1988) and Dogan, Chishti, Alavijeh and Tzeremes (2022) suggested that the PVAR model was estimated using GMM-style instruments to make the result more efficient because the instrument lags with missing values are replaced with zeros so that the number of estimation samples increases. The results of the PVAR regression analysis are shown in Table 7; the variables on the horizontal axis represent the dependent variables and those on the vertical axis represent explanatory lagged values.
PVAR model regression results.
Source: Self-calculated with STATA 15.
*, **, and *** denote 10%, 5%, and 1% statistically significance levels, respectively. Robust standard errors are in parentheses.
Table 7 shows that in the sample with all provinces, the previous period of the IM index affects carbon efficiency and industrial structure upgrading significantly and positively both on the 0.01 significance level. This result means that IM contributes to promoting carbon efficiency and industrial structure upgrading statistically. If IM increases per unit, the carbon efficiency increases by 0.05, and the level of industrial structure upgrading increases by 0.16; thus, IM seems to have more impact on industrial structure upgrading. The empirical results for provinces dominated by high-tech industries are substantially similar to those in the sample above. IM can increase productivity and realize lean production so enterprises can reach energy conservation targets, thereby improving carbon efficiency. Meanwhile, as machines replace a significant number of cheap laborers, more and more workers seek job opportunities or become self-employed in the tertiary industry; thus, the proportion of tertiary industry improves. Furthermore, intelligent technologies enable manufacturing firms to obtain innovation support from the supply chain upstream and downstream, which benefits industry transformation and upgrading.
Nonetheless, the IM index has no significant impact on carbon efficiency in the sample with provinces dominated by traditional industries. Presumably, it is because the application scope of intelligent technologies is limited to individual enterprises producing high-value-added commodities, which occupy a small proportion in the provinces dominated by traditional industries. As traditional industries are little affected by IM, no significant relationship exists between the IM index and carbon efficiency in provinces dominated by traditional industries; therefore, intelligent manufacturing does not promote carbon efficiency.
The results from all three samples consistently show that carbon efficiency and industrial structure upgrading can affect each other mutually, but carbon efficiency and industrial structure upgrading do not affect the IM index significantly. This finding might be because the improvement in the IM index mainly depends on the investment of intelligent equipment, and there is no transmission mechanism from carbon efficiency to intelligent equipment investment. Additionally, as intelligence is not the only way to upgrade the industrial structure, it remains uncertain whether the investment in intelligent equipment can be improved with the industrial structure upgrading; therefore, industrial structure upgrading cannot significantly promote the IM index.
Furthermore, in the sample with all provinces and the sample with provinces dominated by high-tech industries, the degree of higher education agglomeration as an exogenous variable affects IM positively and significantly at 10% and 1% levels, respectively; however, there is no significant effect on carbon efficiency improvement and industrial structure upgrading. A delayed effect may interfere with the impact of higher education resources on carbon efficiency and industrial structure upgrading; however, higher education resources directly affect IM capacity because universities provide highly qualified labor for enterprises promoting the popularization of intelligent technologies.
To further determine the causality among these three variables, we complete the Granger causality Wald test among the variables. Table 8 reports the empirical results of the Granger causality test in the sample with all provinces, showing that IM Granger causes carbon efficiency at a 5% significance level. Moreover, carbon efficiency and industrial structure upgrading Granger cause each other. Furthermore, carbon efficiency and industrial structure upgrading do not Granger cause IM. Therefore, although positive relationships exist among IM, carbon efficiency, and industrial structure upgrading, only intelligent manufacturing Granger causes carbon efficiency and industrial structure upgrading. Additionally, carbon efficiency and industrial structure upgrading Granger cause each other mutually, verifying the conceptual framework proposed previously.
Results of the PVAR Granger causality test.
Source: Self-calculated with STATA 15.
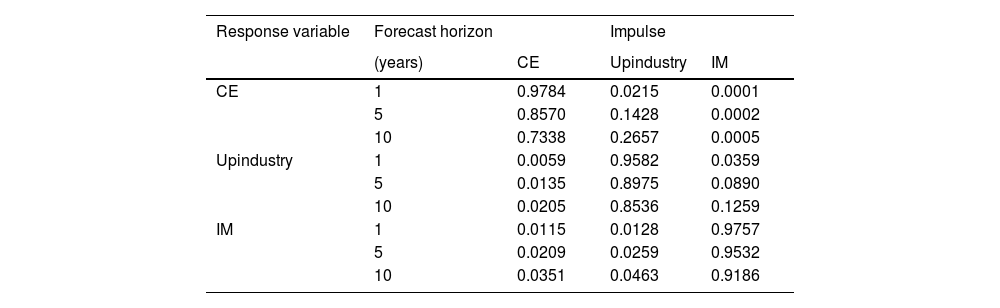
To obtain the causal ordering condition for variables, we completed the forecast error variance decomposition proposed by Abrigo et al. (2016). Table 9 shows that the carbon efficiency is self-explanatory by 98% in the first year, but the magnitude of self-explanation decreases as time passes; conversely, the effect from other variables increases. With time, carbon efficiency is self-explanatory by an average of 86% in 10 years. Furthermore, industrial structure upgrading was determined as the variable that explains the most, which explained 14.3% on average in 10 years, while the IM index only explained 0.4% on average over the same period, which explains little. Therefore, the spillover effect plays a more critical role in carbon efficiency improvement than the innovation effect. This result may occur from the lack of innovation in most traditional manufacturing enterprises at the present stage. Therefore, IM mainly promotes carbon efficiency through industry structure upgrading, which was determined as the variable that primarily explains the carbon efficiency improvement.
Variance decomposition.
Source: Self-calculated with STATA 15.
Similarly, industrial structure upgrading and IM were explained by themselves mainly. The total variation in IM was explained by carbon efficiency (3.5%) and industrial structure upgrading (4.6%) over the 10 years. The total variation in industrial structure upgrading was explained by carbon efficiency (2.1%) and IM (12.6%) over the study period, which means that IM holds a more significant place in industrial structure upgrading.
Furthermore, the IRFs analysis with 95% confidence bands was generated using 200 Monte–Carlo draws based on the previously estimated models. Fig. 3 shows a clear picture of impulse-response graphs, indicating the interaction relationship between variables and demonstrating the situation that occurs in the medium term. Positive relationships exist among carbon efficiency, IM, and industrial structure upgrading. When these variables were shocked by themselves, the effect was significant and positive, and it gradually weakened with time, which resulted from the economy's inertia.

Additionally, comparing these impacts, the shock from industrial structure upgrading to carbon efficiency is strongest, implying that industrial structure upgrading contributes significantly to carbon efficiency improvement. This result may occur because some traditional and pollution-intensive industries are equipped with intelligent technologies but keep the original production mode with high carbon emissions so that an intelligent index cannot promote carbon efficiency consequentially, which is a kind of innovation effect failure. Only when the industry structure is upgraded will intelligent technologies promote more efficient carbon efficiency, so the spillover effect is vital to the low-carbon transition. This explanation was verified in Table 7, where the impact of IM on carbon efficiency is insignificant in the sample with the provinces dominated by traditional industries.
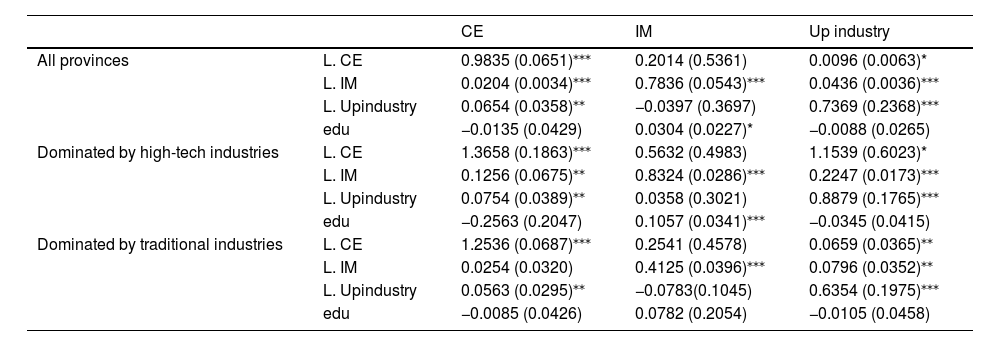
Robustness test based on proxy variableTo further investigate the robustness of the PVAR model, as suggested by previous studies (Aslan, Ocal, Ozsolak & Ozturk, 2022), we complete the robustness test based on a proxy variable. In the following robustness test, the level of industrial structure upgrading was measured by another method, which was regarded as a proxy variable in this robustness test. The proportion of the tertiary industry's output value to the secondary industry's output value was calculated as the level of industrial structure upgrading, another measuring method of industrial structure advancement proposed by Gan et al. (2011). The IM and carbon efficiency were measured using the original method.
The empirical research steps are the same as the previous, and we have a complete stationarity test, optimal lag selection, and causality analysis with a proxy variable. According to the PVAR model regression results in Table 10, IM significantly contributes to promoting carbon efficiency and industrial structure upgrading. Although the regression coefficient changes, the significance level and the direction of influences is basically consistent with the previous. Furthermore, the Granger causality test shows that IM Granger causes carbon efficiency and industrial structure upgrading; carbon efficiency and industrial structure upgrading Granger cause each other mutually. Therefore, the result of the robustness test remains the same, which means that the robustness and convincing of the PVAR model regression results can be demonstrated.
Robustness test results based on proxy variable.
Source: Self-calculated with STATA 15.
*, **, and *** denote 10%, 5%, and 1% statistically significance levels, respectively. Robust standard errors are in parentheses.
The PVAR model based on GMM estimations reveals that IM contributes significantly to promoting carbon efficiency and industrial structure upgrading. Therefore, there are two pathways of IM on carbon efficiency, summarized as the innovation and spillover effect in this paper. The economic reason and intuition behind the two effects can be explained as follows. On the one hand, IM requires enterprises to innovate, which enables manufacturing enterprises to improve productivity, save resources and energy, and achieve innovation in production mode so that carbon efficiency can be promoted directly and significantly. On the other hand, several workers are replaced by machines and robots with the development of IM, leading to the transition of labor from manufacturing to the service sector and industrial upgrading from labor-intensive to technology-intensive industries so that the industrial structure can be upgraded. A detailed review of spillover and innovation effects from the empirical results is concluded as follows.
First, the empirical results show that the impact of IM on carbon efficiency is mainly through industrial structure upgrading. While IM contributes significantly to both carbon efficiency and industrial structure upgrading, IM appears to have a greater impact on industrial structure upgrading, as demonstrated by the regression coefficient comparison. Combined with the result that industrial structure upgrading promotes carbon efficiency, there is a clear influence path that IM impacts carbon efficiency through industrial structure upgrading.
Second, the spillover effect is more important in developing low-carbon transitions. According to the variance decomposition, industrial structure upgrading was identified as a variable that explains the carbon efficiency the most, suggesting that industrial structure upgrading impacts carbon efficiency more obviously than intelligent manufacture. Meanwhile, industrial structure upgrading is explained by IM at a relatively more considerable degree with time; thus, a clear influence path can be shown that IM promotes carbon efficiency improvement mainly through industrial structure upgrading. Therefore, spillover effects can be inferred to have a more significant impact on the low-carbon transition than innovation effects.
Third, the innovation effect will fail in traditional industries, and the spillover effect will be more widespread than the innovation effect. As empirical results show no significant impact of IM on carbon efficiency in the sample with provinces dominated by traditional industries, intelligent manufacturing will not directly promote carbon efficiency in traditional industries; hence, it has been demonstrated that it is inefficient for intelligent manufacturing to be popularized in traditional industries. Furthermore, according to IRFs, although all the impacts on each other are positive, the shock from the industrial structure upgrading to carbon efficiency is strongest, thus confirming the importance of industrial structure upgrading.
ConclusionAchieving low-carbon transition development by IM is a key point for balancing economic growth and carbon emission reduction. This study explores whether IM can promote low-carbon transition development. A conceptual influence pathway was proposed, and the dynamic linkages among IM, carbon efficiency, and industrial structure upgrading were investigated by the PVAR model, based on a panel data set of 30 provinces in China from 2006 to 2020. The empirical results show that IM significantly promotes carbon efficiency and industrial structure upgrading with the innovation and spillover effect. The variance decomposition results show that industrial structure upgrading was determined as a variable that explains the carbon efficiency the most and industrial structure upgrading was significantly affected and explained by IM. Furthermore, IM promotes carbon efficiency improvement mainly through industrial structure upgrading. Therefore, the spillover effect plays a more significant and widespread role in low-carbon transition than the innovation effect.
Notably, IM has no significant impact on carbon efficiency in the sample with the provinces dominated by traditional industries, which means that the innovation effect will be invalid in traditional industries. Therefore, IM cannot be propelled blindly, and it is inappropriate for some traditional industries to realize intelligent transformation, which can promote carbon efficiency but improve production costs. Furthermore, as the impact of IM on industry structure upgrading is always significant and positive, the spillover effect plays a more comprehensive and widespread role in the impact pathway; thus, it is necessary to emphasize the importance of industry structure upgrading.
Some policy implications are proposed to improve the IM index and promote low-carbon development. (1) It will be helpful to take advantage of IM to accelerate the industry structure upgrading. It is of great significance to develop industrial, fiscal, and financial policies to support upgrading industrial structures. (2) We should take a step-by-step approach to achieve a low-carbon transition. Especially for traditional industries, upgrading the industry structure is an important step that should be prioritized in a low-carbon transition. (3) It is required to promote technological innovation, which provides academic support for IM. It is necessary to increase the total amount of R&D investment, which provides a fund guarantee to strengthen independent innovation in key technologies and fields.
Our study has been limited by the availability of an intelligent enterprise index, so we can only use provincial panel data to estimate the impact of IM on carbon efficiency, which is imprecise. As the provincial IM index and carbon efficiency might be affected by extreme values, the results may be biased in some provinces without even distribution of the IM index. Further research should try to construct an intelligent enterprise index with available data so that micro-data can be used in research.