


Despite the growing interest in Blockchain Innovation (BI), there is a lack of research on its predictors. This study draws on the policy uncertainty literature to hypothesize the positive influence of economic policy uncertainty (EPU) and cryptocurrency policy uncertainty (UCRY Policy) on country-level BI, determined by the total number of blockchain patents in a country. We tested our hypotheses using a two-level sample of 126 quarterly observations nested in five countries: Australia, China, Japan, Korea, and the United States. The results confirm our expectation that the EPU and UCRY Policy lead to an enhanced BI. Moreover, we found that the UCRY Policy is more impactful on BI than EPU, and that when examining the two policy uncertainty indicators simultaneously, the effect of EPU on BI becomes insignificant. This study has important implications for policymakers and investors.
Blockchain technology refers to “a decentralized, transactional database technology that facilitates validated, tamper-resistant transactions that are consistent across a large number of network participants” (Beck et al., 2018, p. 1020). Due to features such as decentralization and transparency, this technology facilitates innovation and radical changes in various fields such as crowdfunding, intellectual property, and supply chains (see Agi & Jha, 2022; Aslam et al., 2021; Chen, 2018). Scholars have sought to understand Blockchain Innovation (BI) by analyzing (the number of) patents in which inventions and/or innovative outputs are developed, in addition to blockchain technology (e.g., Bamakan et al., 2021; Dehghani et al., 2021; Wan et al., 2022). However, given that blockchain research is new and highly conceptual (Toufaily et al., 2021; Xu et al., 2019), we lack empirical insights into the factors that facilitate or hinder blockchain adoption in developing innovation. We argued that understanding these factors is crucial for the global adoption of blockchain technology, which translates into the success of this novel technology (Toufaily et al., 2021).
In this study, we examine BI by analyzing the total number of blockchain patents in five different countries, namely: Australia, China, Japan, Korea, and the United States, which are the top five countries in terms of BI, from 2010 to 2022. Our study empirically tests whether economic policy uncertainty (EPU) (Baker et al., 2016) and cryptocurrency policy uncertainty (UCRY Policy) (Lucey et al., 2022) influence countries’ BI. We expected that both types of policy uncertainty translate into an enhanced BI in these countries. With this focus, we contribute to the policy uncertainty and innovation literature in three ways.
First, our study extends research on the EPU – innovation relationship in the context of blockchain technology. There are two views on the relationship between uncertainty and innovation. On the one hand, the strategic growth option theory (e.g., Kulatilaka & Perotti, 1998) suggests that during uncertain periods, firms tend to accelerate technological innovation to achieve their strategic investment initiatives, which in turn improves their competitive advantages in the future (Guan et al., 2021). On the other hand, according to the real option theory by Bloom (2014), firms have two different real options during periods of high uncertainty: either invest (innovate) or “wait and see.” From a theoretical perspective, we are aware of the inconclusive empirical findings of this line of research on the indication of the relationship between EPU and innovation. For instance, some scholars find that EPU is negatively related with innovation (e.g., Lou et al., 2022; Xu, 2020), whereas others find a positive relationship between these two variables (e.g., He et al., 2020; Xu & Yang, 2021). Our study contributes to the debate by highlighting the positive association between EPU and BI.
Second, we advanced the line of research that examines the new concept of UCRY Policy developed by Lucey et al. (2022). More specifically, scholars have adopted the UCRY Policy index to examine its relationship with outcomes such as cryptocurrency volatility/returns (e.g., Karaömer, 2022), investment flows (e.g., Yan et al., 2022), and market co-crashes (e.g., Dai et al., 2022). However, we could not identify empirical studies that tested the relationship between the UCRY Policy and the number of blockchain patents in a country (i.e., BI). Thus, the results of our study extend the role of UCRY Policy in predicting blockchain-specific innovation activities.
Third, while studying EPU and UCRY Policy simultaneously, our study reveals whether UCRY Policy is more impactful on BI than EPU. This has been an important and relevant issue in the uncertainty literature since recent research has suggested that the UCRY Policy predicts crypto-specific phenomena better (e.g., co-crashes of cryptocurrency markets and stock markets) than the EPU policy (see Dai et al., 2022). Our results offer implications for the types of policy uncertainty that practitioners must consider when developing innovation in the blockchain context.
Theoretical background and hypothesesInnovationScholars have studied innovation across various levels of analysis such as individuals, teams, organizations, and countries. At the individual level, Wu et al. (2011, p. 1513) defined innovation as an “individuals’ intentional efforts to create, introduce, and apply new ideas” (see also Janssen, 2000). At the team level, innovation is concerned with a team's generation and implementation of new ideas, products, and services, (Eisenbeiss et al., 2008; Hülsheger et al., 2009; van Knippenberg, 2017). In the individual and team innovation literature, researchers attempt to distinguish between innovation and creativity such that while both concepts involve the generation of novel ideas, innovation is further concerned with the implementation of these ideas (e.g., Dul & Ceylan, 2014; Hülsheger et al., 2009). Dul and Ceylan (2014) suggested that creativity can be considered an important antecedent of innovation, given that innovation starts with the creation of new or novel ideas. At the organizational or firm level, scholars define innovation as the generation, adoption, and implementation of new ideas, practices, systems, and policies within an organization (e.g., Damanpour, 1991; Thompson, 1965; Wan et al., 2005). However, country-level innovation has not been thoroughly defined despite numerous innovation studies at this level (e.g., Dakhli & De Clercq, 2004; Mrożewski & Kratzer, 2017; Raghupathi & Raghupathi, 2017). These studies instead examine country-level innovation via different proxy variables such as number of patents (e.g., Dakhli & De Clercq, 2004; Raghupathi & Raghupathi, 2017; Saldanha et al., 2021), global competitiveness index (e.g., Mrożewski & Kratzer, 2017), as well as expenditures for research and development activities (e.g., Dakhli & De Clercq, 2004).
Focusing on country-level innovation, we consider the number of patents as an indicator of innovation. There are rationales from past research on the use of patent statistics as a measure of country-level innovation (e.g., Dakhli & De Clercq, 2004; Nagaoka et al., 2010). Specifically, the number of patents is an important representation of a country's innovative output, as it reflects the level of a country's technological activities that generate novel, useful, and inventive steps in the technology field (Dakhli & De Clercq, 2004). According to Nagaoka et al. (2010, p. 1085), “patents have been the only source of valuable information on new technology, which is screened in a systematic manner by using a considerable amount of resources by governments over a long period of time.” Furthermore, the number of patents has been used to assess innovation at the team (e.g., Peltokorpi & Hasu, 2014) and organizational levels (e.g., Boxu et al., 2022; Kivimäki et al., 2000; Zuo & Lin, 2022). Moreover, recent blockchain studies have begun using the number of patents to understand innovation in the context of blockchains (Bamakan et al., 2021; Dehghani et al., 2021; Wan et al., 2022). Overall, these studies have made the number of patents a widely accepted measure of innovation.
There is ample evidence that country-level innovation varies as a function of time, economic aggregate or growth, investment, and trade openness (Furman et al., 2002; Galindo & Méndez, 2014; Waguespack et al., 2005). For instance, recent studies have documented rapid growth in patent quality and applications over time in various countries (e.g., Alam et al., 2022; Bamakan et al., 2021; Fisch et al., 2016). Moreover, scholars consistently observed a positive link between country-level innovation and economic aggregates and/or growth (Amsden & Mourshed, 1997; Furman et al., 2002; Galindo & Méndez, 2014). Economic aggregate/ growth is generally represented by a country's gross domestic product (GDP) or GDP growth rate. For example, Galindo and Méndez (2014) documented that the GDP positively affects entrepreneurs’ innovation activities in advanced economies. Similarly, Furman et al. (2002) investigated the factors affecting national innovative capacity and documented that, other things being equal, a 10% rise in GDP is related to more than a 10% increase in international patents. Trade liberalization- and globalization-related factors also drive a country's innovation (Krammer, 2009; Navas, 2015; Taylor & Wilson, 2012). For example, Waguespack et al. (2005) found that a country's trade openness, measured by total exports and imports to GDP, is significantly related to national innovation. They also documented in their study a significant relationship between a country's fixed investment level and its innovative output (i.e., patents). Although not the focus of our study, we built on this literature to examine time, GDP, trade openness, and fixed investment as control variables in our country-level BI model. In the next section, we discuss EPU and UCRY Policy and model them as important predictors of BI.
Economic policy uncertainty (EPU)Recently EPU has attracted significant attention from regulators, firms, and investors because of its significant impact on the economy at the micro and macro levels (Al-Thaqeb & Algharabali, 2019; Baker et al., 2016; Cheng et al., 2021; Gulen & Ion, 2016). At the micro level, EPU influences firms’ cash holdings (Duong et al., 2020; Phan et al., 2019), trade credit (Jory et al., 2020), investments (Gulen & Ion, 2016), and M&A activities (Nguyen & Phan, 2017). From a macroeconomic perspective, EPU affects a country's unemployment (Caggiano et al., 2017), inflation (Leduc & Liu, 2016), GDP growth rate (Balcilar et al., 2016), monetary effectiveness (Balcilar et al., 2017), future economic growth (Handley & Limão, 2015), and recession (Karnizova & Li, 2014). Many studies show consistent results regarding the negative impact of EPU on various economic activities and/or firm behaviors.
Although much recent research seems to focus on firm-level innovation in China and the United States, EPU has been found to influence innovation. Scholars have reported inconclusive findings across different contexts and innovation types. On the one hand, Xu (2020) showed that high EPU hinders innovation in U.S. firms. Lou et al. (2022) also found that EPU negatively influences the innovation output of Chinese listed firms. On the other hand, He et al. (2020) showed evidence of a positive relationship between EPU and firm innovation in China. According to He et al. (2020), waiting during policy uncertainty can prevent firms from gaining opportunities to seize the market, leading to more losses than innovation costs. Thus, firms prefer to innovate during EPU periods. Similarly, Xu and Yang (2021) showed that EPU can improve China's green innovation (to a threshold). Guan et al. (2021) examined listed firms in China and reported a negative relationship between EPU and corporate business model innovation, finding a positive relationship between EPU and corporate technological innovation. Overall, building on existing studies, the mixed findings on the relationship between EPU and innovation suggest that EPU can be a risk and an opportunity (Guan et al., 2021). In addition, although EPU may adversely influence various economic activities, it provides opportunities for people and firms to innovate in certain areas, such as technological innovation (Guan et al., 2021; Tajaddini & Gholipour, 2021).
In this context, we argued for a positive relationship between EPU and technological innovations such as blockchain technology. Following previous research that examines policy uncertainty, we adopted the real option and strategic growth option theories (e.g., Cui et al., 2021; Guan et al., 2021; Tajaddini & Gholipour, 2021; Vo & Le, 2017) to develop an argument for the positive relationship between EPU and BI. According to real option theory, during periods of high EPU, firms have two real options: “wait and see” or invest (Bloom, 2014). Specifically, firms may choose the waiting option that postpones innovation to avoid costly mistakes and wait for additional information about the future (Cui et al., 2021). However, if they choose to wait to avoid mistakes, they may lose the opportunity to gain market power/share with their competitors (He et al., 2020). This is particularly relevant in technology-related fields such as blockchain, given their rapid evolution and high levels of competition (Daim et al., 2020). Indeed, Bloom (2014) suggested that the waiting option would end when firms compete, “perhaps to be the first to patent a new idea or launch new product” (p. 163). In addition, as argued by the strategic growth option theory (e.g., Kulatilaka & Perotti, 1998), firms tend to accelerate technological innovation to achieve their strategic investment initiatives, which in turn improves their competitive advantages in the future (Guan et al., 2021). Thus, those who would like to gain a competitive advantage in this field are motivated to engage in more technological innovation, even during periods of policy uncertainty. Based on the rationale in this study, we expected a positive relationship between EPU and BI.
H1 Economic policy uncertainty (EPU) will be positively associated with Blockchain Innovation (BI)
Policy uncertainty is important in the blockchain context, given that the cryptocurrency market is relatively new and “regulatory-disoriented” (Corbet et al., 2019). In their review, Corbet et al. (2019) considered that as the cryptocurrency market grows rapidly, the current broad regulations may not be aligned with such an evolution. Although significant research has been conducted on EPU, cryptospecific policy uncertainty has received less attention from scholars. Using a news-based approach similar to that of Baker et al. (2016), Lucey et al. (2022) analyzed 726.9 million news stories to develop a new UCRY Policy. The UCRY Policy index has been shown to significantly influence cryptocurrency volatility and returns (Karaömer, 2022), investment flows (Yan et al., 2022), and market crashes (Dai et al., 2022). However, there is limited evidence of the impact of UCRY Policy on BI. Using a rationale similar to that in the case of EPU, we argued that UCRY Policy has a positive relationship with BI (H2).
H2 Cryptocurrency policy uncertainty (UCRY Policy) will be positively associated with Blockchain Innovation (BI)
Recent research has documented the important role of cryptocurrency-specific factors in explaining crypto-related features and phenomena. For example, Liu and Tsyvinski (2021) showed that cryptocurrency returns can be predicted by cryptocurrency momentum and investor attention, rejecting the claim that cryptocurrency prices are merely a martingale (Schilling & Uhlig, 2019). In their study on market crashes, Dai et al. (2022) found that Lucey et al.’s (2022) cryptocurrency uncertainty measures can be used to forecast co-crashes of the cryptocurrency and stock markets, whereas Baker et al.’s (2016) EPU cannot. In this study, we suggest that the EPU indicator significantly reflects uncertainty in macroeconomic policies, some of which are not relevant to the blockchain and cryptocurrency markets. However, the UCRY Policy measure considers only the uncertainties related to blockchain and cryptocurrencies. Consequently, we posit that the UCRY Policy is more relevant in explaining BI and, thus, is likely to substitute for the effect of EPU on BI.
H3 UCRY Policy will (in part) substitute the effect of EPU on Blockchain Innovation (BI) such that with the presence of UCRY Policy, the effect of EPU on Blockchain Innovation (BI) will be reduced.
In this study, we obtained relevant quarterly data from 2010 to the first quarter of 2022, following the introduction of the first blockchain, Bitcoin, in 2009 (see Nakamoto, 2008). Our sample is a combination of four datasets: BI (i.e., the total number of patents that are created/filled, published, and granted in a given quarter in a country), EPU, uncertainty of cryptocurrency policy (UCRY Policy), and control variables including GDP, trade openness (Trade), and fixed investment (Investment). While EPU data (Baker et al., 2016) are available during the specified period, UCRY Policy data (Lucey et al., 2022) and GDP are available for 12/30/2013 and 02/21/2021, and until quarter 2, 2020, respectively. Although data on BI (patents) can be retrieved globally from Google Patents for 2010–2022, we can only obtain patent data from five countries: Australia, Japan, Korea, China, and the United States. This is because we observed a very small number of blockchain patents in other countries during this period; therefore, we excluded them. Overall, by combining and matching all the datasets, we obtained a final two-level sample that includes 126 quarterly observations nested in five countries (i.e., we performed different analyses with EPU, UCRY Policy, and both uncertainty indices). The sample size for the EPU model is 206. However, given the limited data availability of the UCRY Policy, the sample size for the two models with UCRY policy is reduced to 126. Although the sample is relatively modest, it is still sufficient to test the hypotheses according to the rule of thumb of 10 observations per predictor in a hierarchical linear modeling (HLM) analysis (Hofmann, 1997). However, we recognized this as a potential limitation of our study and discuss it in the Discussion section of this study. In the following section, we outline in more detail how we collected the variables.
MeasuresBlockchain Innovation (BI). We used the number of patents as a measure of innovation in the blockchain context, following a long tradition of innovation research (e.g., Artz et al., 2010; Bilbao-Osorio & Rodríguez-Pose, 2004; Fritsch & Slavtchev, 2007; Lian et al., 2022; Wang et al., 2021; Zuo & Lin, 2022). We collected information regarding blockchain patents, date, country of origin, etc., from Google Patents. The procedure was as follows: First, following recent studies (Wan et al., 2022; Wustmans et al., 2022), we searched for a list of blockchain-related keywords that include “blockchain,” “cryptocurrency,” “digital currency,” “distributed ledger,” and “smart contract” on Google Patents. We set the time limit from 2010 to 2022 as the Bitcoin, and its white paper was introduced only in 2009. The results were then transferred to an Excel file that included patent information, such as patent ID, title, assignee, inventor(s), filling/creation date, publication date, grant date, and result link. To ensure that the patents were relevant to blockchain technology, we manually checked all patent titles and removed the irrelevant ones. Next, we classified our research results by country and time period (i.e., quarterly). Finally, we computed the total number of patents by taking the sum of created/filled, published, and granted patents in a given quarter in a country. To enhance normality, we used the natural logarithm (Ln) of the total number of patents as our BI measure.
Economic policy uncertainty (EPU). We used the EPU index developed by Baker and colleagues (see Baker et al. (2016) and retrieved it from http://www.policyuncertainty.com/. The website contains monthly EPU data from more than 20 countries. However, when combined with the BI dataset, only five countries (Australia, Japan, Korea, China, and the United States) have sufficient data. Moreover, in this study, we were interested in the quarterly EPU index; as such, we only recorded the EPU values of the five countries on (or near) the following dates: Q1 – March 1,Q2– June 1,Q3 – September 1, and Q4–December 1. The EPU index comprises of three main components: (1) newspaper coverage of EPU, (2) the number of federal tax code provisions scheduled to expire, and (3) forecast dispersion among forecasters. The aggregate EPU index was computed as the weighted average of the three components, which were normalized by their standard deviations.1
Crypto policy uncertainty (UCRY Policy). We obtained a measure of crypto policy uncertainty from Lucey et al. (2022). Scholars have recently adopted this measure to examine the role of cryptospecific uncertainty in various economic phenomena (e.g., Elsayed et al., 2022; Hasan et al., 2022; Hassan et al., 2021; Yan et al., 2022). Lucey et al. (2022) provided a weekly assessment of the UCRY Policy from 12/30/2013 to 02/21/2021. However, similar to EPU, in this study, we are interested in the quarterly UCRY index, which we record at four time points each year: Q1 – March 1, Q2–June 1, Q3–September 1, and Q4– December 1. Lucey et al. (2022) developed a UCRY Policy index using the number of news articles related to UCRY Policy. This number was then normalized to its standard deviation to derive the final UCRY Policy index.
Control variables. We controlled for GDP, trade openness, fixed investment, and time, which have been found to be significant determinants of innovation (Furman et al., 2002; Galindo & Méndez, 2014; Waguespack et al., 2005). Quarterly GDP data were collected from the World Bank's Global Economic Monitor. We also included the GDP growth rate as an alternative measure in our additional analysis. Quarterly trade openness is measured by the total exports and imports of a country to its GDP (Waguespack et al., 2005) and fixed investment data collected from Refinitiv Eikon. All values are in U.S. dollars. Following prior research (Furman et al., 2002; Waguespack et al., 2005), we applied the Ln to all variables to enhance their normality.
Analysis techniqueGiven the hierarchical nature of our data (i.e., quarterly observations nested in each country), we adopted the HLM technique to test the proposed hypotheses (Hofmann, 1997; Raudenbush & Bryk, 2002). The multilevel technique partitions variations in the dependent variable, that is, BI, into within-(level 1) and between-country (level 2) variance components and offers statistical tests if there are factors that explain these components. According to Hofmann (1997), when examining level-1 relationships, the HLM technique considers the possible influence of the data structure at level 2: Hence, we suggested that the proposed technique allows us to obtain unbiased results regarding the level-1 relationships between different types of policy uncertainty and BI within a country.
In this study, we used the linear mixed model module in IBM SPSS Statistics 28 to perform HLM. In this SPSS module, we specify the country as a subject variable and use restricted maximum likelihood as the estimation method. We began our analysis with a null model that examines whether within- and between-country variance components exist in the BI. We then formulated different random coefficient models to examine whether the policy uncertainty variables EPU and UCRY Policy explain the within-country variations in BI while controlling for time, GDP, investment, and trade openness. In addition, following previous research (e.g., French et al., 2007; Janssen, 2012; McQuaid et al., 2012), we used Akaike's Information Criterion (AIC) to compare the suitability between models, in which a lower AIC indicates a better model suitability.
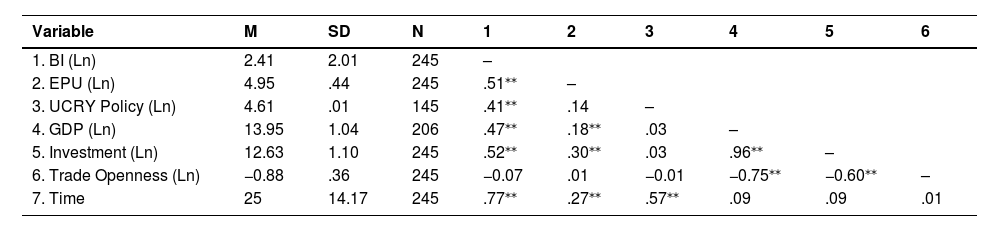
ResultsTable 1 shows the descriptive statistics and correlations between the variables of interest. The table indicates that BI is positively correlated with EPU (r = 0.51 and p <0.001) and UCRY Policy (r = 0.41 and p < .001). These significant correlations offer initial support for hypotheses 1 and 2. Moreover, we observed that BI correlated positively with three control variables: GDP (r = 0.47 and p < .001), investment (r = 0.52 and p <0.001), and time (r = 0.77 and p < .001). Meanwhile, we observed an insignificant correlation with trade openness (r = −0.07 and p = .29).
Descriptive statistics and correlation table.
BI – Blockchain Innovation; EPU – Economic Policy Uncertainty; UCRY Policy – Crypto Policy Uncertainty; GDP – Gross Domestic Product.
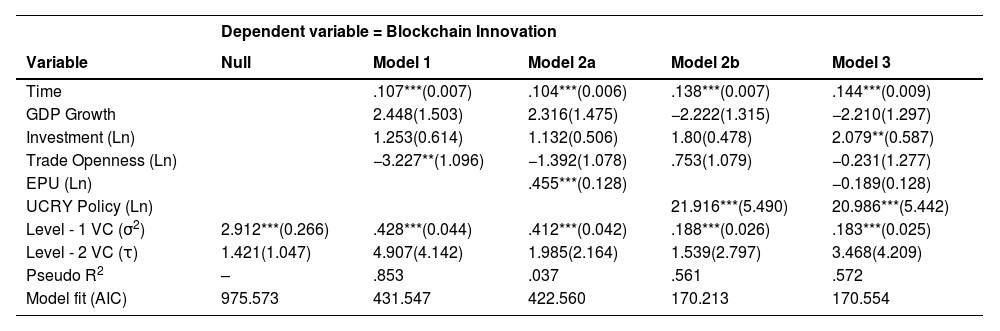
Our HLM analysis began with a null model in which there was no predictor or control variable (Hofmann, 1997). As we estimated this null model, we obtained the Level 1 (σ2 = 2.912, SE = 0.266, and p < .001) and Level 2 (σ= 1.421, SE = 1.047, and p = .175) variance components in BI. We computed the intraclass correlation coefficient (ICC) as τ / (σ2 + τ) that represents the percentage of total variance component that is accounted for by country-level characteristics (Hofmann, 1997; LeBreton & Senter, 2007). Using the ICC formula, we obtain an ICC value of 0.328. Overall, with an ICC value > 0.10, we followed previous research to continue using the HLM technique despite the insignificant level-2 variance component (e.g., Lee, 2000; Luu & Freeman, 2011).
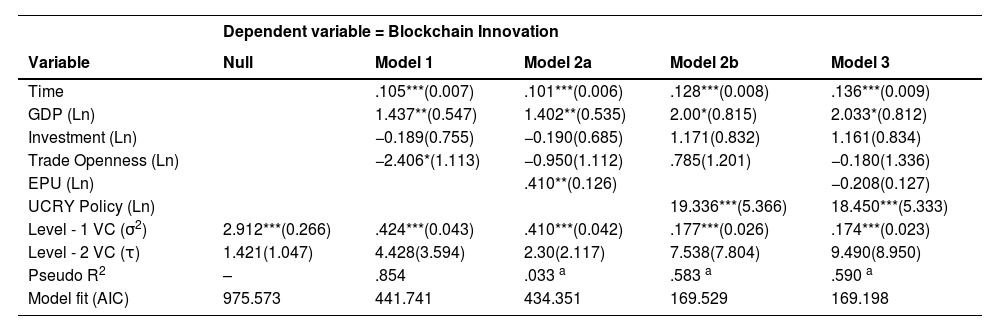
Next, we inserted time, GDP, investment, and trade openness as control variables in Model 1 (Table 2). Table 2 shows that time (B = 0.105, SE = 0.007, and p < .001), GDP (B = 1.437, SE = 0.547, and p = .009), and trade openness (B = −2.406, SE = 1.113, and p = .032) were significantly related to BI.2 In this respect, BI changes over time as a function of the GDP and trade openness in each country. Moreover, the addition of time, GDP, investment, and trade openness leads to a significant improvement in model fit (AIC = 441.741) compared to the null model (AIC = 975.573) (Table 2).
Hypothesis testing.
Note: *** p <0.001; ** p < .01, * p < .05; a in comparison to the model 1.
Standard errors are reported in parentheses.
GDP: Gross Domestic Product; EPU: Economic Policy Uncertainty; UCRY Policy: crypto-policy uncertainty; AIC: Akaike's Information Criterion; VC: Variance Component.
The sample size (N) in Models 1 and 2a was 206; however, it was reduced to 126 in Models 2b and 3 after matching with the UCRY dataset.
To provide an estimate of the effect size, we computed the pseudo R2 by referring to the percentage of the variance component in the dependent variable that has been explained by the addition of new predictor(s) (Hammer et al., 2004; Hofmann, 1997; Singer, 1998). Since we were interested in level-1 relationships only, the pseudo R2 in model 1, for instance, can be computed by the following formula: (σ2null model - σ2model 1) / σ2null model whereby the σ2 values are reported in Table 2. Substituting σ2 values into the formula yields a Pseudo R2 value of 0.854.
To test our hypotheses, we inserted the EPU and UCRY Policy into Models 2a and 2b, respectively (Table 2). As estimated for Model 2a, we observed empirical support for the relationship between EPU and BI (B = 0.410, SE = 0.126, and p = .001). Thus, when controlling for time, GDP, investment, and trade openness, more EPU leads to a higher BI in a country. In terms of Pseudo R2, EPU explains an additional 3.3% of the variance component in BI in Model 1. Therefore, Hypothesis 1 is supported. Similarly, the results from estimating Model 2b indicate that the UCRY Policy is positively related to BI (B = 19.336, SE = 5.366, and p < .001). When controlling for time, GDP, investment, and trade openness, more UCRY Policy is related to a higher BI. In terms of Pseudo R2, UCRY policy explains an additional 58.3% of the variance component in BI from Model 1. Therefore, Hypothesis 2 is supported. Overall, the addition of the EPU and UCRY policy improved the fit of Model 2a (AIC = 434.351) and Model 2b (AIC =169.529), respectively, compared to that of Model 1 (AIC = 441.741) (Table 2).
Moreover, we were also interested in examining the effect of EPU on BI in the presence of the UCRY Policy (and vice versa). This examination helps us conclude whether the effect of EPU on BI is substituted by the UCRY Policy, as postulated in Hypothesis 3. To do so, we estimated a model with EPU and UCRY Policy as predictors of BI (Model 3), while controlling for time, GDP, investment, and trade openness. The results from Model 3 indicate no empirical support for the relationship between EPU and BI (B = −0.208, SE = 0.127, and p = .103). Meanwhile, the results show that, in this case, the UCRY Policy is positively related to BI (B = 18.450, SE = 5.333, and p < .001). Moreover, we observed no significant difference in terms of the fit index AIC and Pseudo R2 between model 3 and 2b (Table 2). In summary, the results indicate that the influence of the UCRY Policy on BI highly substitutes for that of EPU. Therefore, Hypothesis 3 is supported.
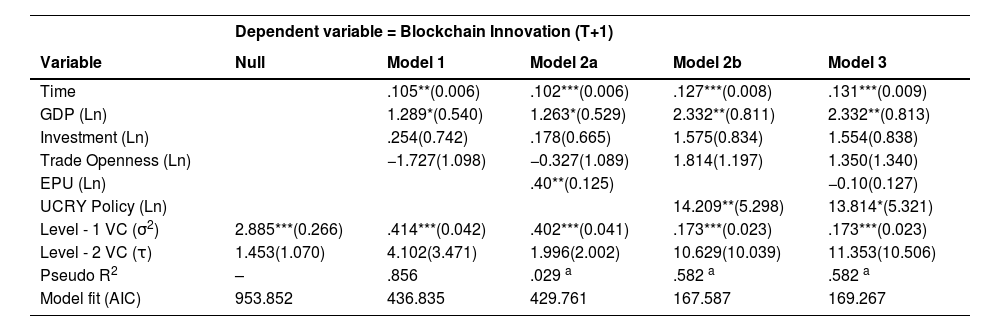
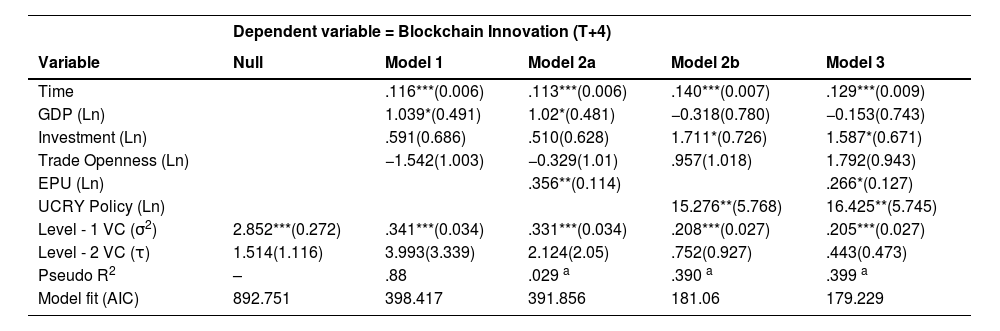
Additional analyses with Blockchain Innovation (T+1) and Blockchain Innovation (T+4) and GDP growth rateTo examine the robustness of our findings, we performed three additional analyses with BI of the subsequent quarter (T+1) (Table 3) and subsequent year (T+4) (Table 4) as an alternative dependent variable and GDP growth rate as an alternative control variable (Table 5). This addresses the concern that the innovation process takes time. Therefore, policy uncertainty may also influence BI over a longer timeframe. The results of these analyses confirm the significant influence of time and GDP on (T+1) BI and (T+4) BI. Moreover, with respect to Hypotheses 1 and 2, we observed a significant positive association between EPU (or the UCRY Policy) and BI from both analyses. Regarding Hypothesis 3, our analyses indicate that in the presence of the UCRY Policy, EPU is no longer significant in predicting (T+1) BI (Table 3, Model 3). Moreover, while there is supporting evidence for the influence of the UCRY's policy on (T+4) BI, we observed that the influence of EPU on (T+4) BI is significant (p = .04), but the EPU's coefficient is smaller than that of Model 2a (Table 4, Model 3), indicating partial support for the substitution role of the UCRY's policy. Overall, the results are generally consistent with the findings presented in Table 2. We also used the GDP growth rate as an alternative control variable, as prior research shows a positive correlation between the GDP growth rate and innovation (Amsden & Mourshed, 1997). Consistent results were obtained (Table 5). Please refer to Tables 3-5 for details on the variable coefficients, significance levels, and other parameters.
Additional analysis with Blockchain Innovation (T+1) as dependent variable.
*** p <0.001; ** p < .01, * p < .05; a in comparison to the model 1.
Standard errors are reported in parentheses.
GDP: Gross Domestic Product; EPU: Economic Policy Uncertainty; UCRY Policy: crypto-policy uncertainty; AIC: Akaike's Information Criterion; VC: Variance Component.
Additional analysis with Blockchain Innovation (T+4) as a dependent variable.
*** p <0.001; ** p < .01, * p < .05; a in comparison to the model 1.
Standard errors are reported in parentheses.
GDP: Gross Domestic Product; EPU: Economic Policy Uncertainty; UCRY Policy: crypto-policy uncertainty; AIC: Akaike's Information Criterion; VC: Variance Component.
Additional analysis with GDP growth rate as a control variable.
*** p <0.001; ** p < .01, * p < .05; a in comparison to the model 1.
Standard errors are reported in parentheses.
GDP Growth – quarterly growth rate of Gross Domestic Product; EPU: Economic Policy Uncertainty; UCRY Policy: crypto-policy uncertainty; AIC: Akaike's Information Criterion; VC: Variance Component.
This study investigates the impact of EPU and UCRY on BI since the invention of Bitcoin and blockchain technology. We found several important results. First, we provide evidence that EPU is associated with more BI across all examined countries, while controlling for the effects of time, GDP, investment, and trade openness. This finding highlights the positive impact of EPU, which is consistent with several recent studies on innovation (Guan et al., 2021; He et al., 2020; Xu & Yang, 2021). According to He et al. (2020), although investment in innovation tends to be irreversible, innovation costs can be much lower than the cost of losing future market power or competitiveness. The cost of losing market power can be even greater in the blockchain context, given that blockchain is considered a technology-intensive and competitive industry that is evolving rapidly (Daim et al., 2020). Overall, these rationales could explain why EPU does not hinder innovation but instead encourages people to increase their innovation and gain more competitive advantages in technological fields, such as blockchain.
Second, we found a similar result for UCRY Policy: a positive relationship between UCRY Policy and BI across countries. To the best of our knowledge, this is the first study to examine the link between the EPU and UCRY Policy and BI, extending the policy uncertainty and innovation literature. The consistent results for both policy uncertainty indicators strengthen our findings on the positive impact of policy uncertainty on BI. We support Liu and Tsyvinski's (2021) finding that crypto-specific factors are important for explaining crypto-related phenomena. Our findings are robust to additional tests using different time lags and alternative control variables.
Third, we found evidence that, compared to EPU, UCRY Policy is more important in explaining BI, as assessed by the total number of blockchain patents in the country. In terms of Pseudo R2, while EPU only explains an additional 5.1% of the variance component in BI from Model 1, the UCRY Policy explains up to 58.4% (see Models 2a and 2b, Table 2). We also found supporting evidence for the potential substitution effect of the UCRY Policy. Specifically, when we merge EPU with Model 2b of the UCRY's policy and BI, the effect of EPU on BI becomes insignificant (Model 3, Table 2). Moreover, the R2 value did not change significantly (from 0.584 to 0.591). This finding is consistent with that of Dai et al. (2022), who also shows that crypto-specific uncertainty can predict co-crashes in the stock and cryptocurrency markets, whereas EPU cannot. The UCRY Policy is more relevant, as it is uncertain in cryptocurrency policy, whereas EPU is highly concerned with macroeconomic policy uncertainty. Statistics show that the cryptocurrency market reacts strongly to changes in cryptocurrency regulations. For example, changes in cryptocurrency regulations by the South Korean and Chinese governments significantly influenced the Bitcoin prices in early 2018 (Corbet et al., 2019).
This study had several important practical implications. We elucidate the positive aspect of policy uncertainty in the blockchain context; that is, policy uncertainty represents positive signals for BI. During periods of high policy uncertainty, especially UCRY Policy, the motivation for people/firms to innovate outweighs their caution (i.e., wait-and-see behaviors). This could be due to the pressure to innovate to survive and compete in a highly competitive and technology-intensive blockchain industry, which consequently leads to a high level of BI in the country. Thus, policy uncertainty is not always a “bad” thing in the cryptocurrency market. These findings are relevant for investors and policymakers. In particular, during or after periods of high policy uncertainty, more BI emerges, implying more changes and growth in the blockchain industry. Therefore, policymakers should adopt appropriate strategies to address these potential changes. Similarly, investors should be aware of such trends in order to adjust their investment strategies. As discussed previously, policy alignment is a major concern in the cryptocurrency market, as the market evolves quickly (Corbet et al., 2019). High policy uncertainty can change the cryptocurrency market faster because of the high level of BI, as found in our study. This could provide insights for policymakers to formulate relevant regulations for the cryptocurrency market.
Despite its significant contributions, our study has some limitations that should be addressed in future research. First, our sample size was sufficient to test the hypotheses according to the rule of thumb of ten observations per predictor in the HLM analysis (Hofmann, 1997). Despite this, we acknowledged that our sample size is relatively modest for the following reasons: (1) blockchain technology is relatively new (e.g., Bitcoin–the first blockchain was introduced in 2009), we have decided to collect patent data since 2010, (2) the innovation process takes time, thus, we use quarterly data instead of shorter periods, such as weekly or monthly data, and (3) although we collect blockchain patents globally, only five countries, including Australia, China, Korea, Japan, and the United States, have sufficient data for analysis when we combine it with the EPU and UCRY Policy databases. We expect that in the near future, many more blockchain patents will be applied for and granted in other countries; therefore, future research can extend our study. Second, we call for further research to examine the potential mediators or moderators of the relationship between policy uncertainty and BI to understand the underlying mechanisms better and/or factors that can strengthen or weaken this relationship. Third, future studies can explore various types of uncertainty (e.g., climate-policy uncertainty (Gavriilidis, 2021) and cryptocurrency price uncertainty (Lucey et al., 2022)) and how they influence BI.
We would like to thank Luke Digweed for your professional editorial assistance, The Office for Research and Innovation, The Business School, RMIT University Vietnam for your kind support with the School of English and University Pathways (SEUP) Editorial Support Program.
More detailed information about the methodology can be found here https://www.policyuncertainty.com/methodology.html
It should be noted that in model 1, we also explore if the effects of Time, GDP, Investment, and Trade Openness are different across countries. We do so by estimating the random effects of these variables in the mixed model module. However, the results indicate no supporting evidence for such random effects in explaining BI. Overall, because of these results, coupled with the insignificant between-country variance component in BI from the null model, we decide not to examine the random effects of the predictors in the subsequent models.
articles