
Patient experience is considered an important tool to measure the quality of healthcare, which is a treatment efficiency and effectiveness outcome. This study aims to measure the level of quality provided by three hospitals in Alipurduar District, India with a focus on the patient satisfaction and to identify inequality of service received by patients from different backgrounds.
MethodsBy using stratified random sampling technique and seven points Likert scale, the required primary data were collected from the patients of these hospitals with a selected sample size of 300 patients. Exploratory Factor Analysis (EFA) was used in grouping the items and Multiple Linear Regression, ANOVA, and T-test were used for analysing the data.
ResultsThe services delivered in these hospitals moderately (4.660 ± .787) satisfy the patients, showing an average quality of healthcare. Therefore, patients from better income groups tend to have paid caregivers to provide better care. Moreover, quality of healthcare has a significant impact (R2 = .770) on patient satisfaction which varied between respondent groups, indicating inequality in the services delivered.
ConclusionsIn these Govt. hospitals where every patient has an equal right to receive quality care, due to the inequality in the patients’ socio-economic background, this is still not possible. Hospital authorities should improve the quality of healthcare by identifying deficiencies and by taking feedback from patients.
La experiencia de los pacientes se considera una herramienta importante para medir la calidad de la atención sanitaria, que es resultado de la eficiencia y efectividad del tratamiento. El objetivo de este estudio es medir el nivel de la calidad prestada por tres hospitales del distrito de Alipurduar, India, centrada en la satisfacción de los pacientes, y tratar de identificar la desigualdad de los servicios recibidos por estos en diferentes ámbitos.
MétodosUtilizando la técnica de muestreo aleatorio estratificado, y la escala de Likert de siete puntos, se recopilaron los datos primarios necesarios de los pacientes de estos hospitales, con un tamaño de muestra seleccionada de 300 pacientes. Se aplicó el análisis de factor exploratorio (EFA), ANOVA, y la prueba T, para agrupar los ítems y analizar la regresión lineal múltiple de los datos.
ResultadosLos servicios prestados en estos hospitales satisficieron moderadamente a los pacientes (4,660 ± 0,787), lo cual refleja una calidad media de la atención sanitaria. Por tanto, los pacientes pertenecientes a los grupos con mayores ingresos tienden a contratar a cuidadores para recibir una mejor atención. Además, la calidad de la atención sanitaria tiene un impacto significativo (R2 = 0,770) en la satisfacción de los pacientes, que varía de un grupo de respondedores a otro, lo cual indica la desigualdad de los servicios prestados.
ConclusionesEn estos hospitales estatales, en los que cada enfermo tiene el mismo derecho a recibir atención de calidad, esto no es posible debido a la desigualdad de los antecedentes socioeconómicos de los pacientes. La autoridad hospitalaria debería mejorar la calidad de la atención sanitaria, identificando las deficiencias y recabando información de los pacientes, lo cual redundará en la mejora de la calidad.
Quality in healthcare is recognized as a strategic tool for attaining efficiency and improved the performance of care.1,2 In early 2000, the WHO and the Institute of Medicine (IOM) stressed on the importance of patients’ perspectives about quality to assess healthcare.3,4 But the measurement of quality is a complicated phenomenon due to its intangible nature. Nowadays, the experience of patients has given more importance as it helps to measure the quality of the healthcare system and becoming an important step to establish patient-centered care. Due to the rising importance of patient-centered care, patients’ experience is considered one of the fundamental concepts of Institute for Health Care Improvement (IHI).5,6 Most of the organizations consider patients’ experience as a major information source for improving the different aspects of healthcare quality. Patients’ feedback is a component of the healthcare Quality framework in most of the countries in the developed world.7,8 But in the developing and underdeveloped parts in the world, the experience of patients has been used limitedly when assessing the quality of healthcare due to lesser importance on patient-centered care.
The nature of patients’ experience, will not always remain equal to the provided healthcare services due to its dynamic nature.9 The patients’ experience is correlated with the expectation as well as the knowledge and behavior of patients towards the healthcare system which varies from one group to another. This paper aims to measure the experience of patients among the three public hospitals in Alipurduar District with a focus on their demographic, social and economic correlates to highlight the level of inequality in the quality of services.
Materials and MethodsBackground of the Study AreaThere are only three tertiary level public hospitals namely Alipurduar District Hospital, Birpara State General Hospital, and Falakata Super Specialty Hospital in Alipurduar district. These hospitals are located in the plain and urbanized areas of the district. The number of Indoor and Outdoor patients served annually by these hospitals ranges from 20K to 30K and 2.5 Lakhs to 3 Lakhs respectively. The number of functional Beds in Alipurduar District Hospital, Birpara State General Hospital, and Falakata Super Specialty Hospital are 300, 220, and 180 respectively. Though these hospitals serve a huge number of population, there is a remarkable dearth of manpower if compared to the required number. There is a facility of a paid attendant in these hospitals if any patient desires so.
As this district is one of the newly formed districts in the state of West Bengal, India, the development process to provide district-level facilities in these Hospitals is still incomplete. In addition, these three hospitals are the only source in this district that provides critical care services with huge patient pressure throughout the year. Therefore, the maintenance of the level of quality of healthcare of these hospitals is a very essential factor to improve the performance.
Questionnaire designTo construct the questionnaire for the study, questions have been taken from the HCAHPS Survey Questionnaire (2018)10 after taking due permission to use, translate, and redesign this questionnaire. These questions have been re-designed and translated into the local language to make it suitable for the study and it has been checked by an expert panel consisting of five members in this field. The questionnaire scores quality in each item from 0 to 7 (maximum quality of healthcare perceived) For measuring the reliability of these questions, Cronbach's Alpha has been calculated where the acceptable value of Cronbach's Alpha should be more than 0.70.11
Selected SampleThe total population of this district has been taken into consideration to select the sample size of the patients as these three public hospitals provide services to the whole population of this district. By applying Cochran's sample size formula with a 90% confidence level and 5% margin of error, the value of the sample is 271. Although sample size between 30 and 500 is generally sufficient for many researchers.12 A total of 300 Sample size has been taken to minimize the error and from each hospital, 100 patients have been selected. To conduct the work, official permission has been taken from CMOH (Chief Medical Officer of Health), Alipurduar, India. By using a stratified random sampling technique, the required primary data have been collected from those patients who got admission to these hospitals for more than three days and who are willing to give answers. Seven points Likert scale has been used to evaluate the perceptions as well as the satisfaction of the respondents about healthcare. This study is fully based on an Indoor survey and has been conducted from September to October 2019.
Statistical AnalysisAs the three hospitals have almost equal infrastructure and provide similar type of services, a composite value of these hospitals has been taken into consideration to show the result of this study. Exploratory Factor Analysis (EFA) was used (in IBM SPSS Statistics 20.0 version) which helps in groupings the items by defining a set of common underlying dimensions, known as factors.13 In this study, for extracting the factors, Principal Component Analysis (PCA) has been used with the varimax rotation method.
To analyze the effects of the extracted components of healthcare quality on the level of patients’ satisfaction, Multiple Linear Regression has been applied. Lastly, to represent the variation of the level of patients’ experience about healthcare, One-Way ANOVA and Independent Samples T-test have been performed based on the extracted Factor scores. Factor analysis is the first step for many univariate or multivariate analyses as the factors extracted in Factor analysis are standardized value and there is no correlation among the Factors.14–16
ResultsSample CharacteristicsThe socio-demographic and background (paid attendant) characteristics of the patients are considered as one of the important factors to develop the knowledge as well as the psychological behavior of the respondents i.e. the patients.
In the study, most of the respondents are from the age group of 31 to 50 years (40.7%) while 33.3% patients’ age is less than 30 years. Among the respondents, the number of females is little higher (51%) than male. The monthly income of maximum respondents (67%) is below Rs. 12000 and among them the income of 17.7% people is less than Rs. 7000. The number of respondents having Higher Secondary (H.S.) is only 94 (31.3%) while 27.7% of respondents are illiterate. The number of people who can avail paid attendants during their treatment in these hospitals is little lesser (47.7%) than those who can’t.
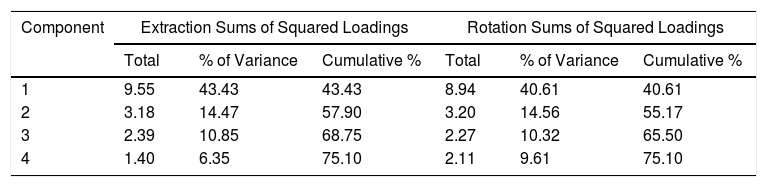
The KMO (Kaiser-Meyer-Olkin) value is 0.923 which is more than 0.60 indicates the Sampling Adequacy is found in the study and the significance value of Bartlett's Test of Sphericity showing sufficient correlation lying in the data set. The EFA result reveals four factors can explain 75.10% of the variance. The first component explains 40.61% of the total variance whereas the extracted last component can explain 9.61% of the total variance. (Table 1)
Total Variance Explained.
| Component | Extraction Sums of Squared Loadings | Rotation Sums of Squared Loadings | ||||
|---|---|---|---|---|---|---|
| Total | % of Variance | Cumulative % | Total | % of Variance | Cumulative % | |
| 1 | 9.55 | 43.43 | 43.43 | 8.94 | 40.61 | 40.61 |
| 2 | 3.18 | 14.47 | 57.90 | 3.20 | 14.56 | 55.17 |
| 3 | 2.39 | 10.85 | 68.75 | 2.27 | 10.32 | 65.50 |
| 4 | 1.40 | 6.35 | 75.10 | 2.11 | 9.61 | 75.10 |
Extraction Method: Principal Component Analysis.
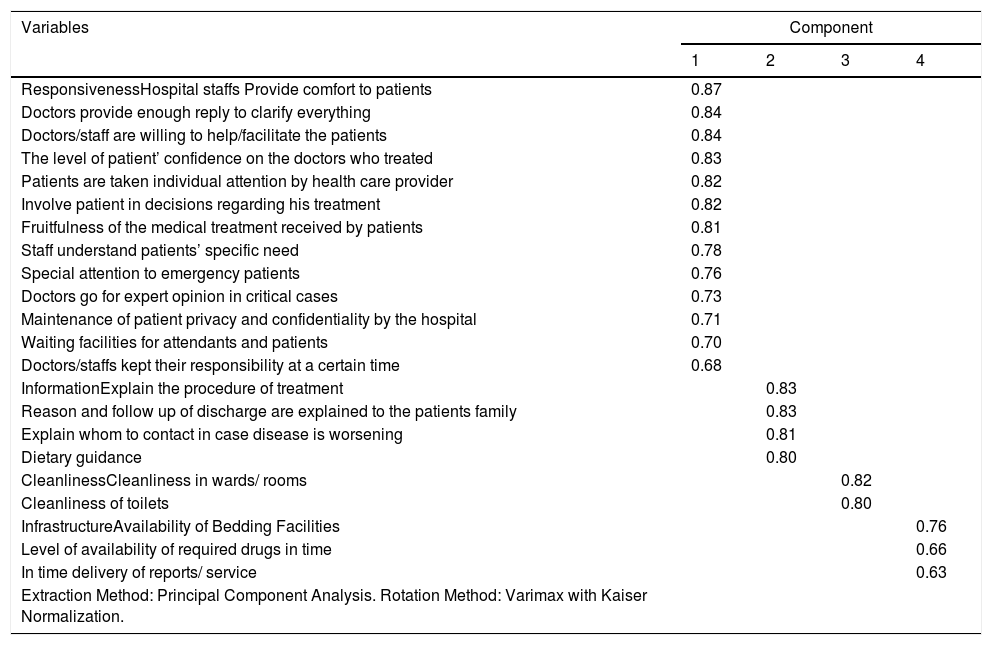
Responsiveness is the most influential factor in healthcare consisting of 13 items whose factor loadings value ranges from 0.870 to 0.684. The extracted second important component is Information which has four items, can explain 14.559% of the variance and the other two extracted components are Cleanliness and Infrastructure. (Table 2)
Rotated Component Matrix.
| Variables | Component | |||
|---|---|---|---|---|
| 1 | 2 | 3 | 4 | |
| ResponsivenessHospital staffs Provide comfort to patients | 0.87 | |||
| Doctors provide enough reply to clarify everything | 0.84 | |||
| Doctors/staff are willing to help/facilitate the patients | 0.84 | |||
| The level of patient’ confidence on the doctors who treated | 0.83 | |||
| Patients are taken individual attention by health care provider | 0.82 | |||
| Involve patient in decisions regarding his treatment | 0.82 | |||
| Fruitfulness of the medical treatment received by patients | 0.81 | |||
| Staff understand patients’ specific need | 0.78 | |||
| Special attention to emergency patients | 0.76 | |||
| Doctors go for expert opinion in critical cases | 0.73 | |||
| Maintenance of patient privacy and confidentiality by the hospital | 0.71 | |||
| Waiting facilities for attendants and patients | 0.70 | |||
| Doctors/staffs kept their responsibility at a certain time | 0.68 | |||
| InformationExplain the procedure of treatment | 0.83 | |||
| Reason and follow up of discharge are explained to the patients family | 0.83 | |||
| Explain whom to contact in case disease is worsening | 0.81 | |||
| Dietary guidance | 0.80 | |||
| CleanlinessCleanliness in wards/ rooms | 0.82 | |||
| Cleanliness of toilets | 0.80 | |||
| InfrastructureAvailability of Bedding Facilities | 0.76 | |||
| Level of availability of required drugs in time | 0.66 | |||
| In time delivery of reports/ service | 0.63 | |||
| Extraction Method: Principal Component Analysis. Rotation Method: Varimax with Kaiser Normalization. | ||||
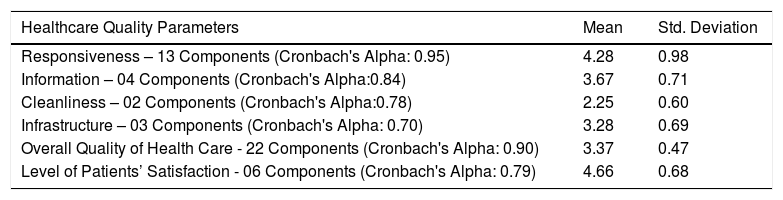
From Table 3, it can be understood that the result of Cronbach's Alpha of 22 parameters is 0.895, showing the higher level of internal consistency in the study and the Alpha value of each of the four indicators provide an acceptable result, i.e. more than 0.70. Table 3 also shows the mean value of different Healthcare Quality Parameters and patient's satisfaction in these three hospitals. The mean value of Responsiveness is high (4.281 ± 0.981) which indicates that the behaviour of doctors and nurses to the patients is comparatively better in all three hospitals. The services of Cleanliness have scored lowest (2.252 ± .604) because most of the respondents have experienced the unclean condition of the toilet and wardroom, found in all the hospitals. The Mean values of Information (3.674 ± .710) and Infrastructure (3.283 ± .692) indicate that the quality of these services is below the moderate level. This study shows, the Infrastructure conditions in these three hospitals are not satisfactory and patients are not getting sufficient information of their treatment. The mean score of perception of the respondents about their satisfaction with the healthcare services is 4.660 out of 7 points which is almost good but the mean of the overall quality of healthcare is not good at all (3.373 ± .474). (Table 3)
Descriptive Statistics of Components of Healthcare Quality and Measurements Results.
| Healthcare Quality Parameters | Mean | Std. Deviation |
|---|---|---|
| Responsiveness – 13 Components (Cronbach's Alpha: 0.95) | 4.28 | 0.98 |
| Information – 04 Components (Cronbach's Alpha:0.84) | 3.67 | 0.71 |
| Cleanliness – 02 Components (Cronbach's Alpha:0.78) | 2.25 | 0.60 |
| Infrastructure – 03 Components (Cronbach's Alpha: 0.70) | 3.28 | 0.69 |
| Overall Quality of Health Care - 22 Components (Cronbach's Alpha: 0.90) | 3.37 | 0.47 |
| Level of Patients’ Satisfaction - 06 Components (Cronbach's Alpha: 0.79) | 4.66 | 0.68 |
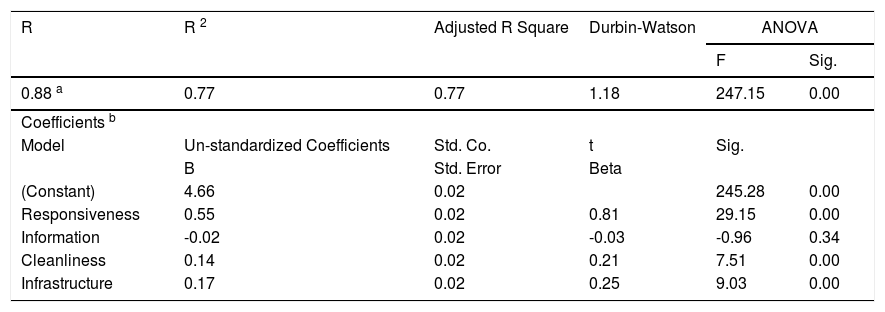
Table 4 shows the summary of Linear Regression analysis to explain the level of satisfaction about healthcare where independent variables are the four components of healthcare quality. The components of healthcare quality are significant to explain the level of satisfaction as the R2 is 0.770, which means the quality of healthcare can explain 77% of the variance of satisfaction. From the result of the coefficient, it can be understood that Responsiveness is the strongest and significant (Beta: 0.814 and p - 0.000) predictor for Satisfaction. Infrastructure has also a greater (Beta: 0.252) impact on patients’ satisfaction followed by Cleanliness (Beta: 0.210). (Table 4)
Summary of Regression Results on the Level of Satisfaction.
| R | R 2 | Adjusted R Square | Durbin-Watson | ANOVA | |
|---|---|---|---|---|---|
| F | Sig. | ||||
| 0.88 a | 0.77 | 0.77 | 1.18 | 247.15 | 0.00 |
| Coefficients b | |||||
| Model | Un-standardized Coefficients | Std. Co. | t | Sig. | |
| B | Std. Error | Beta | |||
| (Constant) | 4.66 | 0.02 | 245.28 | 0.00 | |
| Responsiveness | 0.55 | 0.02 | 0.81 | 29.15 | 0.00 |
| Information | -0.02 | 0.02 | -0.03 | -0.96 | 0.34 |
| Cleanliness | 0.14 | 0.02 | 0.21 | 7.51 | 0.00 |
| Infrastructure | 0.17 | 0.02 | 0.25 | 9.03 | 0.00 |
a Predictors: (Constant), Responsiveness, Information, Cleanliness, Infrastructure
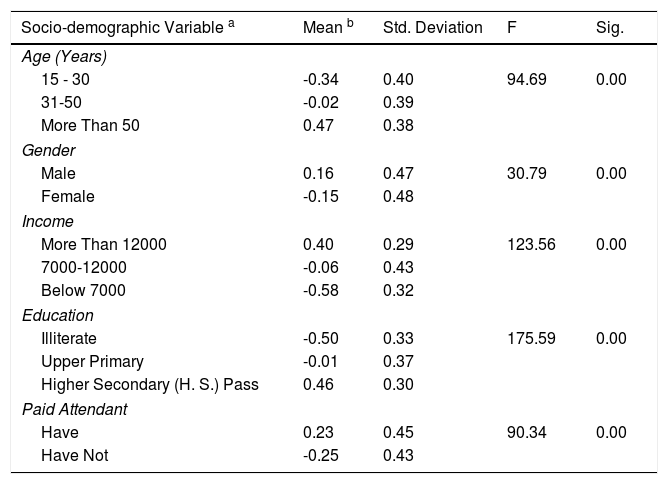
From the result of ANOVA, it can be understood that age has a significant impact on the thought of the common people and older people denote higher scores for their experience (p = 0.000). Income and education significantly influence the perception of respondents about healthcare (p - 0.000). Therefore, patients from lower-income and lesser-educated groups are supposed to report a lesser score for their experience. Lastly, patients who have paid attendance seem to report highly satisfied (p = 0.000) than those patients who haven’t paid attendance. (Table 5)
Patients’ Experience about Quality of Healthcare according to Sample Characteristics.
| Socio-demographic Variable a | Mean b | Std. Deviation | F | Sig. |
|---|---|---|---|---|
| Age (Years) | ||||
| 15 - 30 | -0.34 | 0.40 | 94.69 | 0.00 |
| 31-50 | -0.02 | 0.39 | ||
| More Than 50 | 0.47 | 0.38 | ||
| Gender | ||||
| Male | 0.16 | 0.47 | 30.79 | 0.00 |
| Female | -0.15 | 0.48 | ||
| Income | ||||
| More Than 12000 | 0.40 | 0.29 | 123.56 | 0.00 |
| 7000-12000 | -0.06 | 0.43 | ||
| Below 7000 | -0.58 | 0.32 | ||
| Education | ||||
| Illiterate | -0.50 | 0.33 | 175.59 | 0.00 |
| Upper Primary | -0.01 | 0.37 | ||
| Higher Secondary (H. S.) Pass | 0.46 | 0.30 | ||
| Paid Attendant | ||||
| Have | 0.23 | 0.45 | 90.34 | 0.00 |
| Have Not | -0.25 | 0.43 | ||
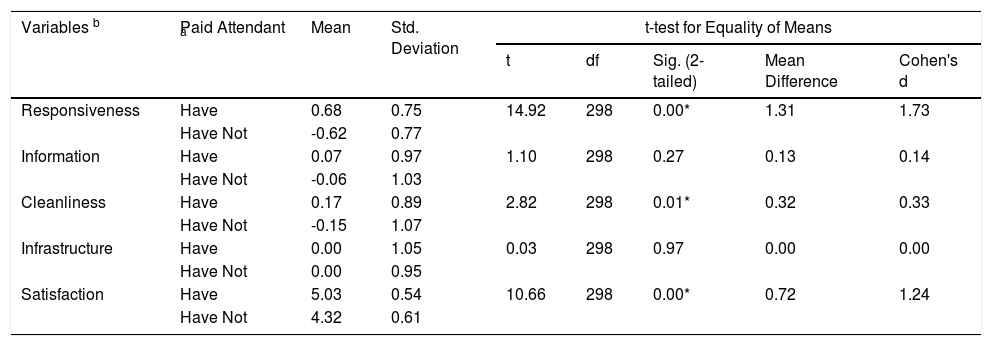
The mean difference in the experience of the respondents about health care services is highest (1.307) in Responsiveness where t (298) =14.921, p = 0.000 and the effect size is 1.726 which is large effect according to Cohen's classification. This highest variation in Responsiveness indicates that moral, cognitive, emotive and behavioral components of healthcare 17 are highly related to the presence of paid attendants. In addition, the lower difference is found in Infrastructure (effect size = 0.004 and p = 0.973), showing physical facilities, equipment and appearance of personnel are lesser related to paid attendants. Patients who have paid attendants are seemed to report highly satisfied and the mean difference between the two groups is 0.716 (p = 0.000). (Table 6)
The Effect of the Presence of Paid Attendant on the Experience of Patients about Quality of Healthcare and Patients’ Satisfaction.
| Variables b | Paid Attendant a | Mean | Std. Deviation | t-test for Equality of Means | ||||
|---|---|---|---|---|---|---|---|---|
| t | df | Sig. (2-tailed) | Mean Difference | Cohen's d | ||||
| Responsiveness | Have | 0.68 | 0.75 | 14.92 | 298 | 0.00* | 1.31 | 1.73 |
| Have Not | -0.62 | 0.77 | ||||||
| Information | Have | 0.07 | 0.97 | 1.10 | 298 | 0.27 | 0.13 | 0.14 |
| Have Not | -0.06 | 1.03 | ||||||
| Cleanliness | Have | 0.17 | 0.89 | 2.82 | 298 | 0.01* | 0.32 | 0.33 |
| Have Not | -0.15 | 1.07 | ||||||
| Infrastructure | Have | 0.00 | 1.05 | 0.03 | 298 | 0.97 | 0.00 | 0.00 |
| Have Not | 0.00 | 0.95 | ||||||
| Satisfaction | Have | 5.03 | 0.54 | 10.66 | 298 | 0.00* | 0.72 | 1.24 |
| Have Not | 4.32 | 0.61 | ||||||
Note. * Significant at the 0.05 level.
The quality of treatment is a predisposing factor in improving patients’ satisfaction levels.18 In these hospitals, the quality of healthcare influences patients’ level of satisfaction about provided healthcare services. Among the four components of healthcare quality, the effect of Responsiveness on satisfaction is strongest and highly related to patients’ satisfaction, indicating patients are satisfied more when doctors and nurses are interested in what they say and when they got sufficient time for their questions.19 Patients of the three hospitals commonly expect mental support and good behaviour from the healthcare providers which they think more important than all the services related the quality of healthcare. Moreover, Cleanliness and Infrastructure have also a strong and significant impact on satisfaction, which implied that patients are satisfied with the improvement of infrastructural facilities and cleanliness of the hospitals.
Demographic, social and economic characteristics influence the psychological as well as behavioral characteristics of the respondents. Due to this importance, socio-demographic variables are most frequently studied about satisfaction.20 In these hospitals, patients’ from the older age group seems to be highly satisfied because, with the increase of age, the probability of patients’ satisfaction is increased along with to decrease of expectation.21 The respondents who have paid attendants are found to report a higher level of satisfaction than those who haven’t any attendant. In addition, it is supposed to be understood that patients who can afford attendants for their treatment are economically stronger and have higher education, consequently, people from these groups are more satisfied with the care in these hospitals.
This variation in the perception of the respondents particularly those who can afford attendant or can’t indicate that patients have been experiencing an unequal quality of healthcare services from these hospitals. Patients from the higher socio-economic and cultural level have the capacity to take paid attendants who look after them whenever required. Even they provide mental assistance that most of the patients expect. Due to huge patient pressure and the shortage of personnel, the nurses and doctors remain too busy and don’t have time to speak with the patients. As a consequence, for receiving better treatment patients have to hire paid attendants which creates indirect expenditure in the public hospitals. But as per the report of The Hindu, (2014) State Govt. assured that there will be no expenses during treatment at public Hospitals 22 and Central Govt. subsidized the costs of treatment for those who are below the poverty line (Quartz India, 2015).23
The study shows that in these hospitals, taking paid attendants for better treatment has become part and parcel of the healthcare system which is not possible without the cooperation of the authority. According to the experience of many patients, a paid attendant serves two to three patients at a time but still, patients feel bound to take them especially at night because of the unsuitable provision in these hospitals. Though taking of paid attendants is quite expensive, patients get more responsive care from them which has become the strength of the hospitals. In addition, there is a good co-ordination between healthcare providers and paid attendants in these hospitals. But in the case of patients with lower socio-economic backgrounds, the same is not applicable because they remain unable to hire paid attendants, and consequently, they deprived of better care. This system creates inequity among patients from different backgrounds, but in a public hospital as per Govt. norms, every patient should receive an equal level of care.24
This study has some limitations. First, this work was fully based on public hospitals, the private hospital does not include here. Therefore, a comparison result between public and private hospital don’t show through this study. In addition, this study only focuses on the present experience of patients and the result don’t show their previous experience.
ConclusionThe study reveals that the services provided by these hospitals do not satisfy its patients to the fullest extent rather implies a moderate level of quality of healthcare services. Different dimensions of healthcare quality have a significant impact on the level of satisfaction about healthcare. According to this study, Responsiveness is the most influencing one compare to others, which indicates patients are satisfied more if they get attention and a good behaviour from the healthcare providers. In addition, the pattern of perceived quality of care significantly varies from patient to patient. Some socio-demographic variables, like age, income are more consistent and correlated aspects with the perception of patients. Also, the study identifies that the quality of care is associated with the presence of paid attendants during treatment which shows an unequal service provided by these hospitals to those patients who can’t afford attendants. In these Govt. hospitals where every patient has equal right to receive quality care, due to the inequality in patients’ economic condition, this is yet not possible. Therefore, it is highly essential to identify the ailments relating to the quality of care by collecting feedback from the patients, and steps should be taken accordingly to ensure the better and equitable quality of health services.
FundingThis study has not received any grant from any funding agency.sectors.
Patient consent for publicationNot required for this study. There is no experiment on Animal and Human subject. This study fully based on the experience of the patients after taking an official permission from CMOH (Chief Medical Office of Health), Alipurduar, India and this study don’t disclose any personal information of the patients.
Data availability statementData will be available on request and this article consists all relevant data.
Conflicting InterestConflict of Interest does not exist in this study.
We are indebted and grateful to the persons who have encouraged, inspired and assisted us to complete this work, particularly CMOH of Alipurduar District who have given us permission to carry out the survey for this study.