


Escherichia coli is the major causative agent of urinary tract infections (UTI), and virulence factors are responsible for the severity of these emerging infections. The aim of this study was to evaluate the relationship between virulence determinants and antibiotic susceptibility with phylogenetic groups of E. coli isolates of UTI in two locations in Mexico.
MethodsAn analysis was performed on 50 isolates of E. coli from the centre of the country and 57 from a town in the southwest. The isolates were characterised by phenotype (serotyping assays, in vitro adhesion, biofilm formation, production of haemolysin, and antibiotic susceptibility) and genotype (phylogenetic groups and virulence genes).
ResultsIn the centre of the country location the phylogenetic group B2 (60%) and F (12%) were significantly more prevalent and had a higher frequency of genes, fimH (96%), iutA (66%), sat (36%), compared to the southwest location, where the group A (35%) and B1 (21%) were significantly predominant and had fewer virulence genes. About one-fifth (21.5%) of all isolates belonged to the O25-ST131 group. Haemolysin and biofilm producing strains were significantly higher in the southwest location. Resistance to ampicillin (92.5%), tetracycline (76.6%), and trimethoprim/sulfamethoxazole (70.1%) were the most common in both groups.
ConclusionThe phylogenetic group, virulence factors, and antibiotic susceptibility of the E. coli that causes UTI in the community, varies significantly among the Mexican populations studied. Phylogenetic groups A and B1 may be multidrug resistant and have the ability to produce UTI.
Escherichia coli es el principal agente causal de infecciones del tracto urinario (ITU), y sus factores de virulencia son los responsables de la gravedad de estas infecciones emergentes. El objetivo de este estudio fue evaluar la relación entre los determinantes de virulencia y susceptibilidad a antibióticos con los grupos filogenéticos de E. coli aisladas de ITU en 2 localidades de México.
MétodosSe analizaron 50 aislamientos de E. coli de una localidad en el centro del país y 57 provenientes de una localidad al suroeste. Los aislamientos fueron caracterizados fenotípica (serotipificación, ensayos de adherencia, formación de biopelícula, producción de hemolisina y susceptibilidad antibióticos) y genotípicamente (grupos filogenéticos y genes de virulencia).
ResultadosLos grupos filogenéticos B2 (60%) y F (12%) fueron significativamente predominantes en la localidad del centro con mayor frecuencia de los genes fimH (96%), iutA (66%) y sat (36%) en comparación con la localidad en el suroeste, donde los grupos A (35%) y B1 (21%) fueron más frecuentes y presentaron menor cantidad de genes de virulencia. El 21,5% del total de aislamientos pertenecieron al grupo O25-ST131. La producción de hemolisina y biopelícula fue significativamente mayor en cepas de la localidad del sureste. La resistencia a ampicilina (92,5%), tetraciclina (76,6%) y trimetoprim/sulfametoxazol (70,1%) fueron las más comunes en ambos grupos.
ConclusiónEl grupo filogenético, los factores de virulencia y la susceptibilidad a antibióticas de E. coli causante de ITU en la comunidad varían significativamente entre las poblaciones mexicanas estudiadas. Los grupos filogenéticos A y B1 pueden ser multirresistentes y tienen la capacidad de producir infecciones urinarias.
Escherichia coli is the most common causal agent of urinary tract infections (UTIs), including acute cystitis, pyelonephritis and urosepsis – the three most common and clinically different syndromes. Normally, E. coli establishes a symbiotic relationship with its host and plays an important role in promoting the stability of the normal intestinal microbiota.1 However, infections caused by extraintestinal E. coli are the main cause of morbidity, mortality and high health-related costs. E. coli has to adapt to the host's environment (bladder, kidney and bloodstream) and virulence factors play an important role in the initial stages of interaction with the host.2 There are primarily two types of virulence factors: those expressed on the cell surface (which perform tissue adhesion and invasion functions, as well as forming biofilms and inducing cytosines) and those produced within the bacteria cell, which are exported to the infection site.3
The main factors that facilitate the invasion of bladder epithelial cells are type 1 pili, which are expressed in over 90% of all E. coli isolates, including both pathogenic and commensal strains. Type 1 pili are composed of repetitions of FimA pilin subunits; the distal part of the pilus is formed from two adapters (FimF and FimG proteins) and the mannose-bound FimH adhesin. This FimH adhesin mediates the adherence of the bacteria to a series of glycoproteins and non-glycosylated peptide epitopes in the epithelium of the bladder, which lead to the internalisation of the bacteria, forming intracellular bacterial communities.4–6 While the P pilus (pilus associated with pyelonephritis) has been found in approximately 80% of the isolates causing upper UTIs,7 the different structural subunits of the P fimbriae are coded by the pap operon.8
Three types of toxins are produced by uropathogenic E. coli (UPEC): α-haemolysin, cytotoxic necrotising factor type 1 (CNF1) and the secreted autotransporter toxin (Sat). α-Haemolysin (HlyA), also known as the “pore-forming toxin”, enters the cell membrane of the host, causing cell lysis, thereby facilitating the release of iron and nutrients that are essential for bacterial growth.9 CNF1 leads to constitutive activation of members of the Rho family, resulting in the rearrangement of the host cell cytoskeleton and causing apoptosis of the bladder cells, stimulating their in vivo exfoliation.10 The Sat toxin is a serine protease that is classified within the family of serine protease autotransporters of Enterobacteriaceae (SPATE), which are primarily found in strains of UPEC and are characterised by their cytopathic effects on the kidney and bladder; this toxin may induce vacuolisation in the cytoplasm of the uroepithelial cells.11
Based on the relationships of similarity assessed using electrophoresis techniques for different enzymes and gene sequencing (MLST), phylogenetic groups have been determined.12 Clermont et al.13 have developed a quadruple PCR assay that recognises seven phylogenetic groups (A, B1, B2, C, D, E, F), one of which is called clade I. Moreover, there is evidence that certain E. coli serotypes are associated with UTIs: O1, O2, O4, O6, O7, O8, O16, O18, O25 and O75.14,15
The clinical management of UTIs is complicated due to the increasing incidence of infections caused by E. coli strains that are resistant to commonly-used antibiotics and which produce biofilms. Recently, a multidrug-resistant extended-spectrum beta-lactamase-producing E. coli clone (O25-ST131) with a high virulence has emerged around the world as a significant cause behind community-acquired UTIs.16
Despite the identification of multiple virulence-associated genes in UPEC strains, it has not been possible to determine a urovirulence profile, given that half of all UPEC isolates do not contain any or only one of the virulence factors identified. The objective of this study was to evaluate the relationship between virulence factors (serotyping, adherence capacity, biofilm and toxin production) and the resistance profile with phylogenetic groups of E. coli in UTI isolates of outpatients in two Mexican localities.
MethodologyBacterial isolatesIn the period between September 2010 and August 2011, clinical isolates of E. coli were recovered from the urine samples of patients with community-acquired UTIs. Only one strain was worked on per patient, and they were from acute uncomplicated cystitis (outpatients, non-pregnant women and no other concomitant disease). The urine cultures were processed using conventional methods and included samples with a viable count of >105CFU/ml. Clinical isolates were identified using the semi-automated API20E system (BioMérieux) and biochemical tests. Fifty strains were recovered from clinic number 61 of the Mexican Institute of Social Security (IMSS) and 57 from the ISSSTE hospital in Chilpancingo, Guerrero, located in central and south-western Mexico, respectively.
Susceptibility testsAntibiotic susceptibility tests were carried out using the disc diffusion method (Oxoid Ltd, Basingstoke, UK) as per the guidelines of the Clinical and Laboratory Standards Institute.17 Isolates with a resistance to three or more classes of antibiotics were considered to be multidrug-resistant (MDR).
Haemolysin assayThe haemolytic capacity of the isolates was evaluated using the method proposed by Scheffer et al.18 in 1988, with some modifications. Cultures at a concentration of 6×10⁸ cells were obtained. 0.1ml of culture was incubated with 0.9ml of a 2% sheep red blood cell suspension in buffer (20mM CaCl2, 10mM Tris and 140mM NaCl, pH 7.4) for 30min at 37°C; after this time, the tubes were placed in ice and centrifuged. The release of haemoglobin was determined at 530nm and the results were expressed as percentage lysis compared to red blood cells lysed in distilled water. Terciles were established, classifying lysis as low (>14.2%), moderate (14.13–23.3%) or high (>23.4%).
Biofilm productionThe capacity for biofilm formation was determined using the quantitative microplate method described by George A. O’Toole in 2011.19 Readings were taken at an optical density of 570nm in an Elisa reader (Awareness Stat Fax 2100). In order to quantify the biofilm, the optical density of the growth and crystal violet were taken into account.20
SerotypingSerogroups were determined at the Enteric Pathogen Laboratory of the Department of Public Health of the National Autonomous University of Mexico's Faculty of Medicine, with antiserums prepared at that laboratory. Rabbit antisera were used against 187 somatic antigens and 56 monovalent sera from flagellar antigens. The isolates were cultured in trypticase soy agar for the somatic antigen and in semisolid Craig's medium for the flagellar antigen.21
Adherence assaysA glass lentil was placed in each of the 24 wells of the plate and Vero cells were added to form a monolayer (at a concentration of 2.5×10⁵); 1ml of final volume containing Eagle's Minimal Essential Medium and a 2.5×10⁸ bacterial suspension were added. This was incubated at 37°C for 3h and rinsed three times with PBS. The wells were then fixed with methanol for one minute. They were then stained with Giemsa for 20min and rinsed three times with distilled water. A mixture of acetone/xylene (50/50) was added for 1min. For observation under the microscope, the lentils with stained cells were assembled on a slide with resin and observed on immersion. Positive adhesion was considered to be when at least 10% of the cells were found to have more than 10 adhered bacteria.
DNA extractionThe InstaGene Matrix™ kit (Bio-Rad Laboratories, Hercules, CA, USA) was used, in accordance with the manufacturer's instructions.
Determination of phylogenetic groupsThe phylogenetic groups were determined by means of a multiple PCR assay to define the seven recognised groups (A, B1, B2, C, D, E, F) and clade I, as previously described by Clermont et al. in 2013.13 A Taq polymerase (Life Technologies) was used and the PCR was performed in a Gene Amp® PCR System 2400 thermocycler (Applied Biosystems, USA).
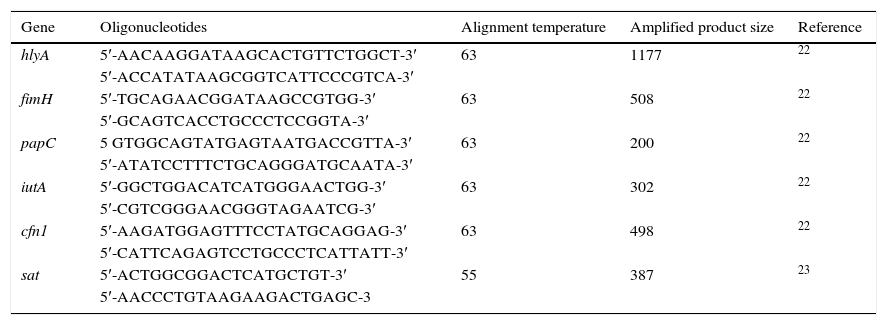
Detection of virulence genesA multiple PCR was used for genes hlyA, fimH, papC, iutA and cnf1, while a conventional simple PCR was used for the sat gene. The oligonucleotides used are shown in Table 1.22,23 The multiple reaction mixture had a volume of 25μl, containing 2μl of DNA, 4mM of MgCl2, 0.08mM of each of the 4 dNTPs, 0.6μM of each oligonucleotide and 2.5U of Taq polymerase. The amplification conditions were: denaturation for 5min at 94°C, 25 cycles of 30s at 94°C, 63°C/30s and 68°C/3min, and a final extension at 72°C/10min. As for the sat gene, the reaction mixture contained 3μl of buffer (10×), 0.9μl of MgCl2 (50mM), 0.6μl of dNTPs (2mM), 3μl (10μM) of each oligonucleotide, 0.15μl of Taq DNA polymerase (5U/μl), 3μl of template DNA and 16.35μl of H2O to give a final volume of 25μl. Under the following conditions: denaturation for 3min at 94°C, 35 cycles of 1min at 94°C, alignment at 58°C 1min and a final extension at 72°C/1min. Agarose gel electrophoresis (1.5%) was then performed at 100V for 90min. The gels were stained with ethidium bromide and those subjected to amplification were viewed in an ultraviolet transilluminator.
Oligonucleotides for the identification of virulence factors.
| Gene | Oligonucleotides | Alignment temperature | Amplified product size | Reference |
|---|---|---|---|---|
| hlyA | 5′-AACAAGGATAAGCACTGTTCTGGCT-3′ | 63 | 1177 | 22 |
| 5′-ACCATATAAGCGGTCATTCCCGTCA-3′ | ||||
| fimH | 5′-TGCAGAACGGATAAGCCGTGG-3′ | 63 | 508 | 22 |
| 5′-GCAGTCACCTGCCCTCCGGTA-3′ | ||||
| papC | 5 GTGGCAGTATGAGTAATGACCGTTA-3′ | 63 | 200 | 22 |
| 5′-ATATCCTTTCTGCAGGGATGCAATA-3′ | ||||
| iutA | 5′-GGCTGGACATCATGGGAACTGG-3′ | 63 | 302 | 22 |
| 5′-CGTCGGGAACGGGTAGAATCG-3′ | ||||
| cfn1 | 5′-AAGATGGAGTTTCCTATGCAGGAG-3′ | 63 | 498 | 22 |
| 5′-CATTCAGAGTCCTGCCCTCATTATT-3′ | ||||
| sat | 5′-ACTGGCGGACTCATGCTGT-3′ | 55 | 387 | 23 |
| 5′-AACCCTGTAAGAAGACTGAGC-3 |
The DNA of the isolates with the O25 serogroup was used to perform an allele-specific PCR for the pabB gene and to determine whether the strains belong to the O25-ST131 clone.24
Statistical analysisThe statistical analysis was performed using the STATA statistical package, v.11.0. The distribution of the variable was reported based on their frequencies of occurrence; biofilm production was compared using the Mann–Whitney U test. In order to compare the frequencies obtained for the virulence genes, adherence and haemolysin, the chi squared (χ2) test and Fisher's exact test were used, as applicable. p values of ≤0.05 were considered significant.
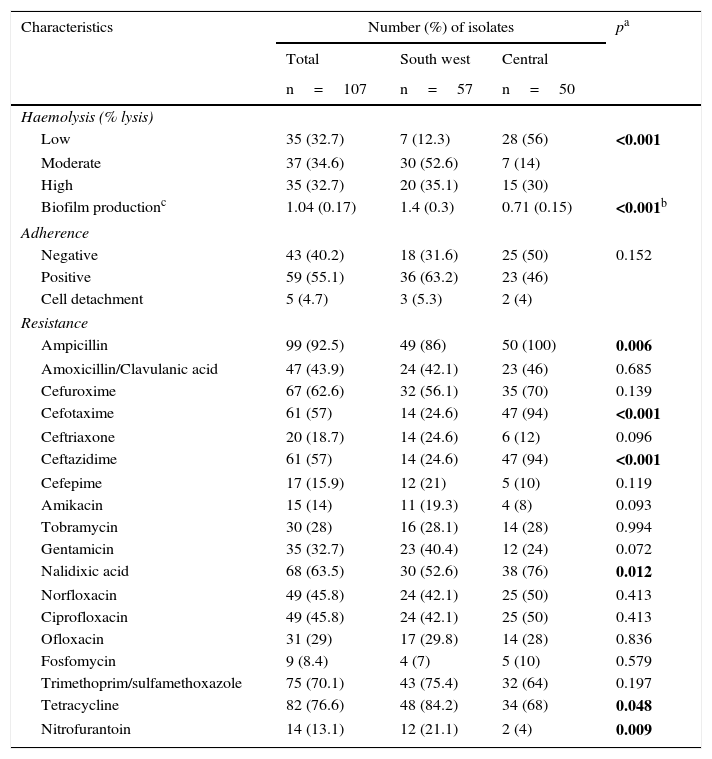
ResultsPhenotypic characteristicsThe phenotypic characteristics evaluated were: haemolytic capacity, biofilm production, adherence and antimicrobial resistance. The isolates in the south-western locality presented a significantly greater haemolytic capacity and biofilm production (p<0.001) compared to the isolates from the locality in central Mexico. Adherence assays on cultured Vero cells showed that 59 strains (55.1%) were positive; 43 isolates (40.2%) were negative and five isolates (4.7%) caused cell detachment. In general, the adherence pattern was aggregative.
The greatest percentage of resistance was detected with ampicillin (92.5%), tetracycline (76.6%) and trimethoprim/sulfamethoxazole (70.1%); a statistically significant difference was found in the resistance to ampicillin, cefotaxime, ceftazidime, nalidixic acid, tetracycline and nitrofurantoin between the two localities, with a greater resistance to ampicillin, cefotaxime, ceftazidime and nalidixic acid in the isolates from the locality in central Mexico, compared to the south-western one, which presented greater resistance to tetracycline and nitrofurantoin (Table 2).
Phenotypic characteristics of Escherichia coli isolates in two localities in Mexico.
| Characteristics | Number (%) of isolates | pa | ||
|---|---|---|---|---|
| Total | South west | Central | ||
| n=107 | n=57 | n=50 | ||
| Haemolysis (% lysis) | ||||
| Low | 35 (32.7) | 7 (12.3) | 28 (56) | <0.001 |
| Moderate | 37 (34.6) | 30 (52.6) | 7 (14) | |
| High | 35 (32.7) | 20 (35.1) | 15 (30) | |
| Biofilm productionc | 1.04 (0.17) | 1.4 (0.3) | 0.71 (0.15) | <0.001b |
| Adherence | ||||
| Negative | 43 (40.2) | 18 (31.6) | 25 (50) | 0.152 |
| Positive | 59 (55.1) | 36 (63.2) | 23 (46) | |
| Cell detachment | 5 (4.7) | 3 (5.3) | 2 (4) | |
| Resistance | ||||
| Ampicillin | 99 (92.5) | 49 (86) | 50 (100) | 0.006 |
| Amoxicillin/Clavulanic acid | 47 (43.9) | 24 (42.1) | 23 (46) | 0.685 |
| Cefuroxime | 67 (62.6) | 32 (56.1) | 35 (70) | 0.139 |
| Cefotaxime | 61 (57) | 14 (24.6) | 47 (94) | <0.001 |
| Ceftriaxone | 20 (18.7) | 14 (24.6) | 6 (12) | 0.096 |
| Ceftazidime | 61 (57) | 14 (24.6) | 47 (94) | <0.001 |
| Cefepime | 17 (15.9) | 12 (21) | 5 (10) | 0.119 |
| Amikacin | 15 (14) | 11 (19.3) | 4 (8) | 0.093 |
| Tobramycin | 30 (28) | 16 (28.1) | 14 (28) | 0.994 |
| Gentamicin | 35 (32.7) | 23 (40.4) | 12 (24) | 0.072 |
| Nalidixic acid | 68 (63.5) | 30 (52.6) | 38 (76) | 0.012 |
| Norfloxacin | 49 (45.8) | 24 (42.1) | 25 (50) | 0.413 |
| Ciprofloxacin | 49 (45.8) | 24 (42.1) | 25 (50) | 0.413 |
| Ofloxacin | 31 (29) | 17 (29.8) | 14 (28) | 0.836 |
| Fosfomycin | 9 (8.4) | 4 (7) | 5 (10) | 0.579 |
| Trimethoprim/sulfamethoxazole | 75 (70.1) | 43 (75.4) | 32 (64) | 0.197 |
| Tetracycline | 82 (76.6) | 48 (84.2) | 34 (68) | 0.048 |
| Nitrofurantoin | 14 (13.1) | 12 (21.1) | 2 (4) | 0.009 |
The statistically significant values are shown in bold.
The serological results showed that, for the “O” antigen, of the 107 isolates analysed, 98 (91.5%) were typable, nine (8.4%) were non-typable and nine presented as a rough phenotype. The typable isolates were distributed as 43 different serotypes, among which the most common serotype was O25:H4, with 23 isolates (21.5%): 9 (15.7%) in the south-western locality and 14 (28%) in the locality in central Mexico. For the “H” antigen, it was found that 70 isolates (65.4%) were typable, 10 (9.3%) were non-mobile and 27 isolates (25.2%) were non-typable. A statistically significant difference was found between serotype and locality (p=0.002).
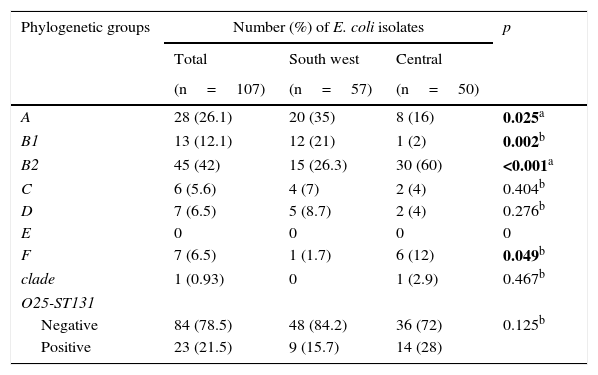
Phylogenetic groupsOf all the isolates, group B2 (42%) was the most predominant, followed by group A (26.1%). Groups A and B1 were most prevalent (35% and 21%, respectively) in the south-western locality, in contrast with phylogenetic groups B2 and F (60% and 12%, respectively), which were most common in the central locality, with statistically significant differences observed in these phylogenetic groups. Phylogenetic group E was not detected. Group O25-ST131 was also detected with a frequency of 21.5% and was mainly isolated in the central Mexican community (Table 3).
Distribution of the phylogenetic groups and O25-ST131 in two localities in Mexico.
| Phylogenetic groups | Number (%) of E. coli isolates | p | ||
|---|---|---|---|---|
| Total | South west | Central | ||
| (n=107) | (n=57) | (n=50) | ||
| A | 28 (26.1) | 20 (35) | 8 (16) | 0.025a |
| B1 | 13 (12.1) | 12 (21) | 1 (2) | 0.002b |
| B2 | 45 (42) | 15 (26.3) | 30 (60) | <0.001a |
| C | 6 (5.6) | 4 (7) | 2 (4) | 0.404b |
| D | 7 (6.5) | 5 (8.7) | 2 (4) | 0.276b |
| E | 0 | 0 | 0 | 0 |
| F | 7 (6.5) | 1 (1.7) | 6 (12) | 0.049b |
| clade | 1 (0.93) | 0 | 1 (2.9) | 0.467b |
| O25-ST131 | ||||
| Negative | 84 (78.5) | 48 (84.2) | 36 (72) | 0.125b |
| Positive | 23 (21.5) | 9 (15.7) | 14 (28) | |
The statistically significant values are shown in bold.
Irrespective of the geographical location, the most common virulence genes were fimH (86%), followed by iutA (54.2%) and sat (26.2%); four isolates (3.7%) were positive to the six genes evaluated. Fig. 1 shows the distribution of the virulence genes among the UPEC strains analysed in the two localities: the six genes evaluated were found in both localities. The genetic load was greater in the isolates in the central locality than in those in the south-western locality (U-test, p=0.0152). It is worth highlighting that, in eight isolates (7.5%), none of the six virulence genes evaluated was found. In the haemolysis assay, all the positive isolates for hlyA presented haemolytic activity.

No association was found between the presence of virulence genes and the production of biofilm (data not shown). However, papC and sat were significantly associated with adherence to cultured Vero cells (p<0.001 and p=0.010, respectively).
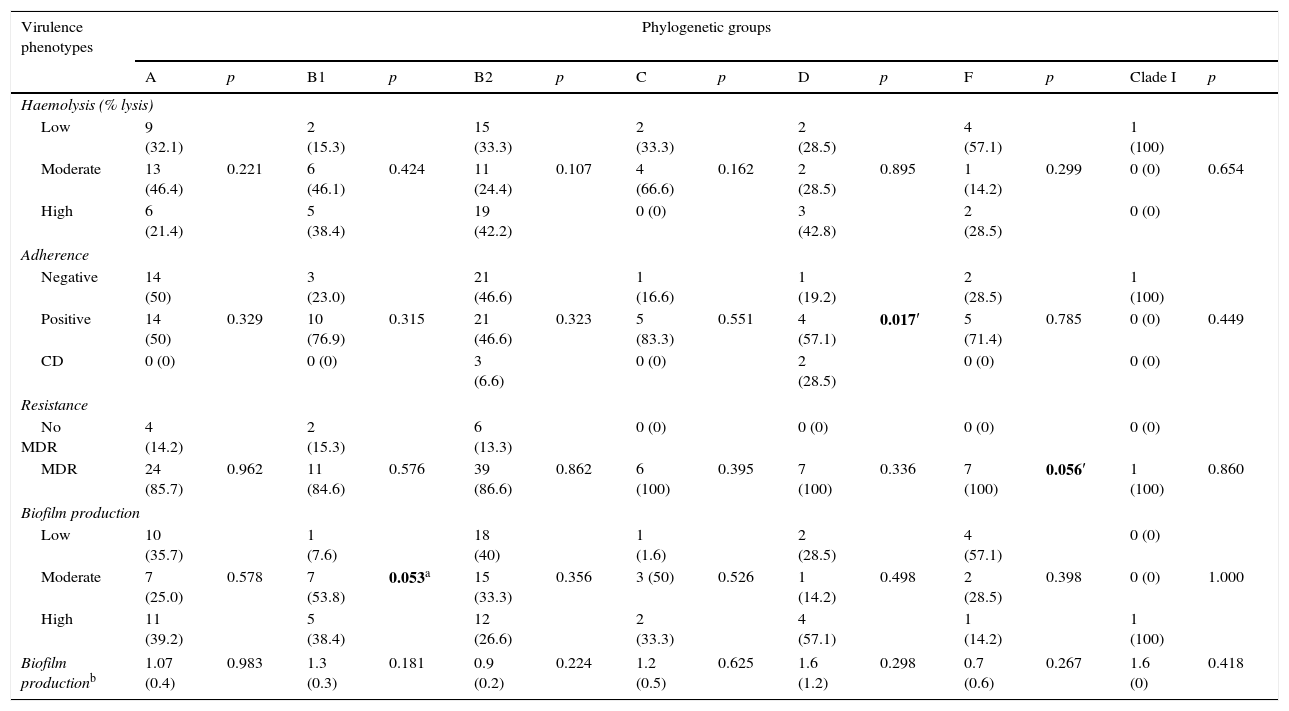
Virulence factors, phylogenetic group and antimicrobial resistanceOn correlating the phenotypic virulence factors with the phylogenetic groups, increased haemolysis production was found in groups B2 and D (42.2% and 42.8%, respectively). The adherence assays showed that all phylogenetic groups were capable of adhering to Vero cells, except clade I. The adherence percentages were greater than 50% in each group and, in group D, this association was statistically significant (p=0.017).
Of all the isolates, 92 (86%) were classified as MDR; these isolates belonged to all of the determined phylogenetic groups, with frequencies of over 85%. MDR was significantly associated with phylogenetic group F (p=0.056). Biofilm production was classified as low, moderate or high, depending on the optical density. High biofilm production was found in phylogenetic groups A and B1, and biofilm production was significantly associated with group B1 (p=0.053). It is worth mentioning that 86% of the biofilm-producing isolates were multidrug-resistant and serotype O25:H4 was the most MDR (Table 4).
Relationship between the phylogenetic group and the virulence phenotype and multidrug resistance in uropathogenic Escherichia coli.
| Virulence phenotypes | Phylogenetic groups | |||||||||||||
|---|---|---|---|---|---|---|---|---|---|---|---|---|---|---|
| A | p | B1 | p | B2 | p | C | p | D | p | F | p | Clade I | p | |
| Haemolysis (% lysis) | ||||||||||||||
| Low | 9 (32.1) | 2 (15.3) | 15 (33.3) | 2 (33.3) | 2 (28.5) | 4 (57.1) | 1 (100) | |||||||
| Moderate | 13 (46.4) | 0.221 | 6 (46.1) | 0.424 | 11 (24.4) | 0.107 | 4 (66.6) | 0.162 | 2 (28.5) | 0.895 | 1 (14.2) | 0.299 | 0 (0) | 0.654 |
| High | 6 (21.4) | 5 (38.4) | 19 (42.2) | 0 (0) | 3 (42.8) | 2 (28.5) | 0 (0) | |||||||
| Adherence | ||||||||||||||
| Negative | 14 (50) | 3 (23.0) | 21 (46.6) | 1 (16.6) | 1 (19.2) | 2 (28.5) | 1 (100) | |||||||
| Positive | 14 (50) | 0.329 | 10 (76.9) | 0.315 | 21 (46.6) | 0.323 | 5 (83.3) | 0.551 | 4 (57.1) | 0.017′ | 5 (71.4) | 0.785 | 0 (0) | 0.449 |
| CD | 0 (0) | 0 (0) | 3 (6.6) | 0 (0) | 2 (28.5) | 0 (0) | 0 (0) | |||||||
| Resistance | ||||||||||||||
| No MDR | 4 (14.2) | 2 (15.3) | 6 (13.3) | 0 (0) | 0 (0) | 0 (0) | 0 (0) | |||||||
| MDR | 24 (85.7) | 0.962 | 11 (84.6) | 0.576 | 39 (86.6) | 0.862 | 6 (100) | 0.395 | 7 (100) | 0.336 | 7 (100) | 0.056′ | 1 (100) | 0.860 |
| Biofilm production | ||||||||||||||
| Low | 10 (35.7) | 1 (7.6) | 18 (40) | 1 (1.6) | 2 (28.5) | 4 (57.1) | 0 (0) | |||||||
| Moderate | 7 (25.0) | 0.578 | 7 (53.8) | 0.053a | 15 (33.3) | 0.356 | 3 (50) | 0.526 | 1 (14.2) | 0.498 | 2 (28.5) | 0.398 | 0 (0) | 1.000 |
| High | 11 (39.2) | 5 (38.4) | 12 (26.6) | 2 (33.3) | 4 (57.1) | 1 (14.2) | 1 (100) | |||||||
| Biofilm productionb | 1.07 (0.4) | 0.983 | 1.3 (0.3) | 0.181 | 0.9 (0.2) | 0.224 | 1.2 (0.5) | 0.625 | 1.6 (1.2) | 0.298 | 0.7 (0.6) | 0.267 | 1.6 (0) | 0.418 |
CD: cell detachment.
The statistically significant values are shown in bold.
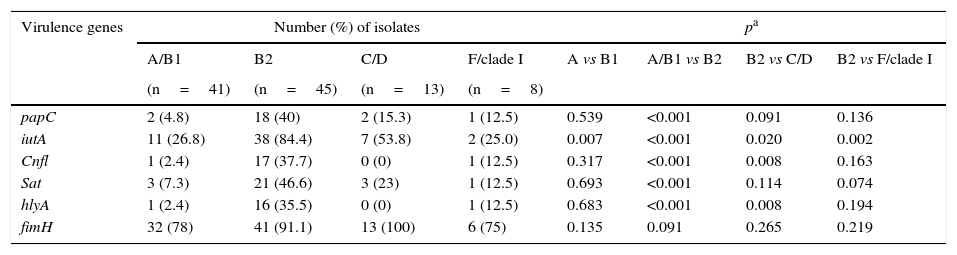
The highest number of virulence genes evaluated belonged to phylogenetic group B2 (Table 5). Gene fimH was distributed across all of the groups. The highest frequency of the papC and sat genes was found in group B2, in comparison to groups A/B1. The iutA gene was significantly more common in group B2 compared to the other phylogenetic groups. The cnfl and hlyA genes were most common in group B2, in comparison to group A, B1, C and D.
Distribution of virulence genes among the phylogenetic groups of uropathogenic Escherichia coli.
| Virulence genes | Number (%) of isolates | pa | ||||||
|---|---|---|---|---|---|---|---|---|
| A/B1 | B2 | C/D | F/clade I | A vs B1 | A/B1 vs B2 | B2 vs C/D | B2 vs F/clade I | |
| (n=41) | (n=45) | (n=13) | (n=8) | |||||
| papC | 2 (4.8) | 18 (40) | 2 (15.3) | 1 (12.5) | 0.539 | <0.001 | 0.091 | 0.136 |
| iutA | 11 (26.8) | 38 (84.4) | 7 (53.8) | 2 (25.0) | 0.007 | <0.001 | 0.020 | 0.002 |
| Cnfl | 1 (2.4) | 17 (37.7) | 0 (0) | 1 (12.5) | 0.317 | <0.001 | 0.008 | 0.163 |
| Sat | 3 (7.3) | 21 (46.6) | 3 (23) | 1 (12.5) | 0.693 | <0.001 | 0.114 | 0.074 |
| hlyA | 1 (2.4) | 16 (35.5) | 0 (0) | 1 (12.5) | 0.683 | <0.001 | 0.008 | 0.194 |
| fimH | 32 (78) | 41 (91.1) | 13 (100) | 6 (75) | 0.135 | 0.091 | 0.265 | 0.219 |
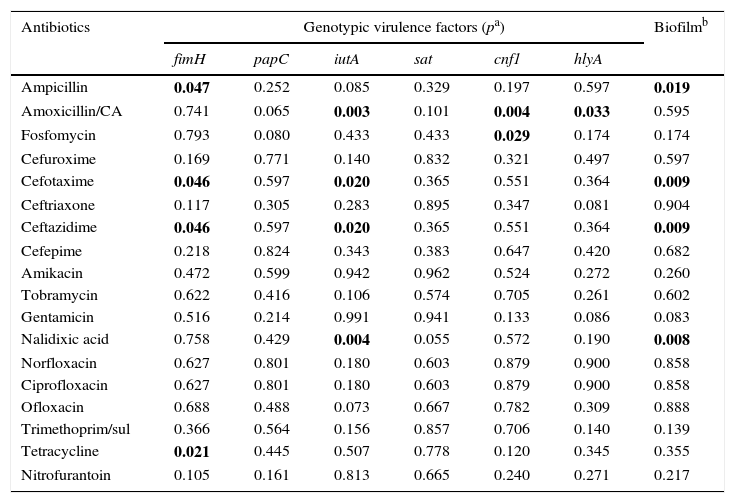
Table 6 shows the relationship between antimicrobial resistance and virulence genes. The frequency of the fimH gene was significantly higher in the isolates resistant to ampicillin, cefotaxime, ceftazidime and tetracycline, compared to the susceptible isolates. The iutA gene was associated with resistance to amoxicillin/clavulanic acid, cefotaxime, ceftazidime and nalidixic acid. The cnf1 gene was associated with resistance to amoxicillin/clavulanic acid and fosfomycin (p values=0.004 and 0.029, respectively). The hlyA gene was only associated with amoxicillin/clavulanic acid (p=0.033). When biofilm production was analysed with antimicrobial resistance, a statistically significant difference was found with resistance to ampicillin, cefotaxime, ceftazidime and nalidixic acid. On evaluating the resistance and phylogenetic group, it was found that the isolates belonging to phylogenetic group B2 were more resistant to cefotaxime and ceftazidime (p=0.009).
Relationship between virulence factors and antimicrobial resistance.
| Antibiotics | Genotypic virulence factors (pa) | Biofilmb | |||||
|---|---|---|---|---|---|---|---|
| fimH | papC | iutA | sat | cnf1 | hlyA | ||
| Ampicillin | 0.047 | 0.252 | 0.085 | 0.329 | 0.197 | 0.597 | 0.019 |
| Amoxicillin/CA | 0.741 | 0.065 | 0.003 | 0.101 | 0.004 | 0.033 | 0.595 |
| Fosfomycin | 0.793 | 0.080 | 0.433 | 0.433 | 0.029 | 0.174 | 0.174 |
| Cefuroxime | 0.169 | 0.771 | 0.140 | 0.832 | 0.321 | 0.497 | 0.597 |
| Cefotaxime | 0.046 | 0.597 | 0.020 | 0.365 | 0.551 | 0.364 | 0.009 |
| Ceftriaxone | 0.117 | 0.305 | 0.283 | 0.895 | 0.347 | 0.081 | 0.904 |
| Ceftazidime | 0.046 | 0.597 | 0.020 | 0.365 | 0.551 | 0.364 | 0.009 |
| Cefepime | 0.218 | 0.824 | 0.343 | 0.383 | 0.647 | 0.420 | 0.682 |
| Amikacin | 0.472 | 0.599 | 0.942 | 0.962 | 0.524 | 0.272 | 0.260 |
| Tobramycin | 0.622 | 0.416 | 0.106 | 0.574 | 0.705 | 0.261 | 0.602 |
| Gentamicin | 0.516 | 0.214 | 0.991 | 0.941 | 0.133 | 0.086 | 0.083 |
| Nalidixic acid | 0.758 | 0.429 | 0.004 | 0.055 | 0.572 | 0.190 | 0.008 |
| Norfloxacin | 0.627 | 0.801 | 0.180 | 0.603 | 0.879 | 0.900 | 0.858 |
| Ciprofloxacin | 0.627 | 0.801 | 0.180 | 0.603 | 0.879 | 0.900 | 0.858 |
| Ofloxacin | 0.688 | 0.488 | 0.073 | 0.667 | 0.782 | 0.309 | 0.888 |
| Trimethoprim/sul | 0.366 | 0.564 | 0.156 | 0.857 | 0.706 | 0.140 | 0.139 |
| Tetracycline | 0.021 | 0.445 | 0.507 | 0.778 | 0.120 | 0.345 | 0.355 |
| Nitrofurantoin | 0.105 | 0.161 | 0.813 | 0.665 | 0.240 | 0.271 | 0.217 |
CA: clavulanic acid; trimethoprim/sul: trimethoprim/sulfamethoxazole.
The statistically significant values are shown in bold.
It has been reported that UTI-causing E. coli strains mostly belong to phylogenetic groups B2 and D and have a higher number of virulence factors in comparison to the strains that are considered to be commensal, which belong to phylogenetic groups A and B1.22 In our study, in the locality in central Mexico, the majority of the isolates belonged to phylogenetic group B2 (60%) and presented a higher number of virulence factors; in contrast, in the south-western locality, phylogenetic group A was the most common (35%) and presented a lower number of virulence genes. Group F was also prevalent in the central locality (statistically significant value), while C and D were more prevalent in the south west, although no significant differences were found. In a previous study conducted in Mexico,25 where only four phylogenetic groups were determined, the majority of UTI-associated isolates were found to belong to phylogenetic group B2 (55.6%), followed by group A (30.6%). Similar results were reported in the Faisalabad region of Pakistan26: 50% of the UPEC isolates belonged to group B2, followed by groups A and B1 (19%). Our results confirm that strains considered to be commensal (groups A and B1) can cause UTIs and acquire horizontally-transferred virulence genes in the gastrointestinal tract, thus allowing them to colonise the urinary tract.12,25 Moreover, studies conducted on commensal strains and pathogens in different regions indicate that geographical/climactic conditions, diet, antibiotic use and genetic factors may cause the commensal flora to acquire virulence genes and become potentially pathogenic.27
The mechanisms through which virulence factors promote UTI development have been documented, and the number of genes may be proportional to the potential pathogen12,28; fimH, iutA and sat genes (96%, 68% and 36%, respectively) were more common in the central locality, where phylogenetic group B was most predominant. The high frequency of the fimH gene indicates its importance in the initial infection phase, as FimH recognises the receptors on the surface of the bladder cells, facilitating bacterial colonisation, while IutA is the most important hydroxamate receptor during the infection that contributes to colonisation.29,30
The Sat toxin is a serine protease that exhibits cytopathic activity on HEp-2 and Vero cells; in the kidneys, it has been characterised for causing vacuolisation and glomerular damage.28 PapC is an essential external membrane protein for P pili biogenesis that has been associated with pyelonephritis due to the adherence of the PapG adhesin to host cell receptors.8 In this study, the sat and papC genes were significantly associated with adherence to Vero cells, which may indicate that these strains cause infections in the upper urinary tract. The adherence pattern observed was generally aggregative, which is characteristic of enteroaggregative E. coli (EAEC). Abe et al.31 reported this phenotype in 6.9% of the adherent UPEC strains and mention that some EAEC isolates may cause UTIs, so it would thus be important to determine virulence characteristics of diarrhoeagenic pathotypes in UPEC strains.
Some studies report α-haemolysin as the most prevalent toxin.15,32 The frequency of hlyA and cnf1 (16.8% and 17.8%, respectively) was greater in our study in comparison to previous reports in Mexico conducted by López-Banda et al.,25 where the prevalence recorded was 7.4% and 6.5%, respectively. The frequency of isolates with a high haemolysis percentage belonged to phylogenetic group B2, which suggests that the presence of HlyA could be associated with the severity of the UTIs.28 The combined presence of papC, cnf1 and hlyA is evidence of the pathogenicity island II of strain J96, which has already been reported in strains of UTI-causing E. coli.33 In our study, the simultaneous presence of papC, cnf1 and hlyA was observed in nine isolates; this frequency is greater than that reported in other countries, which ranges from two to four isolates.25,26,32
Antibiotic resistance in this study was greater than that reported in Mexico and other countries.25,32,34,35 The significant differences in resistance to amoxicillin, cefotaxime, ceftazidime and nalidixic acid among the study populations may be due to the fact that, in the locality in central Mexico, most of the isolates belonged to phylogenetic group B2. Phylogenetic group B has been linked to group O25bST131 (21.5% of the MDR isolates belonged to this group), which has managed to spread in Mexico.16 Group O25bST131 has been associated with the production of extended-spectrum β-lactamases (mainly type CTX-M-15) and fluoroquinolone resistance in the community.24,36 Moreover, a statistically significant association was found between these three antibiotics and biofilm production, which suggests that acquiring resistance to some antibiotics may decrease biofilm production, as in the case of resistance to third-generation cephalosporins and quinolones.37,38 It has also been documented that biofilm-forming bacteria present increased antimicrobial resistance and infection chronicity, as well as being associated with recurrent UTIs.39,40 The isolates in the south-western locality presented greater resistance to tetracycline and nitrofurantoin (statistically significant differences) than in central Mexico. In Mexico, nitrofurantoin resistance of between 5.1% and 7.4% has been reported.16,34 However, we found that 13.1% of the isolates were resistant, and this increase may be associated with the more frequent use of this antibiotic in the south-western community.
Resistance to cefotaxime and ceftazidime may be related to the production of extended-spectrum β-lactamases, which may be present in phylogenetic groups A and B1 of the south-western locality.
In our study, quinolone resistance was associated with the presence of iutA and sat genes; these virulence factors have been reported in nalidixic acid-resistant isolates.32,41 Resistance to amoxicillin/clavulanic acid was associated with iutA, cnf1 and hlyA genes; these virulence genes have been reported in extended-spectrum β-lactamase-producing UPEC strains.36 These results reflect the heterogeneous distribution of virulence genes and antibiotic resistance among UPEC strains; it is important to describe the characteristics that define the UPEC isolates within the different study populations.
In conclusion, the phylogenetic group, virulence factors and antibiotic susceptibility of UTI-causing E. coli vary significantly among the Mexican populations studied. Phylogenetic group A may be multidrug-resistant and has the capacity to cause urinary infections. MDR is present across all the phylogenetic groups, which complicates and decreases the therapeutic options in patients with UTIs in the community.
FundingThis study was supported by the project funded at the “Convocatoria de Apoyo al Fortalecimiento y Desarrollo de la Infraestructura Científica y Tecnológica 2014” [Meeting to Support the Strengthening and Development of Scientific and Technical Infrastructure 2014], key 229958. We would also like to thank the Mexican National Council of Science and Technology (CONACYT) for the financial support it provided to project number 166004: “Role of plasmids and integrons in multidrug resistance to antimicrobials among strains of uropathogenic Escherichia coli and their potential association with adherence and invasiveness in cultured cells”.
Conflicts of interestThe authors declare that they have no conflicts of interest.
To the Enteric Pathogen Laboratory of the Department of Public Health of the National Autonomous University of Mexico's Faculty of Medicine, for serotyping the strains.
Please cite this article as: Miranda-Estrada LI, Ruíz-Rosas M, Molina-López J, Parra-Rojas I, González-Villalobos E, Castro-Alarcón N. Relación entre factores de virulencia, resistencia a antibióticos y los grupos filogenéticos de Escherichia coli uropatógena en dos localidades de México. Enferm Infecc Microbiol Clin. 2017;35:426–433.
