


To assess the relationship between metabolic control (MC) and frequency of self-monitoring of blood glucose (SMBG) in insulin-treated patients with type 1 (T1DM) and type 2 (T2DM) diabetes mellitus, and to analyze the factors associated to MC.
Materials and methodsA multicenter, cross-sectional, observational study was conducted in which endocrinologists enrolled diabetic patients treated with insulin who used a glucometer. The cut-off value for MC was HbA1c≤7%. Grade of acceptance of the glucometer was assessed using a visual analogue scale (VAS).
ResultsA total of 341 patients (53.5% males) with a mean age (SD) 52.8 (16.3) years, mean HbA1c of 7.69% (1.25) and 128 (37.5%) with T1DM and 211 (61.9%) with T2DM were evaluable. SMBG was done by 86.1% at least once weekly. No relationship was seen between MC and SMBG (p=0.678) in the overall sample or in the T1DM (p=0.940) or T2DM (p=0.343) subgroups. In the logistic regression model, hyperglycemic episodes (Exp-b [risk] 1.794, p=0.022), falsely elevated HbA1c values (Exp-b 3.182, p=0.005), and VAS (Exp-b 1.269, p=0.008) were associated to poor MC in the total sample. Hyperglycemic episodes (Exp-b 2.538, p=0.004), falsely elevated HbA1c values (Exp-b 3.125, p=0.012), and VAS (Exp-b 1.316, p=0.026) were associated to poor MC in the T2DM subgroup, while body mass index (Exp-b 1.143, p=0.046) was associated to poor MC in the T1DM subgroup.
ConclusionsIn this retrospective, non-controlled study on patients with DM treated with insulin who used a glucometer, no relationship was seen between the degree of metabolic control and frequency of use of the glucometer.
Evaluar la relación entre el grado de control metabólico (CM) y la frecuencia de la automonitorización de la glucemia capilar (AGC) en pacientes con diabetes mellitus (DM) tipo 1 (DM1) y 2 (DM2) tratados con insulina, y analizar factores asociados al CM.
Material y métodosEstudio observacional multicéntrico transversal en el que endocrinólogos incluyeron a pacientes con DM tratados con insulina que utilizaban un glucómetro. El punto de corte para definir un CM fue una HbA1c ≤ 7% y no control>7%. Se valoró en una escala analógica visual (EAV) el grado de aceptación del glucómetro.
ResultadosFueron evaluables 341 pacientes (53,5% varones), con una edad media ± DE de 52,8 ± 16,3 años, HbA1c media de 7,69 ± 1,25%, 128 (37,5%) con DM1 y 211 (61,9%) con DM2. El 86,1% de los pacientes utilizaron el glucómetro al menos una vez en la semana. No se observó ninguna relación entre el CM y la AGC ni en la muestra total (p=0,678), ni en DM1 (p=0,940) ni DM2 (p=0,343). En el modelo de regresión logística, se asociaron a un mal CM en la muestra total y en DM2 los episodios de hiperglucemias (Exp-b [riesgo] 1,794, p=0,022, y Exp-b 2,538, p=0,004, respectivamente), las concentraciones de HbA1c falsamente elevadas (Exp-b 3,182 p=0,005, y Exp-b 3,125, p=0,012), y la EAV (Exp-b 1,269, p=0,008, y Exp-b 1,316, p=0,026), y en la DM1 el índice de masa corporal (Exp-b 1,143, p=0,046).
ConclusionesEn este estudio observacional no controlado en pacientes con DM tratados con insulina que utilizan un glucómetro no se observa ninguna relación entre el grado de CM y la frecuencia de su uso en el último mes.
In 2010, 2.5% of all deaths worldwide were due to diabetes mellitus (DM).1 The prevalence of DM in Spain is 13.8%, and it should be noted that approximately half the patients do not know they are affected.2 This is particularly important, because adequate blood glucose control has been shown to decrease microvascular complications.3 It is well known that DM is a significant public health problem because of both its prevalence and associated comorbidities and the huge direct and indirect health costs derived from its care. All measures taken to achieve adequate blood glucose control will therefore help in reducing the costs incurred by patients with DM, which are higher than those incurred by non-diabetic patients in Spain.4 One such measure, used in patients with both type 1 (T1DM) and type 2 DM (T2DM) on insulin therapy, is the self-monitoring of blood glucose (SMBG). SMBG is a widely recognized procedure for adequate blood glucose management in patients with DM on insulin therapy5 because it allows both for the measuring of glucose under various circumstances, and for the detecting of hypoglycemia and glycemic excursions.6
However, little attention has been paid as to whether the impact of SMBG self-testing of insulin-treated patients with DM performed in daily clinical practice is dependent on good metabolic control, determined by plasma levels of glycosylated hemoglobin (HbA1c), being achieved or not. The primary objective of this study was therefore to assess the relationship between metabolic control and SMBG frequency over the preceding month in insulin-treated patients with DM. Risk factors associated with poor metabolic control and patient acceptance of blood glucose measuring devices were also analyzed.
Patients and methodsA multicenter, observational, cross-sectional study including insulin-treated patients with T1DM and T2DM was conducted. The study was conducted by endocrinologists at outpatient clinics of hospitals from all the Spanish autonomous communities.
Selection criteria and objectivesThe patients enrolled met the following criteria: (a) they were 18 years of age or older; (b) they were controlled by endocrinologists; (c) they had been treated with at least two doses of insulin, or premixed insulins, for at least one year, and (d) they had been using a glucometer for at least three months. The primary study objective was to assess the relationship between HbA1c values at data collection (metabolic control) and SMBG frequency over the preceding month in controlled versus uncontrolled patients. Secondary objectives included: (a) to identify predictors of poor metabolic control, and (b) to assess the degree of acceptance of SMBG devices used by patients. All the results in the total sample of evaluable DM patients and in the T1DM and T2DM subgroups were analyzed.
Study conductInvestigators collected at a single visit retrospective information including demographic and anthropometric data, associated cardiovascular risk factors, the presence or absence of comorbidities, data related to DM, information on insulin therapy, glycemic decompensations (hypoglycemia and hyperglycemia) and possible false HbA1c values. Thirty-five endocrinologists, each required to enroll 10–11 patients with T1DM and T2DM, were invited to participate. These endocrinologists belonged to hospital endocrinology departments. The study was assessed and approved by the Ethics Committee of the Galician SERGAS, and all patients signed an informed consent form.
Definitions and proceduresPatients with HbA1c values≤7.0% were considered to be well controlled, and those with HbA1c values>7.0% were considered to be uncontrolled. Glycemic decompensations referred to those occurring in the preceding six months. For hypoglycemia, a blood glucose level<50mg/dL, lower than usual, was selected as recommended by the European Medicines Agency for increasing the specificity of the test in patients on drug treatment.7 Hyperglycemia was defined as blood glucose levels>200mg/dL, and severe hypoglycemia as that where the patient required medical assistance. HbA1c values were considered falsely elevated when they were associated with salicylate ingestion, chronic kidney disease (stages 3–5, except stage 5D, which requires dialysis), anemia from vitamin B12, folic acid or Iron deficiency, or chronic alcoholism, and falsely decreased when associated with pregnancy, chronic renal disease in stage 5D, active bleeding, splenectomy, or hemoglobinopathy. The insulin regimen reported in patients was one of the options used in standard clinical practice. To analyze patient use of the glucometer, use frequency and the number of reagent strips used were analyzed. With regard to frequency, patients were asked if they performed measurements <3 times monthly, 1–3 times weekly, 3–6 times weekly, 1–3 times daily, or >3 times daily. They were also asked if they used one, two, three, or more than three reagent strips daily. To assess patient satisfaction with the glucometer, a 10-cm visual analogue scale8 (VAS) where 0 corresponded to maximum dissatisfaction and 10 to maximum satisfaction was used.
Statistical analysisFor univariate analyses, quantitative variables were described as measures of central tendency and dispersion: mean±standard deviation (SD). For bivariate and multivariate analyses, a parametric t-test or a non-parametric Mann–Whitney test was used. A Chi-square test or a Fisher's exact test was used to compare proportions. For the primary variable, the relationship between HbA1c and the use of SMBG, absolute and relative frequencies of controlled and uncontrolled patients depending on SMBG frequency, on the one hand, and the use of reagent strips, on the other hand were reported (as previously described). To study the first secondary objective, the predictors of poor metabolic control, a logistic regression model was used. The bivariate logistic regression variables included were: age, the body mass index (BMI), the type of diabetes, treatment time, hyperglycemia, hypoglycemia, severe hypoglycemia, “falsely high” or “falsely low” HbA1c concentrations, insulin therapy, treatment with oral antidiabetics, dietary changes, physical exercise, the number of strips used with the glucometer over the preceding week, the frequency of blood glucose measurement with the glucometer over the preceding four weeks, and the VAS score. Variables with a value of p<0.3 were considered as risk factors for possible poor metabolic control. A stepwise selection was made with metabolic control as the dependent variable. For the second secondary objective, patient acceptance of the SMBG devices, the VAS score was used. The 95% confidence intervals of the outcome variables associated with the secondary objectives were calculated. A value of p<0.05 was considered statistically significant. For sample size calculation, patients were stratified by type of diabetes. Using a two-sided significance test and an alpha risk of 0.05, and taking into consideration an 80% power for detecting changes in the slope of 0.00 (null or no correlation hypothesis) to 26% (alternative hypothesis), assuming a 2.2 standard deviation in the number of measurements performed by patients and a standard deviation of 2.0% in HbA1c value, based on a previous study by Schütt et al.,9 a sample consisting of 91 patients with T1DM and 248 patients with T2DM was required, based on the estimated rates of T1DM and T2DM in Spain.2
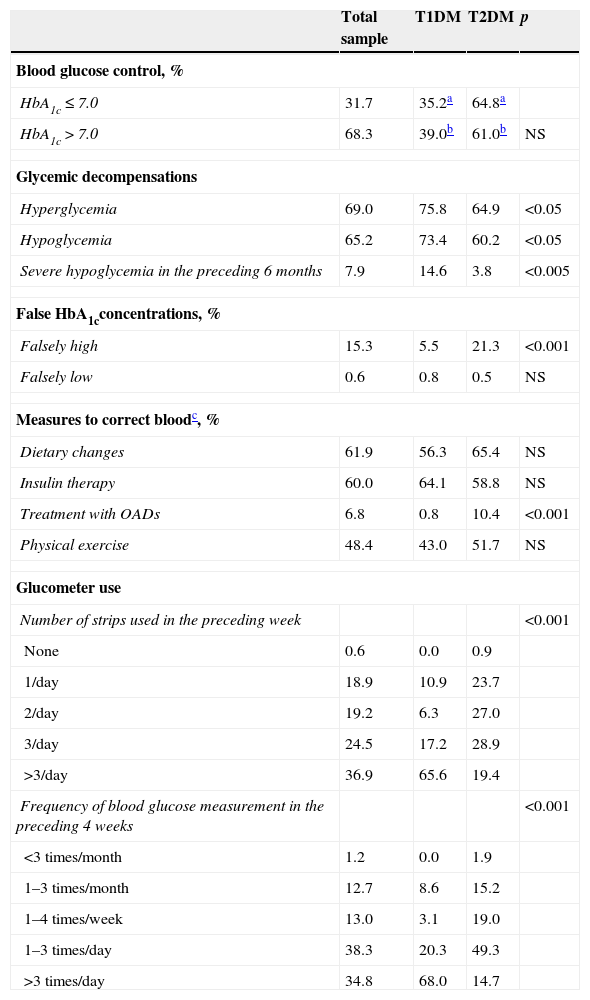
ResultsBaseline sample dataThe 33 endocrinologists involved in the study enrolled, between January 3, 2013 and March 30, 2014 a total of 341 evaluable patients (53.5% males) with a mean age±SD of 52.8±16.3 years. 96.7% of the patients were white, and the mean BMI was 28.9±5.6kg/m2. The associated risk factors or cardiovascular diseases included high blood pressure (77.1% of patients), dyslipidemia (77.1%), prior cardiovascular disease (23.4%), smoking (14.2%), ischemic heart disease (16.5%), peripheral artery disease (10.4%), and cerebrovascular disease (7.8%). The mean HbA1c concentration was 7.69±1.25%, and the mean time on insulin therapy was 90.0±99 months (range, 2–540). The total sample consisted of 128 patients with T1DM (37.5%), 211 with T2DM (61.9%), and two patients with both diagnoses who were excluded from the comparative analysis. The age of the two subgroups was 37.1±12.7 years and 62.1±9.8 years, respectively (p<0.001). Table 1 shows the degree of blood glucose control, glycemic decompensations, “false” HbA1c values, actions to correct blood glucose, the use of the glucometer, and insulinization regimens in the total sample and in the T1DM and T2DM subgroups. No differences in blood glucose control were seen between the two subgroups, but patients with T1DM had significantly more episodes of hyperglycemia (p<0.05) and hypoglycemia (p<0.05) and severe hypoglycemia (p<0.005). Glucometer use was more common in patients with T1DM (p<0.001) (Table 1).
Data on blood glucose levels and glucometer use.
| Total sample | T1DM | T2DM | p | |
|---|---|---|---|---|
| Blood glucose control, % | ||||
| HbA1c≤7.0 | 31.7 | 35.2a | 64.8a | |
| HbA1c>7.0 | 68.3 | 39.0b | 61.0b | NS |
| Glycemic decompensations | ||||
| Hyperglycemia | 69.0 | 75.8 | 64.9 | <0.05 |
| Hypoglycemia | 65.2 | 73.4 | 60.2 | <0.05 |
| Severe hypoglycemia in the preceding 6 months | 7.9 | 14.6 | 3.8 | <0.005 |
| False HbA1cconcentrations, % | ||||
| Falsely high | 15.3 | 5.5 | 21.3 | <0.001 |
| Falsely low | 0.6 | 0.8 | 0.5 | NS |
| Measures to correct bloodc, % | ||||
| Dietary changes | 61.9 | 56.3 | 65.4 | NS |
| Insulin therapy | 60.0 | 64.1 | 58.8 | NS |
| Treatment with OADs | 6.8 | 0.8 | 10.4 | <0.001 |
| Physical exercise | 48.4 | 43.0 | 51.7 | NS |
| Glucometer use | ||||
| Number of strips used in the preceding week | <0.001 | |||
| None | 0.6 | 0.0 | 0.9 | |
| 1/day | 18.9 | 10.9 | 23.7 | |
| 2/day | 19.2 | 6.3 | 27.0 | |
| 3/day | 24.5 | 17.2 | 28.9 | |
| >3/day | 36.9 | 65.6 | 19.4 | |
| Frequency of blood glucose measurement in the preceding 4 weeks | <0.001 | |||
| <3 times/month | 1.2 | 0.0 | 1.9 | |
| 1–3 times/month | 12.7 | 8.6 | 15.2 | |
| 1–4 times/week | 13.0 | 3.1 | 19.0 | |
| 1–3 times/day | 38.3 | 20.3 | 49.3 | |
| >3 times/day | 34.8 | 68.0 | 14.7 | |
T1DM: type 1 diabetes mellitus; T2DM: type 2 diabetes mellitus; NS: not statistically significant. p: significance level between T1DM and T2DM groups.
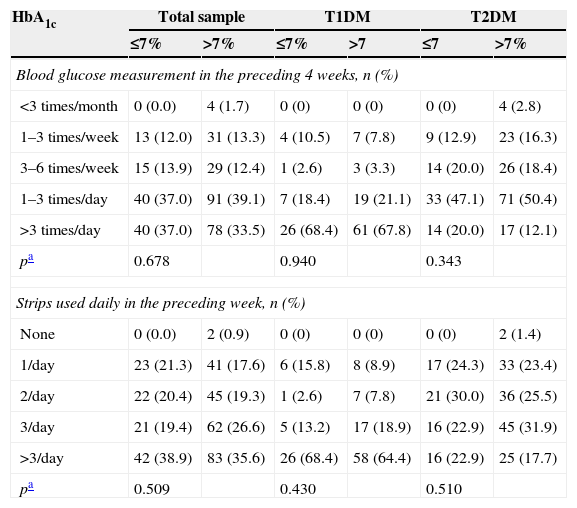
No relationship was found in the overall sample between metabolic control and SMBG over the preceding four weeks (p=0.678) or the daily number of reagent strips used in the preceding week (p=0.509). No relationship was seen either in the patient subgroups with T1DM (p=0.940 and p=0.430, respectively) or T2DM (p=0.343 and p=0.510, respectively) (Table 2).
Glucometer use depending on the presence or absence of metabolic control.
| HbA1c | Total sample | T1DM | T2DM | |||
|---|---|---|---|---|---|---|
| ≤7% | >7% | ≤7% | >7 | ≤7 | >7% | |
| Blood glucose measurement in the preceding 4 weeks, n (%) | ||||||
| <3 times/month | 0 (0.0) | 4 (1.7) | 0 (0) | 0 (0) | 0 (0) | 4 (2.8) |
| 1–3 times/week | 13 (12.0) | 31 (13.3) | 4 (10.5) | 7 (7.8) | 9 (12.9) | 23 (16.3) |
| 3–6 times/week | 15 (13.9) | 29 (12.4) | 1 (2.6) | 3 (3.3) | 14 (20.0) | 26 (18.4) |
| 1–3 times/day | 40 (37.0) | 91 (39.1) | 7 (18.4) | 19 (21.1) | 33 (47.1) | 71 (50.4) |
| >3 times/day | 40 (37.0) | 78 (33.5) | 26 (68.4) | 61 (67.8) | 14 (20.0) | 17 (12.1) |
| pa | 0.678 | 0.940 | 0.343 | |||
| Strips used daily in the preceding week, n (%) | ||||||
| None | 0 (0.0) | 2 (0.9) | 0 (0) | 0 (0) | 0 (0) | 2 (1.4) |
| 1/day | 23 (21.3) | 41 (17.6) | 6 (15.8) | 8 (8.9) | 17 (24.3) | 33 (23.4) |
| 2/day | 22 (20.4) | 45 (19.3) | 1 (2.6) | 7 (7.8) | 21 (30.0) | 36 (25.5) |
| 3/day | 21 (19.4) | 62 (26.6) | 5 (13.2) | 17 (18.9) | 16 (22.9) | 45 (31.9) |
| >3/day | 42 (38.9) | 83 (35.6) | 26 (68.4) | 58 (64.4) | 16 (22.9) | 25 (17.7) |
| pa | 0.509 | 0.430 | 0.510 | |||
T1DM: type 1 diabetes mellitus; T2DM: type 2 diabetes mellitus.
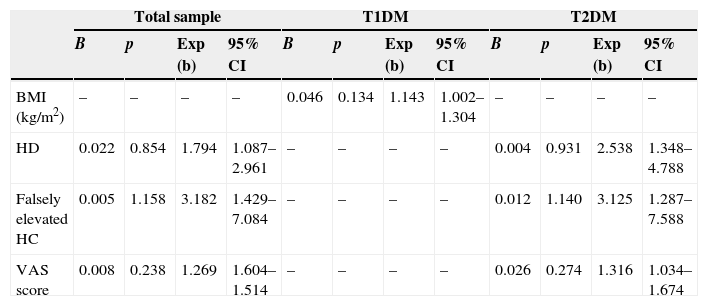
Table 3 shows the factors predicting for poor metabolic control derived from the variables of the bivariate models with a value of p<0.3 included in the final model. In the total sample, such predictors were hyperglycemia (risk: 1.794, p=0.022), falsely elevated HbA1c concentrations (risk: 3.182, p=0.005), and the VAS (risk: 1.269, p=0.008). In other words, the risk of lack of control was 1.8-fold greater in patients who experienced hyperglycemia, 3.2-fold greater in patients with falsely elevated HbA1c values, and 1.3-fold greater for each one-point increase in the VAS. In patients in the T1DM subgroup, the only variable associated was the BMI (risk: 1.143, p=0.046), so that each unit increase in the BMI increased 1.1-fold the risk of lack of control. In patients in the T2DM subgroup, as in the total sample, the variables associated with poor metabolic control were hyperglycemia (risk: 2.538, p=0.004), falsely elevated HbA1c values (risk: 3.125, p=0.012), and the VAS (risk: 1.316, 95% CI, 1.034–1.674, p=0.026).
Factors associated with poor metabolic control. Significant variables in the final logistic regression model.
| Total sample | T1DM | T2DM | ||||||||||
|---|---|---|---|---|---|---|---|---|---|---|---|---|
| B | p | Exp (b) | 95% CI | B | p | Exp (b) | 95% CI | B | p | Exp (b) | 95% CI | |
| BMI (kg/m2) | – | – | – | – | 0.046 | 0.134 | 1.143 | 1.002–1.304 | – | – | – | – |
| HD | 0.022 | 0.854 | 1.794 | 1.087–2.961 | – | – | – | – | 0.004 | 0.931 | 2.538 | 1.348–4.788 |
| Falsely elevated HC | 0.005 | 1.158 | 3.182 | 1.429–7.084 | – | – | – | – | 0.012 | 1.140 | 3.125 | 1.287–7.588 |
| VAS score | 0.008 | 0.238 | 1.269 | 1.604–1.514 | – | – | – | – | 0.026 | 0.274 | 1.316 | 1.034–1.674 |
HC: HbA1c concentrations; HD: hyperglycemic decompensation, defined as blood glucose>200mg/dL; T1DM: type 1 diabetes mellitus; T2DM: type 2 diabetes mellitus; VAS: visual analogue scale; Exp (b): measure equivalent to odds ratio or risk, quantifies the risk of not being controlled; 95% CI: 95% confidence intervals of Exp (b); p: statistical significance.
The mean VAS score of acceptance was 8.10 (1.46) points (95% CI, 7.94–8.25) in the total sample, 8.09 (1.64) points (95% CI, 7.80–8.37) in the T1DM subgroup, and 8.11 (1.34) points (95% CI, 7.93–8.29) in the T2DM subgroup, with no statistically significant differences between them (p=0.631).
DiscussionThe data from this study of patients with DM on insulin therapy show no relationship between metabolic control and SMBG in the preceding month or with the daily number of reagent strips used. Nor was a relationship seen when patients were divided into T1DM and T2DM subgroups. The risk factors associated with poor blood glucose control in all the patients assessed and in those with T2DM included hyperglycemia, falsely elevated HbA1c concentrations, and greater dissatisfaction with using the glucometer, while higher RMI was the risk factor associated with T2DM patients. Most patients were very satisfied with the glucometer for assessing blood glucose control.
The role of SMBG in patients with DM on insulin therapy is well established. However, the frequency of the measurements is highly variable depending on the type of DM, the insulin therapy regimen, and patient stability, as stated in the various European and US guidelines, which themselves differ.10–14 In this study, the frequency of measurements and the use of reagent strips were not associated with good or poor metabolic control in patients with T1DM or with T2DM. Different studies conducted in patients with T1DM have shown that a greater frequency of SMBG is associated with greater decreases in HbA1c values.8,15–17 In patients with T2DM, for whom SMBG is well established both in this country18 and elsewhere, the results differ to a greater or lesser extent. Thus, Harris,19 in an observational study including patients with DM treated with insulin or oral antidiabetics, did not find that an increased frequency of SMBG improved metabolic control. By contrast, Karter et al.16 noted that the greater the number of SMBGs, the better the control of blood glucose, regardless of the type of DM. However, in these and other studies examining this aspect there are significant methodological differences which make comparison difficult. One explanation for the differences seen between patients with T1DM and T2DM is that the former usually perform more measurements, as was also noted in the current study. One aspect of the design of this study that should be taken into consideration is the cut-off point established in HbA1c concentration, separating controlled and uncontrolled patients. It should be noted that no association was found between the frequency of measurements and good metabolic control in either T1DM or in T2DM patients. Two aspects derived from these results should be emphasized. On the one hand, there are the cost implications to be faced by healthcare providers with this procedure, because SMBG accounts for 40% of total pharmacy costs in insulin-treated DM patients.20 On the other hand, in standard clinical practice in Spanish endocrinological outpatient clinics, SMBG does not appear to provide a benefit when the measurements increase, or the benefit is independent of the total number of measurements. It is possible that we are not using SMBG in our environment with the desired efficiency, partly because of the lack of means for a better implementation of SMBG use. In this regard, structured SMBG appears to be superior to the SMBG carried out in standard clinical practice,21,22 which may explain the results reported here. However, the retrospective and non-interventional nature of this study precludes evaluation of this aspect. The importance of structured SMBG implies active intervention by patients and their commitment to managing their disease, for which adequate educational and organizational resources are needed. Such commitment may be seen with more recent procedures requiring active patient participation, such as continuous glucose monitoring in T1DM patients with subcutaneous insulin infusion, which improves metabolic control.23 An interesting finding in this study is that one of the risk factors associated with a lack of metabolic control in both the total sample and in patients with T2DM was the degree of patient satisfaction with the glucometer, so that the greater the satisfaction, the better the metabolic control. It may be that the general use of glucometers without a prior structured discussion with patients, and without knowing their needs and limitations, is less effective than it is generally considered to be. Data from this study should therefore be examined with caution, and recommendations regarding guidelines on this matter should be taken into account. The American Diabetes Association states that patients on insulin therapy should use SMBG after receiving adequate instructions on the use of the technique and that such use should be monitored.24 These aspects have not been assessed in this study. On the other hand, the recently issued position statement on the efficiency of technologies for the management of diabetes of the Spanish Society of Endrocrinology and Nutrition25 states that the optimum frequency of self-testing in patients on insulin therapy is not well established in terms of cost-effectiveness, although a close relationship exists between the frequency of capillary measurements and metabolic control in patients with T1DM. At present, an individualized SMBG scheme ranging from four self-monitoring tests daily in basal-bolus insulin regimens to other schemes better adapted to patient conditions is generally recommended to all diabetic patients on insulin therapy.
This study had some design limitations which should be taken into account when interpreting the results. Retrospective clinical variables were collected, and there was no control group. On the other hand, as this was a non-interventional study, no distinction was made between patients who were using SMBG for self-testing only and those who, because they were also using it for self-regulation, were possibly more committed to the technique and so obtained more benefits from it. The planned sample size was not reached, and the evaluable sample was smaller than that of other studies which have assessed this aspect.16,19 Finally, an additional limitation that should be borne in mind is that information concerning the efficiency of self-testing, such as the level of diabetes education or changes in treatment induced by self-testing, was not collected. However, the fact that the study was conducted in the setting of standard clinical practice is a positive aspect in this regard.
In conclusion, patients with DM on insulin therapy showed a high degree of acceptance of the use of the glucometer to self-test blood glucose control. However, no relationship was seen between metabolic control and the frequency of use of the glucometer or the daily number of strips used by patients with either T1DM or T2DM. The risk factors associated with poor metabolic control in patients with T2DM were, as expected, hyperglycemia and falsely elevated HbA1c concentrations, but there was also some dissatisfaction with the use of the glucometer, while the risk factor associated with patients with T2DM was a higher BMI.
FundingThe study was funded by Sanofi Aventis Spain.
Conflicts of interestDr. Soto has received fees for communications and/or clinical trials from GlaxoSmithKline, Novo-Nordisk, Sanofi-Aventis, Janssen-Cilag, Pfizer, AstraZeneca, Merck, Almirall, and Novartis.
To all physicians participating in the study, without whose cooperation this study could not have been conducted. This manuscript was prepared with the help of Dr. José Mora Maciá, Medical Writer funded by Sanofi-Aventis Spain.
Please cite this article as: Soto González A, Quintela Fernández N, Pumar López A, Darias Garzón R, Rivas Fernández M, Barberá Comes G. Relación entre el control metabólico y la automonitorización de la glucemia capilar en pacientes con diabetes mellitus tratados con insulina. Endocrinol Nutr. 2015;62:233–239.
