


To evaluate the effects of GH replacement therapy (GHR) for 3 years on glycated haemoglobin (HbA1c) and on the presence of dysglycaemia at any time during follow-up in Spanish adult patients with growth hormone deficiency (GHD).
Study designA retrospective study of 41 patients with GHD was conducted using baseline and long-term data. Changes in HbA1c values during the first 3 years of GHR were studied in both the overall population and patients with or without dysglycaemia during follow-up. Dysglycaemia was defined as FPG≥100mg/dl and/or HbA1c≥5.7%.
ResultsMean HbA1c value (5.4±0.4% at baseline) increased during the first and second years of GHR (HbA1c 5.5±0.4%, p=0.05, and 5.5±0.4%, p=0.006 respectively). This increase was not maintained during the third year (HbA1c 5.4±0.3%, p=0.107) of GHR. Twenty-eight patients (68.2%) had dysglycaemia during follow-up, 9 of them since baseline. In the 19 patients without baseline dysglycaemia, HbA1c increased during the first year and remained stable in the next 2 years (mean HbA1c 5.2±0.4% at baseline; 5.5±0.4% at 1 year, p<0.050; 5.4±0.4% at 2 years, p=0.004, and 5.4±0.4% at 3 years, p=0.016). In the 9 patients with baseline dysglycaemia, HbA1c did not significantly change during the 3 years of GHR therapy.
ConclusionsHbA1c values increased during the first 2 years of GHR therapy. In patients with no dysglycaemia before treatment, HbA1c steadily increased over the 3 years. However, it did not change in patients with baseline dysglycaemia.
Evaluar, en una cohorte de pacientes españoles con déficit de GH (GHD), el efecto de 3 años de tratamiento sustitutivo con hormona de crecimiento (GHR) sobre la hemoglobina glicada (HbA1c) y la presencia de disglucemia en cualquier momento del seguimiento.
DiseñoEstudio retrospectivo de 41 pacientes con GHD en GHR. Se analizaron los cambios durante los tres primeros años de GHR, en los valores de la HbA1c tanto en la población general como en los subgrupos de pacientes con y sin disglucemia durante el seguimiento. Se definió disglucemia como una glucemia basal≥100mg/dl y/o HbA1c≥5,7%.
ResultadosLa HbA1c media (inicialmente 5,4±0,4%) aumentó durante el primer y segundo año de GHR (HbA1c 5,5±0,4%, p=0,05 y 5,5±0,4%, p=0,006, respectivamente); esta tendencia no se mantuvo durante el tercer año (HbA1c 5,4±0,3%, p=0,107). Veintiocho pacientes (68,2%) presentaron disglucemia durante el seguimiento, 9 de ellos desde el inicio del seguimiento. En los 19 pacientes sin disglucemia basal, la HbA1c se incrementó durante el primer año, permaneciendo estable durante los siguientes dos años (HbA1c media basal 5,2±0,4%, 1er año 5,5±0,4%, p<0,050; 2do año 5,4±0,4% p=0,004 y 3er año 5,4±0,4% p=0,016). En los 9 pacientes con disglucemia basal la HbA1c no cambió en forma significativa durante los 3 años de GHR.
ConclusionesLos valores de HbA1c aumentaron durante los dos primeros años de GHR. En los pacientes sin disglucemia pre-tratamiento la HbA1c presentó un incremento continuo durante los tres años. Sin embargo, no cambió en aquellos pacientes con disglucemia basal.
Growth hormone deficiency (GHD) in adults is associated with an adverse metabolic profile, with fat mass gain (especially visceral fat), insulin resistance and type 2 diabetes mellitus (DM2).1–3 However, GH replacement (GHR) is associated with impaired insulin sensitivity shortly after starting therapy, reflected by increased fasting plasma glucose (FPG) and insulin levels despite reductions in visceral adiposity.4,5 This impaired insulin sensitivity could be influenced by high doses of GH, especially by its major effects on lipolysis.6 Many of the early GHD studies in adults used weight-based dosing derived from paediatric practice; therefore, hyperglycaemic side effects were more common.
Available evidence suggests that concerns regarding glucose intolerance in patients receiving long-term GHR have not been substantiated.7 It has been demonstrated that low-dose GHR over 12 months’ period enhances insulin sensitivity, and that GH standard dose (0.48mg/day) has no effect on glucose metabolism.8 Other studies have suggested that the increase in FPG do not persist after 6 months of GHR therapy, possibly due to a reduction in abdominal visceral fat.4,9 In addition, several environmental and lifestyle-related factors could influence glucose abnormalities in patients with GHD.
Glycated haemoglobin (HbA1c) was included in the diagnosis and diabetes risk prediction in 2010.10 HbA1c range of 5.7–6.4% implies a substantially increased risk of DM. There are few data on the evolution of HbA1c in patients with GHD during GHR therapy,11–14 and no study has specifically addressed this issue in Spanish patients.
We assessed the development of glucose metabolism disorders and the changes in HbA1c during the first 3 years of GHR in a cohort of Spanish patients with GHR therapy, and examined whether these changes were in range of dysglycaemia.
Materials and methodsPatient populationData were collected from clinical records of 71 GHD adult Spanish patients who were followed at the Endocrine Department of La Paz University Hospital, in Madrid, Spain, from January 1999 to July 2013. GHD was confirmed through standard stimulation tests like insulin tolerance test or, if it was contraindicated, glucagon stimulation test, or by decreased IGF-I levels for age and sex if multiple pituitary deficiencies were observed. Inclusion criteria for the current study were a confirmed diagnosis of GHD, absence of prior GHR therapy and at least 2 years of follow-up during GHR therapy. Patients who did not complete 2 years of treatment, had an irregular follow-up or had diabetes mellitus (DM) at baseline were excluded.
Although the study was retrospective, all patients were followed on the basis of the same standardised protocol that has been applied in our department for several years. All patients, when appropriate, received hormone replacement therapy in the form of l-thyroxine, hydrocortisone, sex steroids and desmopressin. During the study, the adequacy of hormone replacement therapy was assessed periodically.
The study was performed in accordance with the Declaration of Helsinki.
Outcome and explanatory variablesClinical dataRecorded data included age at diagnosis of GHD, aetiology of GHD, type and number of additional pituitary hormone deficiencies, family history of diabetes as well as weight, BMI and body fat mass (BFM).
BMI was calculated as body weight (kg) divided by squared height (m2). Bio-impedance assessment was used to measure total body fat under standard conditions for all measurements. The Tanita BC-420MA high capacity body composition analyser was used in all patients throughout the study. All patients with BMI≥25kg/m2 received behavioural modification recommendations, dietary instruction and advice on regular physical activity.
Biochemical dataPatients were evaluated for total cholesterol, low-density lipoprotein cholesterol (LDL-C), high-density lipoprotein cholesterol (HDL-C) and triglycerides at baseline and at last visit.
Glucose metabolism was assessed by measuring FPG and HbA1c concentrations. These variables were evaluated annually. FPG was measured by the glucose oxidase method. HbA1c was measured by high-performance liquid chromatography in Diamat and Variant autoanalysers (BioRad®, Richmond, California, USA) with exchangeable results calibrated to the Diabetes Control and Complications Trial (DCCT) range of normality. Intra-assay and inter-assay coefficients of variation (CVs) determined using representative blood samples with 5.9 and 10.3% HbA1c were 0.97 and 0.48% respectively.
We defined dysglycaemia as an FPG≥100mg/dl and/or an HbA1c≥5.7%. Patients who developed dysglycaemia at any time of the follow up were divided into two groups: those with baseline dysglycaemia and those with normal glucose metabolism at baseline.
Statistical analysisDescriptive statistics are presented as mean±SD or range. Student's t-test was used to assess the difference between mean HbA1c values in patients with and without dysglycaemia or Mann–Whitney U test depending on the nature of the data. The χ2 test was employed to compare frequencies of categorical variables. Gender differences and differences between patients receiving or not receiving sex steroid replacement were calculated by ANOVA. Multiple linear regression was used to model the relationship between HbA1c and body composition variables. P values <0.05 were regarded as statistically significant. For statistical evaluation SPSS (v12.0 for Windows; Chicago, Illinois, USA) was used.
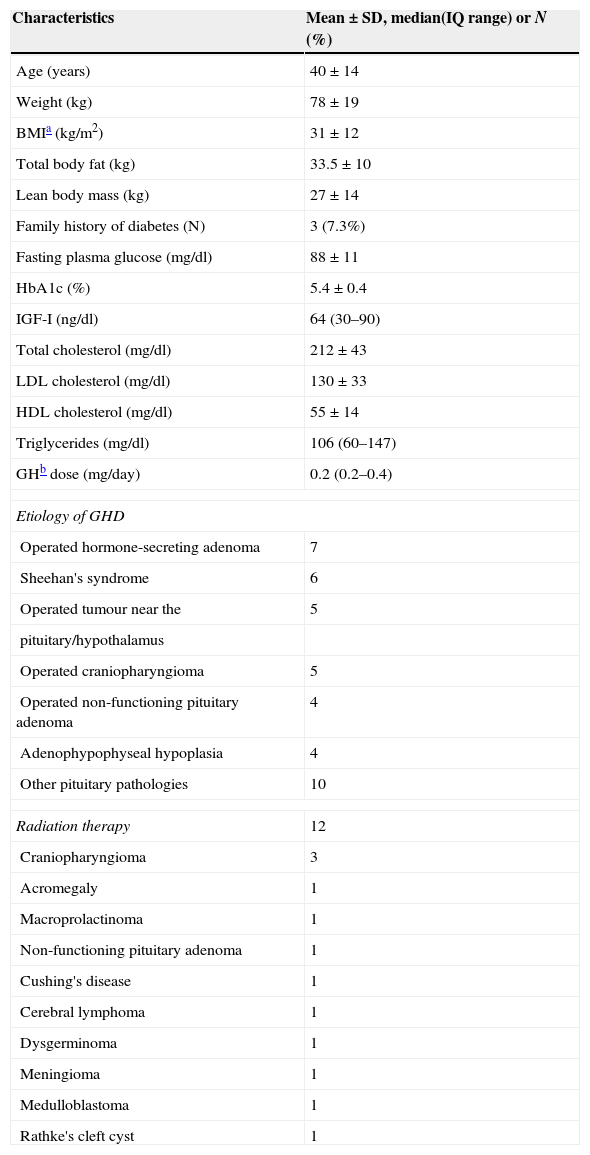
ResultsOf the 71 subjects with GHD, 41 (21 women and 20 men; mean age 40.1±14 years) met the eligibility criteria for this analysis. One man with DM1 and 29 patients whose follow-up was less than 2 years were excluded. Baseline characteristics of the study subjects are shown in Table 1. Mean observation period was 7.5 years (range 4.4–10.7). Only three patients had family history of DM.
Baseline characteristics of a cohort of Spanish adults with GHD.
| Characteristics | Mean±SD, median(IQ range) or N (%) |
|---|---|
| Age (years) | 40±14 |
| Weight (kg) | 78±19 |
| BMIa (kg/m2) | 31±12 |
| Total body fat (kg) | 33.5±10 |
| Lean body mass (kg) | 27±14 |
| Family history of diabetes (N) | 3 (7.3%) |
| Fasting plasma glucose (mg/dl) | 88±11 |
| HbA1c (%) | 5.4±0.4 |
| IGF-I (ng/dl) | 64 (30–90) |
| Total cholesterol (mg/dl) | 212±43 |
| LDL cholesterol (mg/dl) | 130±33 |
| HDL cholesterol (mg/dl) | 55±14 |
| Triglycerides (mg/dl) | 106 (60–147) |
| GHb dose (mg/day) | 0.2 (0.2–0.4) |
| Etiology of GHD | |
| Operated hormone-secreting adenoma | 7 |
| Sheehan's syndrome | 6 |
| Operated tumour near the | 5 |
| pituitary/hypothalamus | |
| Operated craniopharyngioma | 5 |
| Operated non-functioning pituitary adenoma | 4 |
| Adenophypophyseal hypoplasia | 4 |
| Other pituitary pathologies | 10 |
| Radiation therapy | 12 |
| Craniopharyngioma | 3 |
| Acromegaly | 1 |
| Macroprolactinoma | 1 |
| Non-functioning pituitary adenoma | 1 |
| Cushing's disease | 1 |
| Cerebral lymphoma | 1 |
| Dysgerminoma | 1 |
| Meningioma | 1 |
| Medulloblastoma | 1 |
| Rathke's cleft cyst | 1 |
The causes of hypopituitarism are shown in Table 1. The majority of hormone-secreting adenomas were prolactinomas (n=5). Twelve patients received radiation therapy.
The majority of patients required additional pituitary hormone replacement therapy at baseline. Adrenocorticotropic deficiency was detected in 75.6% of patients (all patients were treated with hydrocortisone), l-thyroxine was used by 73.2% of patients and sex hormones by 82.9%. Antidiuretic hormone deficiency was present in 17.1% of patients. Doses of glucocorticoids and sex steroids remained stable during the first 3 years of GHR therapy in all patients.
GH was initiated at a mean dose of 0.26±0.12mg/day, and titrated to a mean of 0.39±0.28mg/day to reach normal IGF-I levels for age and sex. There was no gender difference in terms of GH dose (p=0.543).
In the whole study population FPG increased from 88±11mg/dl to 92.3±13.3mg/dl during the first year (p=0.01). This increase was not maintained in the next 2 years. Compared to the baseline, HbA1c increased from 5.4±0.4% to 5.5±0.4% (p=0.05) and 5.5±0.5% (p=0.006), in the first and second year of GHR, returning to baseline during the third year (Fig. 1). Neither gender nor sex steroids therapy influenced the change of HbA1c during GHR (p=0.144 and p=0.48 respectively).
 in the total population of adults with GHR.")
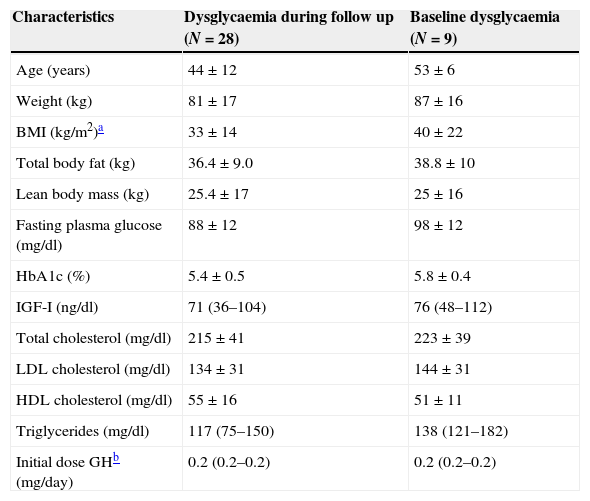
Twenty-eight patients had dysglycaemia during the follow up, 9 of whom had a baseline disturbed glucose metabolic state before starting GHR. Four of these 28 patients (9.7% of the total group) developed DM, and were all started on oral antidiabetic drug (metformin) during the period of the study. DM was diagnosed in the first year of GHR therapy in two patients, and after 5 years of GH treatment in others two. Three of them had dysglycaemia at baseline. Baseline characteristics of subjects with dysglycaemia are shown in Table 2.
Baseline characteristics of patients with dysglycaemia during the follow up and with baseline dysglycaemia.
| Characteristics | Dysglycaemia during follow up (N=28) | Baseline dysglycaemia (N=9) |
|---|---|---|
| Age (years) | 44±12 | 53±6 |
| Weight (kg) | 81±17 | 87±16 |
| BMI (kg/m2)a | 33±14 | 40±22 |
| Total body fat (kg) | 36.4±9.0 | 38.8±10 |
| Lean body mass (kg) | 25.4±17 | 25±16 |
| Fasting plasma glucose (mg/dl) | 88±12 | 98±12 |
| HbA1c (%) | 5.4±0.5 | 5.8±0.4 |
| IGF-I (ng/dl) | 71 (36–104) | 76 (48–112) |
| Total cholesterol (mg/dl) | 215±41 | 223±39 |
| LDL cholesterol (mg/dl) | 134±31 | 144±31 |
| HDL cholesterol (mg/dl) | 55±16 | 51±11 |
| Triglycerides (mg/dl) | 117 (75–150) | 138 (121–182) |
| Initial dose GHb (mg/day) | 0.2 (0.2–0.2) | 0.2 (0.2–0.2) |
When we analysed HbA1c behaviour of patients with baseline dysglycaemia (baseline mean HbA1c 5.8±0.4%), we did not find a significant change (1st year 5.7±0.7%, p=0.27; 2nd year 5.9±0.8% p=0.15 and 3rd year 5.6±0.4% p=0.8) (Fig. 2a). Nevertheless, FPG was increased in the first year from 98.1±13.3mg/dl to 103±19.4mg/dl (p=0.02). This subgroup of patients had a greater mean BMI than the rest of the population (BMI: 40±22kg/m2).
 over time in GH-treated adults that showed dysglycaemia during the period of the study: (a) patients with baseline dysglycaemia; (b) patient with normal glucose metabolism at baseline.")
Those patients who developed de novo dysglycaemia (19 patients) had baseline mean HbA1c values 5.2±0.4% and baseline mean FGP 84±9.0mg/dl). These patients showed a significant increase in both HbA1c (1st year 5.5±0.4%, p<0.050; 2nd year 5.4±0.4% p=.004 and 3rd year 5.4±0.4% p=0.016) (Fig. 2b) and FPG values (1st year 93±10.3mg/dl, p=.001; 2nd year 92.4±14mg/dl p=.014 and 3rd year 93±12.2mg/dl p=0.004) over 3 years. The mean increment of HbA1c and FPG was 0.23±0.2% and 8.6±11.5mg/dl, respectively.
Multivariate regression analyses showed that baseline BFM, BMI and body weight were not associated with the annual increase in HbA1c.
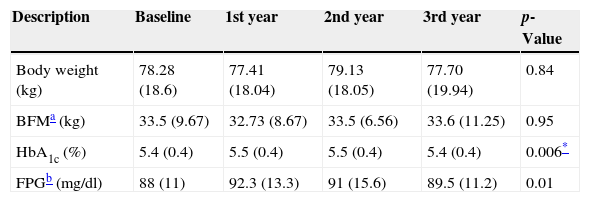
Body weight (median weight gain=0.4 [−3.6 to 6.8kg]) and body fat mass (BFM) did not change during the study period in any of the subgroups (Table 3). Compared to baseline, triglycerides levels increased after the third year (ΔTg+2.63mg/dl, p=0.008). There were no differences in total cholesterol, LDL-C, HDL-C and glucose behaviour between genders.
Effect of GH replacement on body composition, HbA1c and fasting plasma glucose.
| Description | Baseline | 1st year | 2nd year | 3rd year | p-Value |
|---|---|---|---|---|---|
| Body weight (kg) | 78.28 (18.6) | 77.41 (18.04) | 79.13 (18.05) | 77.70 (19.94) | 0.84 |
| BFMa (kg) | 33.5 (9.67) | 32.73 (8.67) | 33.5 (6.56) | 33.6 (11.25) | 0.95 |
| HbA1c (%) | 5.4 (0.4) | 5.5 (0.4) | 5.5 (0.4) | 5.4 (0.4) | 0.006* |
| FPGb (mg/dl) | 88 (11) | 92.3 (13.3) | 91 (15.6) | 89.5 (11.2) | 0.01 |
Data are presented as the mean (±SD).
Glucocorticoid replacement therapy was not associated with an increase in glucose levels during the follow-up.
DiscussionThis study in a Spanish GHD population found that patients with GHR therapy frequently develop an impaired glucose metabolism. A total of 28 of the 41 patients presented dysglycaemia at any time during follow-up, and four patients developed DM during GHR. This increment agrees with the values reported in previous studies,7,12,15 ranging from 0 to 10.2%; this variability could partly be due to ethnic characteristics, genetic predisposition and baseline dysglycaemia, as well as the remarkable obesity of the recruited patients.
Our study revealed a significant increase in FPG in patients treated with GHR therapy, mainly during the first year of treatment. By including HbA1c in the detection of glucose metabolism disorders, we aimed to identifying patients at high risk of DM in the most comprehensive way. We observed a mild increase in HbA1c levels that was not associated with a persistent increase in FPG in the total population. This could be attributed to potential postprandial plasma glucose excursions reflecting insulin resistance as a direct GH effect on carbohydrate metabolism.
Regarding patients with baseline prediabetes treated with GHR therapy, HbA1c levels were not modified over a period of 3 years. This observation suggests a low probability of metabolic improvement in patients with previous dysglycaemia and GHR therapy.
Two studies of GHR therapy in adults observed a decrease of HbA1c values over 5 and 10 years, respectively.13,14 This could be explained by the use of higher initial doses of GH (mean baseline dose 0.98mg/day), which were progressively decreased, and the BMI of those populations (27.6 and 27.8kg/m2). It is noteworthy that GH doses in our study were lower, and titrated to obtain serum IGF-I levels in the mid-range of normality according with age. A differential effect of high GH doses on glucose metabolism cannot be ruled out.
A study of 5143 GH-deficient patients on GHR reported an increase of 0.7mg/dl/year in plasma glucose concentration and of 0.036%/year in HbA1c value with a mean observation period of 3.9 years. Nonetheless, only 451 patients had annual data of HbA1c values. Patients with baseline glucose intolerance were not identified.11
Woodmansee et al. evaluated the performance of the HbA1c in 572 GH-deficient subjects with and without pre-existing DM receiving GHR during 2.33±1.34 years. In this post hoc analysis, GHR was not associated with an increase of HbA1c levels in subjects without pre-existing diabetes. However, less than half of the subjects had an HbA1c value recorded at any time during the study.12
In our patients, BFM remained similar to the baseline level during the 3 years of GHR, which could possibly be an effect of normal ageing of the patients or an unexpected evolution of body composition during follow-up. Several studies have demonstrated that GHR therapy normalises the alterations in body composition through a reduction in BFM and an increase in lean mass, within the first year of treatment.16,17 However, BFM gradually returns towards baseline values during prolonged GH replacement.14
The strength of this study was the systematic monitoring of patients, following a standardised protocol in all of the patients, and the availability of HbA1c data. Furthermore, this cohort was representative of the GHD population with GHR therapy because the aetiological spectrum of GHD included the most common diseases related to it.
This study had limitations. First, the evidence obtained is limited by the retrospective nature of the study. Second, we recognise that the follow-up time may be insufficient. However, we believe that a significant number of disturbed glucose metabolic states can be detected over a period of 3 years of follow.
In conclusion, a mild increase in HbA1c level was observed during a 3-year GHR therapy in overweight/obese Spanish adult patients with GHD. This increase most frequently occurred in patients without baseline dysglycaemia, regardless of BMI. Given that there is a high prevalence of impaired glucose metabolism in GHD adults receiving GHR, these patients should be closely followed regarding carbohydrate metabolism. Based on our results, we think that HbA1c measurements are justified in those with normal baseline FPG values.
Conflict of interestNone to declare.
FundingThis research did not receive any specific grant from any funding agency in the public, commercial or not-for-profit sector.
The authors thank IDIPAZ that contribute to statistical data analysis.
