


To compare the effect of different hypoglycemic drugs on laboratory and ultrasonographic markers of non-alcoholic fatty liver disease (NAFLD) in patients with type 2 diabetes not controlled on metformin alone.
MethodsProspective study of diabetic patients treated with metformin in combination with gliclazide, pioglitazone, sitagliptin, exenatide, or liraglutide. NAFLD was assessed by abdominal ultrasound and NAFLD fibrosis score was calculated at baseline and 6 months.
ResultsFifty-eight patients completed 6 months of follow-up: 15 received gliclazide, 13 pioglitazone, 15 sitagliptin, 7 exenatide, and 8 liraglutide. NAFLD affected 57.8% of patients at baseline, and its ultrasonographic course varied depending on changes in weight (P=.009) and waist circumference (P=.012). The proportions of patients who experienced ultrasonographic improvement in the different treatment groups were: 33.3% with gliclazide, 37.5% with pioglitazone, 45.5% with sitagliptin, 80% with exenatide, and 33% with liraglutide (P=.28).
ConclusionsQualitative ultrasonographic NAFLD improvement in diabetic patients treated with metformin in combination with other hypoglycemic drugs is associated to change over time in weight and waist circumference. Long-term clinical trials are needed to assess whether incretin therapies result in better liver outcomes than other hypoglycemic therapies.
Comparar el efecto de diferentes hipoglucemiantes en indicadores analíticos y ecográficos de la esteatosis hepática no alcohólica (EHNA) en pacientes con diabetes tipo 2 no controlados solo con metformina.
MétodosEstudio prospectivo de pacientes diabéticos tratados con metformina, en combinación con gliclazida, pioglitazona, sitagliptina, exenatida o liraglutida. En el momento basal y a los 6 meses la EHNA fue valorada por ecografía abdominal y se calculó el índice de fibrosis de la EHNA.
ResultadosCincuenta y ocho pacientes completaron los 6 meses de seguimiento: 15 recibieron gliclazida, 13 pioglitazona, 15 sitagliptina, 7 exenatida y 8 liraglutida. La EHNA afectó basalmente al 57,8% de los casos y su evolución ecográfica varió dependiendo de la evolución del peso (P=0,009) y de la cintura (P=0,012). Los porcentajes de sujetos que experimentaron una mejoría ecográfica en los diferentes grupos de tratamiento fueron: 33,3% con gliclazida, 37,5% con pioglitazona, 45,5% con sitagliptina, 80% con exenatida y 33% con liraglutida (P=0,28).
ConclusionesLa evolución ecográfica cualitativa de la EHNA en el paciente diabético tratado con metformina en combinación con otros hipoglucemiantes está vinculada a la evolución del peso y del perímetro de cintura. Son precisos ensayos clínicos de larga duración para evaluar si las terapias incretínicas se asocian a mejores resultados hepáticos que otras terapias hipoglucemiantes.
Non-alcoholic fatty liver disease (NAFLD) affects 69.4% of diabetic patients1 and is associated with increased mortality from both cardiovascular and hepatic causes.2 NAFLD is defined as the accumulation in the liver of fat representing more than 5–10% of liver weight3 and progresses in 12–20% of patients to steatohepatitis with mild to moderate fibrosis. In 13% of patients, fibrosis evolves to cirrhosis in 4–5 years.4 It is expected that in 2020, in parallel to the worldwide epidemic of obesity. NAFLD will become the leading cause of liver transplantation.5
The most widely used treatment for NAFLD consists of a low-calorie diet and physical exercise, with the aim of reducing weight by 5–10% in 6–12 months.6 Because of the difficulty of the long-term maintenance of these dietary measures, the efficacy of different drugs in NAFLD is being tested.3 To date, most studies have been conducted with metformin and pioglitazone. Metformin has not shown beneficial effects on liver histology,7 and the American Association for the Study of Liver Disease has advised against its use.6 As regards pioglitazone, the results of some trials could warrant its administration in NAFLD, but long-term safety problems have been reported.8 Data regarding the role of dipeptidyl peptidase-4 inhibitors and glucagon-like peptide-1 receptor agonists are still limited.9
Metformin has been shown to decrease overall mortality in diabetic patients,10 and multiple clinical guidelines consider it the drug of first choice in these patients. In clinical practice, 53.9% of diabetic patients on metformin alone are not controlled (HbA1c>7%).11 To select a second hypoglycemic agent added to metformin in these uncontrolled patients, treatment could be individualized based on age, diabetes duration, associated complications, or the risk of hypoglycemia.12 The hypothesis that the effect of second-line hypoglycemics in NAFLD could also be a criterion for the individualization of treatment in diabetic patients not controlled on metformin alone has yet to be proven.
The objective of this study was to compare the effect of different second-step hypoglycemic drugs on qualitative laboratory and ultrasonographic markers of NAFLD in patients with type 2 diabetes mellitus not controlled on metformin alone.
MethodsStudy designA longitudinal follow-up, non-randomized, parallel pilot study of five hypoglycemic drugs (gliclazide, pioglitazone, sitagliptin, exenatide, liraglutide) was conducted. Patient assignment to treatment arms was determined by the standard practice of the physicians who selected them, who had access to the prescribing information of these drugs and strictly adhered to them.
Inclusion criteriaThe inclusion criteria were patients of both sexes over 18 years of age who in 2013 attended any healthcare center in Lanzarote for type 2 diabetes mellitus, using metformin as the only hypoglycemic drug, and with HbA1c>levels >6.5%. All patients were given an information sheet regarding the study and gave their written informed consent. The study protocol was approved by the ethics committee of Hospital Dr. Negrín and was supported by Fundación Canaria of the physicians’ association of Las Palmas.
Follow-upThe patients were followed up by means of four visits: a screening visit, a baseline visit, an intermediate visit at 3 months, and a final visit at 6 months. At the screening visit, a complete clinical history was obtained, and height, waist circumference, and blood pressure were measured. The body mass index (BMI) was calculated as weight divided by squared height. In the 2-week interval between the screening and baseline visits, blood samples were taken for the baseline measurement of HbA1c, a complete blood count, creatinine, total cholesterol, low density lipoprotein, high density lipoprotein, triglycerides, total bilirubin, alanine aminotransferase (ALT), aspartate aminotransferase, the international normalized ratio, and albumin. Metabolic syndrome was assessed using the International Diabetes Federation criteria and assuming the cut-off points of waist circumference specific for our population (>94.5cm for males and >89.5cm for females).13
At the baseline visit, one of the following drugs was prescribed together with metformin (850mg/8–12h):
- -
Gliclazide 30mg before breakfast. If HbA1c continued to be >6.5% at 3 months, the dose was increased to 60mg/day.
- -
Pioglitazone 15mg with breakfast. If HbA1c continued to be >6.5% at 3 months, the dose was increased to 30mg/day.
- -
Sitagliptin 50mg with breakfast and dinner.
- -
Exenatide 5μg before lunch and dinner. The dose was increased to 10μg twice daily after the first month.
- -
Liraglutide 0.6mg before lunch. The dose was increased to 1.2mg/day after the first week.
At 3 and 6 months, all the parameters initially assessed were remeasured, and all potential adverse effects were evaluated.
Assessment of non-alcoholic fat liver diseaseAn experienced examiner (>1500 ultrasound examinations) blinded to the patient data performed abdominal ultrasonography in the 2-week interval between the screening and the baseline visits to all patients recruited with an alcohol consumption ≤20g/day. The same procedure was repeated at 6 months of follow-up under blinded conditions in all patients diagnosed with NAFLD. Other possible causes of NAFLD (chronic viral hepatitis, autoimmune hepatitis, hemochromatosis, Wilson's disease, alpha-1-antitrypsin deficiency, hypothyroidism, primary biliary cirrhosis, drug-induced liver disease) were excluded in all patients by serologic tests for hepatitis B and C viruses, antinuclear antibodies, anti-mitochondrial antibodies, anti-smooth muscle antibodies, hepatorenal antimicrosomal antibodies, serum ferritin levels, transferrin saturation, ceruloplasmin, alpha-1-antitrypsin, thyroid-stimulating hormone, and free thyroid hormone.14
Abdominal ultrasonography was performed on all participants using a 3.5MHz transducer (Aloka Co, Ltd., P-42109B). A sagittal view of the right liver lobe, a cross-sectional view of the left lateral liver segment, and a cross-sectional view of the liver were studied. Any focal area with an altered echo structure was evaluated. The patients were qualitatively categorized into four groups based on the severity of the echogenicity of liver parenchyma15:
- -
0: no steatosis, normal echogenicity.
- -
I: mild steatosis with slight, diffuse increase in fine echoes in liver parenchyma and normal visualization of the diaphragm and suprahepatic veins.
- -
II: moderate steatosis with diffuse increase of fine echoes and slightly altered visualization of the diaphragm and suprahepatic veins.
- -
III: severe steatosis with marked increase of fine echoes and poor or no visualization of the diaphragm, suprahepatic veins, and posterior right lobe of the liver.
The NAFLD fibrosis score (NFS) was calculated for all patients at baseline and at 6 months of follow-up. The NFS takes into account age, the BMI, a diagnosis of diabetes or impaired basal blood glucose, the aspartate aminotransferase/ALT ratio, the platelet count, and albumin. Patients were categorized into three groups based on the probability of advanced liver fibrosis16:
- -
High probability. If the NFS>0.675.
- -
Low probability. If the NFS<−1.455.
- -
Indeterminate risk. If the NFS ranges from −1.455 to 0.675.
The proportion of patients with liver steatosis who experienced a qualitative improvement in ultrasonographic image at 6 months and the final NFS scores were compared between the treatment groups (gliclazide, pioglitazone, sitagliptin, exenatide, liraglutide). Quantitative variables were expressed as mean and standard deviation, and categorical variables as percentages. For quantitative variables, an ANOVA or a Kruskal–Wallis test was used depending on whether or not they were normally distributed, while a Chi-squared test was used for categorical variables. The correlation between quantitative variables was calculated using Pearson or Spearman coefficients depending on whether they were normally distributed or not. Ultrasonographic changes in NAFLD were studied using ordinal regression. Statistical data analysis was performed using SPSS version 21.0 software (Chicago, IL, USA). A two-sided significance level of p<0.05 was established for all tests.
ResultsPatients recruited and drug safetyEighty patients were selected, of whom 66 met the inclusion criteria and 58 completed the 6 months of follow-up. Fifteen patients were treated with gliclazide, 13 with pioglitazone, 15 with sitagliptin, seven with exenatide, and eight with liraglutide (Fig. 1). Hypoglycemia occurred in 5.6% of patients with gliclazide, and 20% of patients given liraglutide experienced nausea. Of the eight patients lost to follow-up, seven did not return for their scheduled visits and one died. This death, due to a metastatic adenocarcinoma of the pancreas, occurred in a patient who had been treated with exenatide for 1 month.
Baseline characteristics
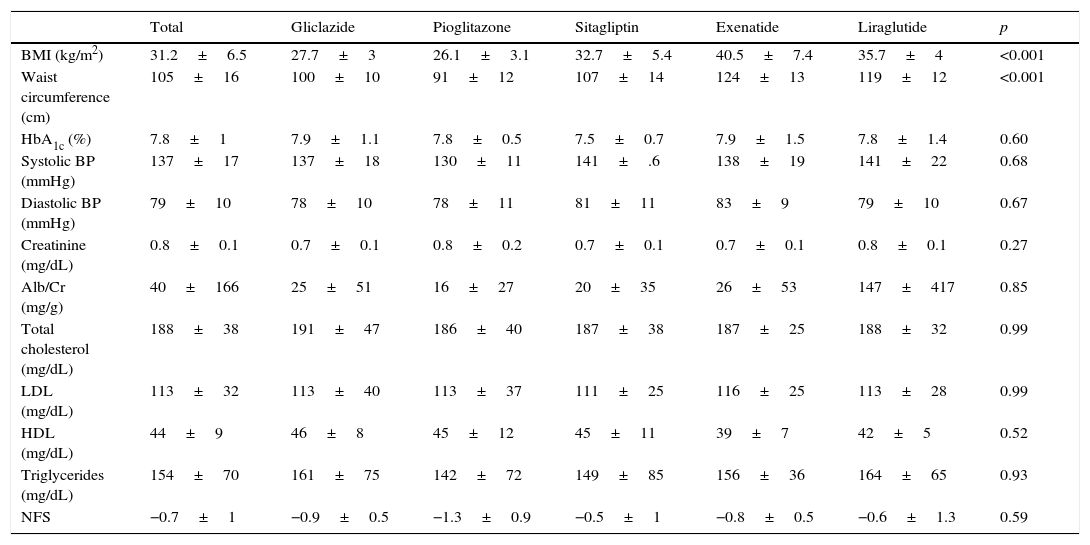
The baseline characteristics were as follows: mean age, 55.4±9.4 years; mean diabetes duration, 5.9±5.3 years; proportion of females, 39.4%; mean daily number of drugs by patient, 7±3.8; proportion with metabolic syndrome, 81.8%. Baseline differences were seen in the BMI and waist circumference (Table 1), but not in the proportion of patients with metabolic syndrome, depending on the treatment group assigned: 83.3% with gliclazide, 60% with pioglitazone, 80% with sitagliptin, 100% with exenatide, and 100% with liraglutide (p=0.06).
Baseline characteristics by hypoglycemic drug.
| Total | Gliclazide | Pioglitazone | Sitagliptin | Exenatide | Liraglutide | p | |
|---|---|---|---|---|---|---|---|
| BMI (kg/m2) | 31.2±6.5 | 27.7±3 | 26.1±3.1 | 32.7±5.4 | 40.5±7.4 | 35.7±4 | <0.001 |
| Waist circumference (cm) | 105±16 | 100±10 | 91±12 | 107±14 | 124±13 | 119±12 | <0.001 |
| HbA1c (%) | 7.8±1 | 7.9±1.1 | 7.8±0.5 | 7.5±0.7 | 7.9±1.5 | 7.8±1.4 | 0.60 |
| Systolic BP (mmHg) | 137±17 | 137±18 | 130±11 | 141±.6 | 138±19 | 141±22 | 0.68 |
| Diastolic BP (mmHg) | 79±10 | 78±10 | 78±11 | 81±11 | 83±9 | 79±10 | 0.67 |
| Creatinine (mg/dL) | 0.8±0.1 | 0.7±0.1 | 0.8±0.2 | 0.7±0.1 | 0.7±0.1 | 0.8±0.1 | 0.27 |
| Alb/Cr (mg/g) | 40±166 | 25±51 | 16±27 | 20±35 | 26±53 | 147±417 | 0.85 |
| Total cholesterol (mg/dL) | 188±38 | 191±47 | 186±40 | 187±38 | 187±25 | 188±32 | 0.99 |
| LDL (mg/dL) | 113±32 | 113±40 | 113±37 | 111±25 | 116±25 | 113±28 | 0.99 |
| HDL (mg/dL) | 44±9 | 46±8 | 45±12 | 45±11 | 39±7 | 42±5 | 0.52 |
| Triglycerides (mg/dL) | 154±70 | 161±75 | 142±72 | 149±85 | 156±36 | 164±65 | 0.93 |
| NFS | −0.7±1 | −0.9±0.5 | −1.3±0.9 | −0.5±1 | −0.8±0.5 | −0.6±1.3 | 0.59 |
Alb/Cr, albumin/creatinine ratio; HDL, high density lipoprotein; NFS, NAFLD fibrosis score; BMI, body mass index; LDL, low density lipoprotein.
Data are given as mean±SD.
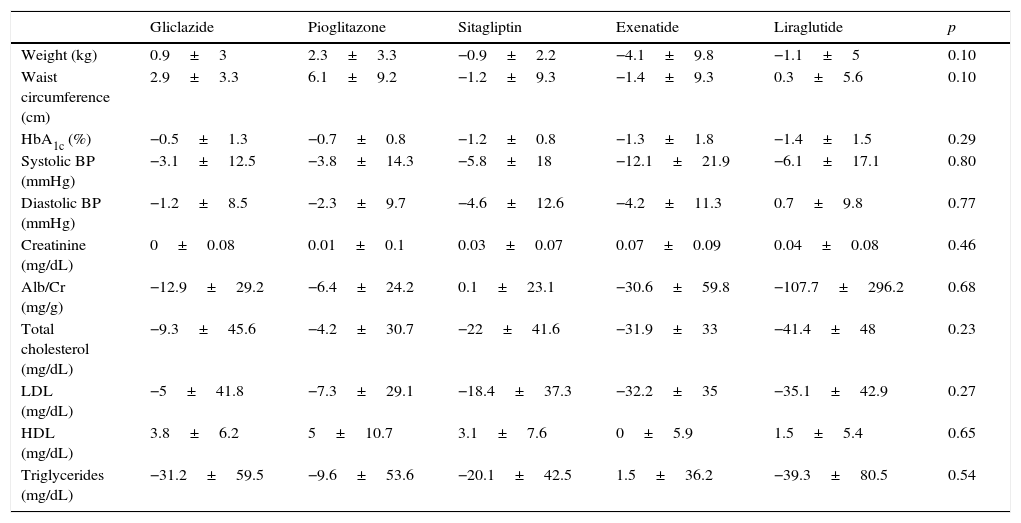
Table 2 shows for each treatment group changes over time in weight, waist circumference, HbA1c, blood pressure, creatinine, the albumin/creatinine ratio, total cholesterol, low density lipoprotein, high density lipoprotein, and triglycerides.
Change in metabolic parameters at 6 months by hypoglycemic drug.
| Gliclazide | Pioglitazone | Sitagliptin | Exenatide | Liraglutide | p | |
|---|---|---|---|---|---|---|
| Weight (kg) | 0.9±3 | 2.3±3.3 | −0.9±2.2 | −4.1±9.8 | −1.1±5 | 0.10 |
| Waist circumference (cm) | 2.9±3.3 | 6.1±9.2 | −1.2±9.3 | −1.4±9.3 | 0.3±5.6 | 0.10 |
| HbA1c (%) | −0.5±1.3 | −0.7±0.8 | −1.2±0.8 | −1.3±1.8 | −1.4±1.5 | 0.29 |
| Systolic BP (mmHg) | −3.1±12.5 | −3.8±14.3 | −5.8±18 | −12.1±21.9 | −6.1±17.1 | 0.80 |
| Diastolic BP (mmHg) | −1.2±8.5 | −2.3±9.7 | −4.6±12.6 | −4.2±11.3 | 0.7±9.8 | 0.77 |
| Creatinine (mg/dL) | 0±0.08 | 0.01±0.1 | 0.03±0.07 | 0.07±0.09 | 0.04±0.08 | 0.46 |
| Alb/Cr (mg/g) | −12.9±29.2 | −6.4±24.2 | 0.1±23.1 | −30.6±59.8 | −107.7±296.2 | 0.68 |
| Total cholesterol (mg/dL) | −9.3±45.6 | −4.2±30.7 | −22±41.6 | −31.9±33 | −41.4±48 | 0.23 |
| LDL (mg/dL) | −5±41.8 | −7.3±29.1 | −18.4±37.3 | −32.2±35 | −35.1±42.9 | 0.27 |
| HDL (mg/dL) | 3.8±6.2 | 5±10.7 | 3.1±7.6 | 0±5.9 | 1.5±5.4 | 0.65 |
| Triglycerides (mg/dL) | −31.2±59.5 | −9.6±53.6 | −20.1±42.5 | 1.5±36.2 | −39.3±80.5 | 0.54 |
Alb/Cr, albumin/creatinine ratio; HDL, high density lipoprotein; LDL, low density lipoprotein.
Data are given as mean±SD.
High transaminase levels (ALT>41IU/L) were found in 17.5% of patients and were seven times more common in those with NAFLD (27% and 3.8% in those with and without NAFLD respectively, p=0.02). No differences were seen between the treatment groups with regard to change in ALT at 6 months: the mean ALT decrease was 1.3±9.2IU/L with gliclazide, 6.6±21.9IU/L with pioglitazone, 5.4±21.2IUI/L with sitagliptin, 3.1±6.8IU/L with exenatide, and 10.2±12.9IU/L with liraglutide (p=0.804).
Qualitative ultrasonographic changes in non-alcoholic fat liver diseaseNAFLD was found at baseline in 57.8% of the study patients and was 2.6 times more frequent among patients with metabolic syndrome (65.4%) than in those without the syndrome (25%) (p=0.02). NAFLD was more frequent at baseline (p=0.001) in patients receiving incretin therapies (80% 85.7%, and 88.9% for those on sitagliptin, exenatide, and liraglutide respectively) as compared to patients treated with pioglitazone (46.7%) or gliclazide (22.2%). At 6 months, a qualitative ultrasonographic improvement in NAFLD was seen in 46.8% of all patients, and the proportions of patients who experienced such improvement were (Fig. 2) 33.3% with gliclazide, 37.5% with pioglitazone, 45.5% with sitagliptin, 80% with exenatide, and 33% with liraglutide (p=0.28).

Qualitative ultrasonographic changes in NAFLD varied depending on changes in weight: patients with qualitative ultrasonographic improvement lost on average 3.5±6.8kg, while those with no ultrasonographic changes gained on average 1.2±2.9kg. In patients with ultrasonographic worsening, weight increased on average 7.1±7kg (p=0.009). Qualitative ultrasonographic changes in NAFLD were also related to changes over time in waist circumference, which showed a mean decrease by 4.4±7.2cm in patients with ultrasonographic improvement, while patients with no change or a worsening in ultrasound examination showed mean increases in waist circumference by 2.6±7.3cm and 9±11.3cm respectively (p=0.012). When ultrasonographic changes in NAFLD were adjusted for weight changes and the hypoglycemic drug used, weight loss was found to be independently associated with ultrasonographic NAFLD improvement (p=0.001), and the administration of exenatide tended to be associated with better ultrasonographic results as compared to all other hypoglycemic drugs, although the difference was not statistically significant (p=0.066).
A trend to better final HbA1c values was seen in patients with a better ultrasonographic course of NAFLD: patients with ultrasonographic improvement had a final mean HbA1c of 6.1±0.7%, those with no ultrasonographic changes had a final mean HbA1c of 6.6±0.9%, and those with ultrasonographic worsening had a final mean HbA1c level of 7.6±0.9% (p=0.062).
Change in the NFSThe baseline NFS was consistent with a high probability of fibrosis in 10.3% of the patients, with a low probability of fibrosis in 20.7%, and with an indeterminate level of fibrosis in 69% of the patients. The mean NFS was worse in patients with metabolic syndrome (−0.698 vs −3.092 in those with no metabolic syndrome, p=0.019), and no significant difference was seen in the mean baseline NFS between the treatment groups (Table 1). At 6 months of follow-up, the mean NFS change in the overall patients was 0.072±0.463, with no differences due to the hypoglycemic drug received (−0.212±0.239 with gliclazide, 0.126±0.348 with pioglitazone, 0.227±0.412 with sitagliptin, −0.105±0.85 with exenatide, −0.106±0.372 with liraglutide, p=0.504).
Patients with qualitative ultrasonographic improvement at 6 months achieved a mean favorable change in the NFS (−0.002±0.648), while those with no improvement had a mean unfavorable change in the NFS (0.173±0.211). The difference, however, was not statistically significant (p=0.365). Patients treated with statins tended to have a better final mean NFS (−0.937±0.983) than those receiving no statins (−0.108±0.975, p=0.052). The final NFS significantly correlated to the final BMI (rho=0.508, p=0.005; Fig. 3), the final waist circumference (rho=0.43, p=0.02), the final international normalized ratio (rho=0.537, p=0.012), and the daily number of drugs per patient (rho=0.439, p=0.017).
Discussion and the final body mass index (BMI).")
The prevalence of NAFLD seen in our study was slightly lower than that reported by Leite et al. (69.4%), who studied 180 patients with type 2 diabetes, of whom 82.7% were treated with metformin.1 This study population is not directly comparable to our sample, in which all patients had received metformin as the only initial treatment. This high prevalence of NAFLD in diabetic patients could explain the fact that recent reviews have recommended the inclusion of laboratory, ultrasonograhic, or histological results related to NAFLD in studies on diabetic populations.17 Our pilot study used the NFS, a tool which has shown an area under the ROC curve of 0.85, with 90% sensitivity and 97% specificity in the identification of steatohepatitis associated with advanced fibrosis, and which therefore has a special prognostic relevance in the assessment of NAFLD.18
The finding that the qualitative ultrasonographic changes in NAFLD are closely related to change over time in weight and waist is consistent with the 0.57 correlation between visceral adipose tissue and fatty liver in patients with type 2 diabetes mellitus suggested by Kelley et al.19 A limitation of our study was its sample size, which may explain why we found neither final HbA1c values significantly better in the patient group with ultrasonographic improvement, nor a significantly better final NFS in the group of patients treated with statins. A potential advantage of the study may have been direct comparison of the effect on NAFLD of different hypoglycemic drugs of interest in a patient profile as common as diabetics on metformin monotherapy.
The clinical guidelines for the management of NAFLD proposed by the University of California, San Diego recommend that NAFLD in diabetics should be treated by lifestyle intervention and pioglitazone, with or without metformin.20 Although a meta-analysis including 862 patients, 38% of them diabetics, showed that thazolidinediones improve steatosis, hepatocellular ballooning, and inflammatory events, delaying the progression of fibrosis,21 pioglitazone has been related to multiple adverse effects including bladder cancer, osteoporosis, weight gain, lower limb edema, and congestive heart failure.22
Because of these adverse effects, other alternative drugs may be of interest. In our pilot study, exenatide combined with metformin achieved the highest percentages of qualitative ultrasonographic improvement in NAFLD, but the difference was not statistically significant, possibly because of the small sample size. Klonoff et al. noted that exenatide combined with metformin or sulfonylureas improved ALT after a follow-up of 217 patients for 3 years.23 Cuthbertson et al. reported a 42% decrease in intrahepatic fat, quantified by proton magnetic resonance spectroscopy after glucagon-like peptide-1 receptor agonists were used for 6 months in 25 diabetic patients (19 with exenatide and 6 with liraglutide, combined with metformin and sulfonylureas or dipeptidyl peptidase-4 inhibitors).24 Gupta et al. showed that the glucagon-like peptide-1 receptor is present in human hepatocyte and related its role in the reduction of hepatocyte triglycerides to the activation of key elements of insulin receptor substrate 2 in hepatocytes.25 It has been reported that exenatide has a greater capacity for gastric slowing than liraglutide,26 suppresses the postprandial increase in triglycerides,27 and therefore decreases the exposure of liver tissue to triglycerides. As regards drug safety, we think it is unlikely that the death from metastatic pancreatic adenocarcinoma recorded was related to exenatide started in the patient before this diagnosis was known, because the patient received the drug for 1 month only, type 2 diabetes mellitus itself increases by 51% the risk of death from pancreatic carcinoma,28 and according to the Li at al. study, incretin mimetics do not appear to accelerate the development of pancreatic adenocarcinoma.29
Further research on the diagnostic and therapeutic approach to NAFLD in diabetic patients is needed. As regards diagnosis, it should be noted that 69% of diabetic patients had an indeterminate risk of fibrosis. While liver biopsy is considered the reference test in the diagnostic evaluation of NAFLD, it is not free from potentially severe complications such as bleeding3 or inter- and intra-observer variability,30 hence the interest of noninvasive tests to determine the probability of advanced hepatic fibrosis such as FibroScan®. An area under the ROC curve of 0.94, with 0.94 sensitivity and 0.95 specificity, was found for FibroScan in a meta-analysis of 32 articles on patients with NAFLD,18 although its diagnostic yield was significantly lower in patients with obesity.14 As regards treatment, those studies of the effects of incretin therapies in NAFLD which have an experimental design and which, by contemplating randomization mechanisms in patient recruitment, assess such effects in groups of patients with similar relevant baseline characteristics like the BMI or waist circumference, could be of special interest. On the other hand, the finding that the risk of significant fibrosis correlates to the number of drugs taken by patients suggests the need to further investigate the potential steatogenic effect of interactions between different drugs, and to review the medication taken by each patient to avoid as far as possible those drugs with known steatogenic effects.20
ConclusionQualitative ultrasonographic change over time in NAFLD in diabetic patients treated with metformin combined with other hypoglycemic drugs is related to changes in weight and waist circumference. Long-term clinical trials are needed to assess whether incretin therapies are associated with better hepatic results than other hypoglycemic therapies.
FundingThis study was sponsored by its investigators independently of the pharmaceutical industry and was funded by Fundación Canaria of the Las Palmas physicians’ association (Spain). This funding source did not participate in the study design, data collection, analysis or interpretation, manuscript writing, or the decision to submit the manuscript for publication.
AuthorshipEGD contributed to the study design, selected and followed up patients, analyzed the data, and wrote the manuscript. DG contributed to the study design, performed liver ultrasound examinations, and reviewed the manuscript. VG, CM, CrM, YL, DP, TG, and GT selected and followed up patients and reviewed the manuscript.
Conflict of interestThe authors have no conflicts of interest in relation to the study contents.
Affiliation at the time of the realization of this article: Unidad de Gastroenterología, Hospital Dr. José Molina Orosa, Lanzarote, Canarias, Spain.
Please cite this article as: García Díaz E, Guagnozzi D, Gutiérrez V, Mendoza C, Maza C, Larrañaga Y, et al. Efecto de las terapias incretínicas comparadas con pioglitazona y gliclazida en la esteatosis hepática no alcohólica de los pacientes diabéticos no controlados solo con metformina: estudio observacional piloto. Endocrinol Nutr. 2016;63:194–201.
