


The ATXN2 gene has a VNTR (CAG)n with locus in exon1. Long alleles within the normal range (22–29 repeats) are associated with severe obesity in people from the United Kingdom, Indonesia and the Caribbean.
ObjectiveTo analyse the influence of VNTR (CAG)n on metabolic profile in adults with obesity and pre-obesity, as well as to estimate its effect on the risk of developing diabetes.
Methods and material255 adults of Chinantec Amerindian ethnic origin were included, who underwent anthropometric and biochemical evaluation. The VNTR was amplified by end-point PCR and by 8% PAGE electrophoresis.
ResultsDifferences were found in the waist/hip circumference index and body mass index in the carriers of genotypes different to the one homozygous for 22 repeats with a Student's t-test value of 0.0041 and 0.0334, respectively. We also found an association with a family history of chronic disease.
ConclusionThe VNTR of ATXN2 is associated with obesity in Mexican adults of Chinantec ancestry.
El gen ATXN2 presenta un VNTR (CAG)n con locus en el exón1, los alelos largos dentro del rango normal (22–29 repeticiones) se asocian con obesidad severa en sujetos del Reino Unido, Indonesia y el Caribe.
ObjetivoAnalizar la influencia del VNTR (CAG)n del gen ATXN2 en el perfil metabólico en adultos con obesidad y pre-obesidad así como analizar su asociación con parámetros metabólicos y ambientales de riesgo cardiovascular.
Métodos y materialesSe incluyeron 255 adultos de origen étnico amerindio chinanteca a quienes se les realizó evaluación antropométrica y bioquímica. El VNTR fue amplificado por PCR punto final y electroforesis PAGE al 8%.
ResultadosSe encontraron diferencias en la circunferencia índice cintura/cadera e índice de masa corporal en los portadores de genotipos diferentes al homocigoto de 22 repeticiones con un valor para la prueba T de Student de 0.0041 y 0.0334 respectivamente. También encontramos asociación con la historia familiar de enfermedad crónica.
ConclusiónEl VNTR de ATXN2 se asocia al grado de obesidad en adultos mexicanos con ancestria Chinanteca.
As has been previously reported, obesity is directly related to increased triglycerides, glucose and blood pressure, as well as decreased HDL cholesterol, traits that are part of the metabolic syndrome.1 Obesity is an emerging disease in Latin America and a public health problem in Mexico. Some 80% of the Mexican population is obese or overweight, but the alteration begins in childhood or adolescence with the presence of hyperinsulinaemia or glucose intolerance, and in adulthood it evolves into metabolic syndrome or type 2 diabetes mellitus (T2DM).2 In a cohort study in the Mexican population, it is shown that 25% of obese children and 21% of obese adults have glycaemia values greater than 140 mg/dl, after two postprandial hours, and 4% have undiagnosed type 2 diabetes.3,4 Obesity from childhood, which evolves until adulthood, is already a public health problem in America, in some cases causing fatty liver and cirrhosis, for which there is a need to further explore the causal mechanisms to establish early risk markers.
The obesity pandemic in postcolonial Latin American societies can be explained by two hypotheses or mechanisms. The first is that of the thrifty genotype (many genes), which allowed the ancestors of Latin Americans during the last glacial period to survive periods of prolonged famine, through the development of insulin resistance―a biochemical phenotype that allowed energy to be stored when there was no food, but also formed a more apt muscle phenotype, faster to avoid being preyed upon by the large animals of the period.5 However, for the current Latino peoples who are heirs of this genotype, when coupled with poor eating habits, such as the consumption of high energy foods with high caloric content, higher intake of saturated fats with an abundance of refined carbohydrates, lack of fibre, as well as the increase in sedentary activities and the reduction of exercise, this results in patients being more susceptible to obesity and/or diabetes.6
The second hypothesis that explains the development of obesity is multiple organ resistance. This theory explains that in multiple tissues (brain, liver, pancreas, skeletal muscle, adipose tissue, endothelium) there is simultaneous dysfunction in receptors for different hormones, including insulin, leptin, and adiponectin. The clinical phenotype of these alterations includes severe hyperphagia and obesity in different degrees.7,8 In both theories, the element in common is insulin resistance, which over time evolves into obesity and T2DM.
Considering that multiple organ resistance and the thrifty genotype are mechanisms of obesity associated with T2DM, we propose a new candidate gene in obesity, the ATXN2 gene.9,10 This gene was also chosen because in murine models it has been shown that its deficiency leads to central obesity, severe obesity, hyperinsulinaemia, fatty liver, dyslipidaemia and decreased expression of the insulin receptor in the cerebellum and liver.9,10 And also because it regulates the adapter protein GRB2, an amplifier of insulin receptor signalling.11 In humans, the ATXN2 gene presents a polymorphism of the VNTR (variable number of tandem repeats) (CAG)n type with a locus in exon 1. Alleles with more than 33 repeats produce autosomal dominant spinocerebellar ataxia type 2 (SCA2), which is a susceptibility factor for T2DM due to the association with insulin resistance of muscular origin, related to peripheral neuropathy.12 The VNTR of ATXN2 has more than two alleles with a frequency greater than 1% and has a homogeneous distribution in populations, with the allele with 22 repeats being the most common (more than 90 %), the other 10 % corresponding to alleles with 23, 25, 29, 20, 21 and 18 repeats, due to which it can be considered a polymorphism.13,14 In some populations, alleles within the normal range (<31 repeats) have been associated with neurodegenerative diseases, and with the development of T2DM in the Mexican population with a low dietary intake, but they are also associated with obesity in the population of the United Kingdom, Indonesia and the Caribbean.13,14 Meanwhile, repeats numbering 33 or more are directly responsible for the development of SCA2.12 The pathogenic effect of repeats is a research frontier in the development of chronic diseases such as obesity. However, in patients with SCA2, repeats numbering more than 25 have a dominant effect known as gain-of-function, which favours abnormal aggregates of protein, which due to cellular toxicity can affect neuronal, pancreatic or adipose tissue metabolism, while alleles with less than 22 repeats have a dominant negative additive subclinical effect, wherein the protein has a minor function. However, this field of study has yet to be explored.9–14
The Amerindian population of Oaxaca state is a post-colonial society, which although being vulnerable, highly marginalised and very poor, is exposed to a greater frequency of consumption of high energy and caloric foods, which coupled with the thrifty genotype, increases the development of obesity among its peoples, as in the case of the Chinantec ethnic group settled in Tuxtepec, Oaxaca.13,14 Therefore, the objectives of the study were to analyse the influence of the VNTR (CAG)n of the ATXN2 gene on the metabolic profile in obese and pre-obese adults, as well as to analyse its association with metabolic and environmental parameters of cardiovascular risk in the Amerindian population of Oaxaca.
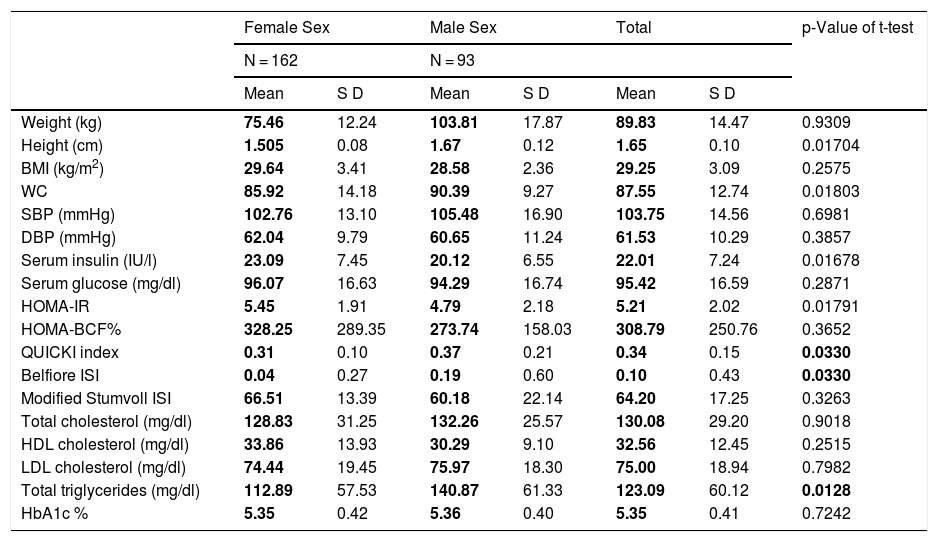
MethodsAdults originally from and residents of the city of Tuxtepec, of Chinantec ethnic origin, were included, of which 162 subjects were female and 93 male, with an age range of 25–35 years, who were stratified according to the WHO-2004 criteria, into 158 probands with grade II overweight or pre-obesity (BMI 27.0–29.9), 79 with grade I obesity (BMI 30.0–34.9) and 18 with grade II obesity (35.0–39.9).15 No subjects were found with type III (morbid) obesity (BMI 40.0–49.9) or with type IV (extreme) obesity (BMI ≥ 50). A metabolic profile was performed on all of them, which consisted of a clinical, biochemical and anthropometric evaluation that included weight, height, waist circumference (WC), body mass index (BMI), and diastolic and systolic blood pressure. A 5 ml peripheral blood sample was taken from all of them by venipuncture in BD Vacutainer tubes to extract genomic DNA and perform biochemical tests. Relatives of the included probands were asked to answer a questionnaire about family history of obesity, chronic disease (dyslipidaemia, hypertension, diabetes, coronary heart disease), type of physical activity, eating habits and bullying. Table 1 shows the main clinical and biochemical characteristics of the population analysed according to gender.
Clinical and biochemical profile of the population analysed by gender.
| Female Sex | Male Sex | Total | p-Value of t-test | ||||
|---|---|---|---|---|---|---|---|
| N = 162 | N = 93 | ||||||
| Mean | S D | Mean | S D | Mean | S D | ||
| Weight (kg) | 75.46 | 12.24 | 103.81 | 17.87 | 89.83 | 14.47 | 0.9309 |
| Height (cm) | 1.505 | 0.08 | 1.67 | 0.12 | 1.65 | 0.10 | 0.01704 |
| BMI (kg/m2) | 29.64 | 3.41 | 28.58 | 2.36 | 29.25 | 3.09 | 0.2575 |
| WC | 85.92 | 14.18 | 90.39 | 9.27 | 87.55 | 12.74 | 0.01803 |
| SBP (mmHg) | 102.76 | 13.10 | 105.48 | 16.90 | 103.75 | 14.56 | 0.6981 |
| DBP (mmHg) | 62.04 | 9.79 | 60.65 | 11.24 | 61.53 | 10.29 | 0.3857 |
| Serum insulin (IU/l) | 23.09 | 7.45 | 20.12 | 6.55 | 22.01 | 7.24 | 0.01678 |
| Serum glucose (mg/dl) | 96.07 | 16.63 | 94.29 | 16.74 | 95.42 | 16.59 | 0.2871 |
| HOMA-IR | 5.45 | 1.91 | 4.79 | 2.18 | 5.21 | 2.02 | 0.01791 |
| HOMA-BCF% | 328.25 | 289.35 | 273.74 | 158.03 | 308.79 | 250.76 | 0.3652 |
| QUICKI index | 0.31 | 0.10 | 0.37 | 0.21 | 0.34 | 0.15 | 0.0330 |
| Belfiore ISI | 0.04 | 0.27 | 0.19 | 0.60 | 0.10 | 0.43 | 0.0330 |
| Modified Stumvoll ISI | 66.51 | 13.39 | 60.18 | 22.14 | 64.20 | 17.25 | 0.3263 |
| Total cholesterol (mg/dl) | 128.83 | 31.25 | 132.26 | 25.57 | 130.08 | 29.20 | 0.9018 |
| HDL cholesterol (mg/dl) | 33.86 | 13.93 | 30.29 | 9.10 | 32.56 | 12.45 | 0.2515 |
| LDL cholesterol (mg/dl) | 74.44 | 19.45 | 75.97 | 18.30 | 75.00 | 18.94 | 0.7982 |
| Total triglycerides (mg/dl) | 112.89 | 57.53 | 140.87 | 61.33 | 123.09 | 60.12 | 0.0128 |
| HbA1c % | 5.35 | 0.42 | 5.36 | 0.40 | 5.35 | 0.41 | 0.7242 |
BCF: beta cell mass; BMI: body mass index; DBP: diastolic blood pressure; HbA1c: glycosylated haemoglobin; HDL cholesterol: high-density lipoprotein cholesterol; HOMA: homeostatic model assessment; IR: insulin resistance; ISI: insulin sensitivity index; LDL cholesterol: low-density lipoprotein cholesterol; QUICKI: quantitative insulin sensitivity check index; SD: standard deviation; SBP: systolic blood pressure; WC: waist circumference.
Blood samples were taken after fasting for 8 h. The levels of glucose, cholesterol, triglycerides, LDL and HDL were determined using enzymatic-colorimetric kits from Human Co. by spectrophotometry with the Beckam Coulter DU730 machine (CA, USA). Serum insulin was determined by radioimmunoassay with the 80-INSHU-E01.1 Kit from Alpco (Salem, NH, USA), using the Chromate Microplate Reader from Awareness-Technology, Inc. (Palm City, FL, USA).
Indices of insulin resistance and sensitivity were determined using the following formulas: HOMA-IR = (fasting insulin (uU/mL) × fasting glucose [mmol/l])/22.5; QUICKI index = 1/(log plasma insulin [uU/mL] + log fasting plasma glucose [mg/dl]); HOMA% BCF = 360 × serum insulin/fasting serum glucose-63); ISIStumvoll = 0.222 − 0.00333 × (body mass index − 0.0000779) × (insulin120) − (0.000422 × age). From the values of the glucose tolerance test, the averages of insulin and serum glucose were taken to obtain the ISIBelfiore = 2/(GS/GN) × (IS/IN) + 1.16
Glycosylated haemoglobin was determined by immunochromatography from capillary blood using the SD Aiclare Biosensor Inc. portable device.
Genomic amplification by endpoint (conventional) PCR of the region where the CAG expansion of the ATXN2 gene has its locus and electrophoresisThe primers used were the ones designed by Magaña et al. in 2008 for the detection of alleles within the normal range: cag-F (5′-GGGCCCCTCACCATGTCG-3′), called ATXN2-1, and cag-R (5′-CGGGCTTGCGGACATTGG-3′), called ATXN2-2, which were synthesised by the Sigma Aldrich company. The ATXN2 amplification program was the one reported by Magaña et al. in 2008, with five cycles: 1. 96 °C for 3 min (initial denaturation); 2. 96 °C for 60 s (denaturation); 3. 59 °C for 30 s (hybridisation); 4. 72 °C for 1 min (polymerisation); 5. Repeat cycles 2–4 28 times. The PCR product was mixed with deionised formamide and denatured in a water bath for 7 min, then removed and immediately placed on crushed ice for 5 min for further electrophoretic running. The amplification conditions were: 25 ∝l final volume containing 4 ∝M of each oligonucleotide and 200 ∝M of each dNTP; 0.6 μl of 10X reaction buffer (Thermo Fisher Scientific, USA); 2 mM of MgCl2 (Thermo Fisher Scientific, USA); 0.5 U of Taq DNA polymerase enzyme (Thermo Fisher Scientific, USA); 31% betaine (Sigma-Aldrich Chemie GmbH, Steinheim, Germany); and 100 ng of DNA from each proband.18 The amplified products were subjected to electrophoresis in polyacrylamide gels at 8% (19:1) 180 V for 2 h. Subsequently, the gels were stained with silver nitrate. Identification of the repeats was carried out based on the classification of the PCR products, 103 bp corresponding to the least frequent allele, which has 13 repeats, 130 bp corresponding to the most frequent allele, which has 22 repeats, and 151 to the allele with 29 repeats.13
Statistical analysisTo estimate the differences between the quantitative clinical and biochemical anthropometric parameters, Student's t-test (independent samples) was used, as well as an ANOVA test. Values of p < 0.05 were considered significant. To analyse the relationship with variables such as eating habits, physical activity, psychological aspects and the association with obesity, as well as gene-environment interaction, Pearson's chi-squared (X2) test was used, considering that these variables are characteristics or types that do not have a normal distribution, for which values of p < 0.05 were considered significant. A saturated log linear regression model was adjusted for two-way contingency tables, log (μij) = log(n) + log (πi+) + log (π+j) = λ + λ X i + λ Y. This model analyses the relationship between all the categorical variables, where all the variables that are analysed are considered as response variables, and there is no distinction between independent and dependent variables, that is, the genotypes and the different degrees of obesity, in order to identify the type of obesity association that occurs between the types of obesity and genotypes. The free program EpiInfoOpen was used to calculate the X2, odds ratio and confidence interval values. The saturated logarithmic model and the Student's t and ANOVA tests were performed using the Stata 16.1 program. For this model, r <0 denotes negative correlation, and r >0 denotes positive correlation. If r = 0, the variables are uncorrelated and therefore there is no covariation.
Ethical considerationsThis research was based on the Declaration of Helsinki revised in Fortaleza (Brazil, 2013), as well as on the General Health Law of Mexico. The study is part of the project "Clinical-molecular characterisation of the expansion of (CAG)n repeats in the ATXN1, ATXN2 and ATXN3 genes in families with spinocerebellar ataxia, as well as their association with metabolic syndrome findings in a population considered healthy in the south of Mexico", and was approved by the Institutional Research, Ethics and Biosafety Committees of the Universidad de la Sierra Sur, with registration number IISSP/BAMM/04.
Informed consent was obtained from the subjects included, who authorised a blood sample to be taken for biochemical and molecular evaluation. They also authorised the publication of the clinical, biochemical and molecular results for academic and/or scientific purposes, with all personal and legal data kept anonymous.
ResultsMetabolic profile by gender and degree of obesityWhen stratifying the anthropometric and biochemical profile by gender, we found that men presented higher values compared to women in height (1.67 cm versus 1.505 cm), waist circumference (90.39 cm versus 85.92 cm), triglyceride levels (1.505 mg/dl versus 112.89 mg/dl) and greater insulin sensitivity, according to the QUICKI index (0.37 versus 0.31) and the Belfiore ISI index (0.19 versus 0.04) (Table 1). The female cases included present higher values of serum insulin (23.09 IU/l versus 20.12 IU/l), as well as insulin resistance (HOMA-IR of 5.45 versus 4.79). In relation to the degree of obesity and the number of female/male individuals, the following distribution was apparent: pre-obesity 102/56, grade I obesity 67/12 and grade II obesity 10/7, which is not statistically significant (p = 0.184).
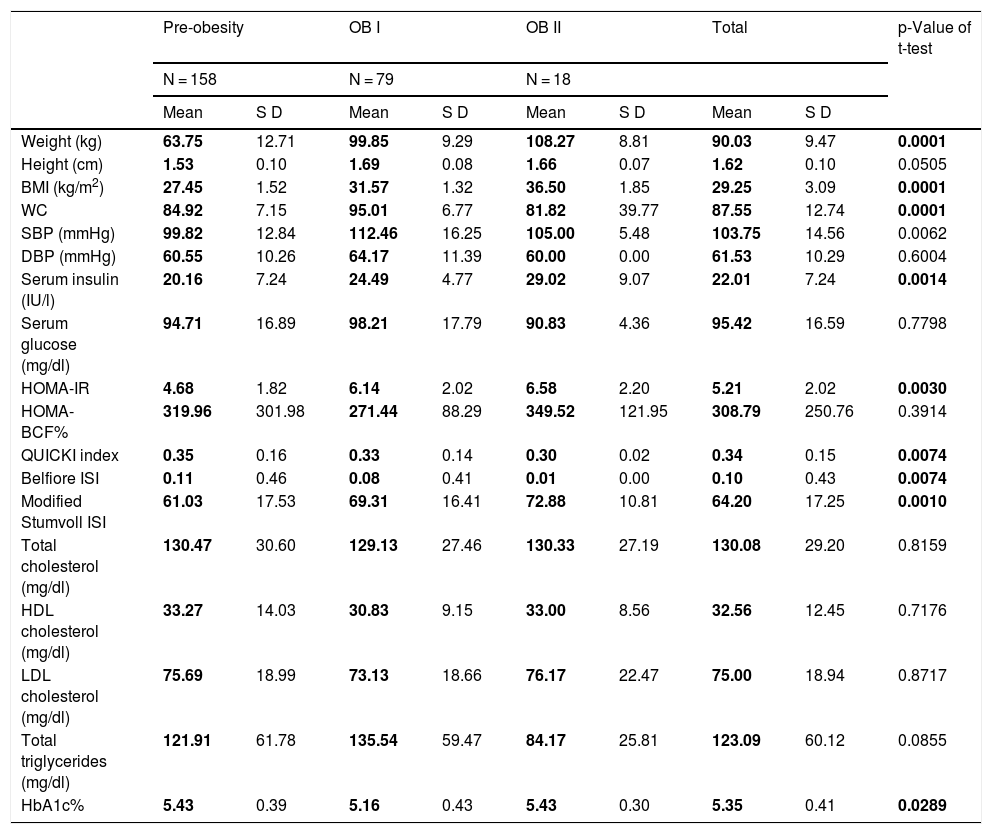
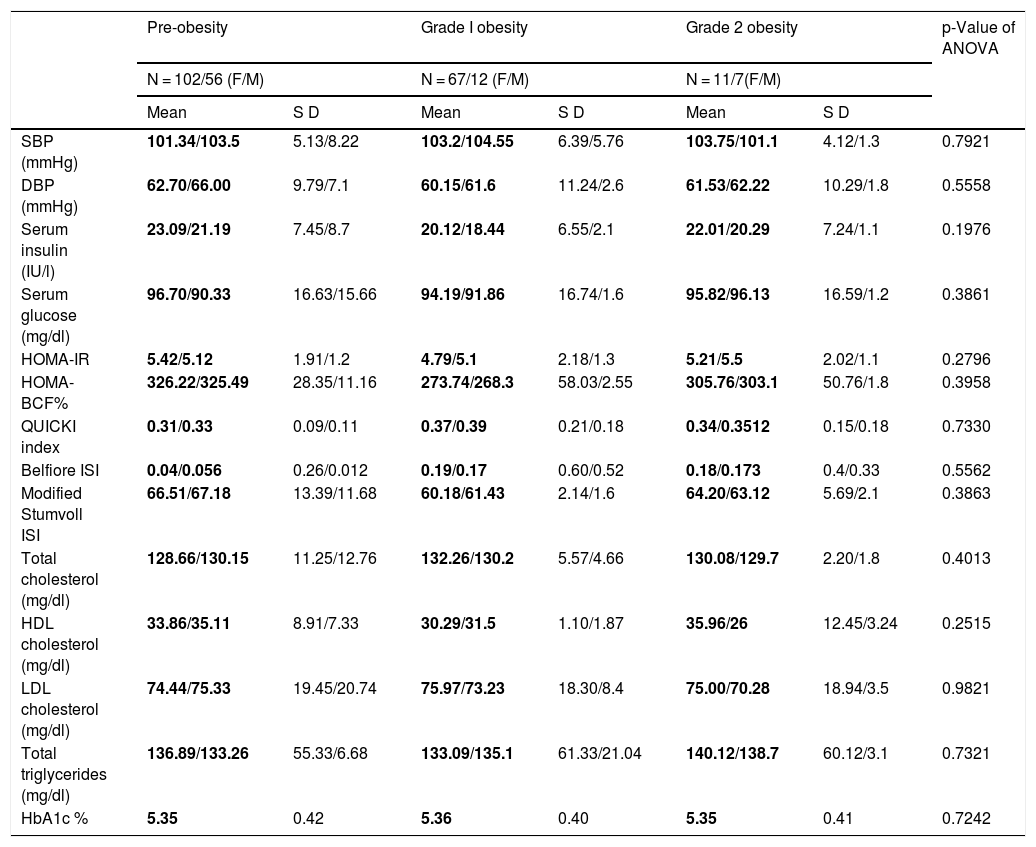
But when stratifying the patients by the degree of obesity in general (adding men and women together), we found differences in SBP levels (pre-obesity: 99.82 mmHg; grade 1 obesity: 112.46 mmHg; grade 2 obesity: 105 mmHg), serum insulin (pre-obesity: 20.16 IU/l; grade 1 obesity: 24.49 IU/l; grade 2 obesity: 29.02 IU/l ), HOMA-IR (pre-obesity: 4.68; grade 1 obesity: 6.14; grade 2 obesity: 6.58), QUICKI index (pre-obesity: 0.35; grade 1 obesity: 0.33; grade 2 obesity: 10.30), Belfiore index (pre-obesity: 99.82 mmHg; grade 1 obesity: 112.46 mmHg; grade 2 obesity: 105 mmHg), Stumvoll index (pre-obesity: 61.03; grade 1 obesity: 69.31; grade 2 obesity: 78.88), and glycosylated haemoglobin A1c (pre-obesity: 5.43; grade 1 obesity: 112.46 mmHg; grade 2 obesity: 5.43). Thus, the pre-obese probands have lower values of SBP, serum insulin and triglycerides, as well as better insulin sensitivity indices (Table 2). In the ANOVA analysis, no significant differences were found between intra- and intergroup gender/degree of obesity (Table 3).
Clinical and biochemical profile according to the degree of obesity.
| Pre-obesity | OB I | OB II | Total | p-Value of t-test | |||||
|---|---|---|---|---|---|---|---|---|---|
| N = 158 | N = 79 | N = 18 | |||||||
| Mean | S D | Mean | S D | Mean | S D | Mean | S D | ||
| Weight (kg) | 63.75 | 12.71 | 99.85 | 9.29 | 108.27 | 8.81 | 90.03 | 9.47 | 0.0001 |
| Height (cm) | 1.53 | 0.10 | 1.69 | 0.08 | 1.66 | 0.07 | 1.62 | 0.10 | 0.0505 |
| BMI (kg/m2) | 27.45 | 1.52 | 31.57 | 1.32 | 36.50 | 1.85 | 29.25 | 3.09 | 0.0001 |
| WC | 84.92 | 7.15 | 95.01 | 6.77 | 81.82 | 39.77 | 87.55 | 12.74 | 0.0001 |
| SBP (mmHg) | 99.82 | 12.84 | 112.46 | 16.25 | 105.00 | 5.48 | 103.75 | 14.56 | 0.0062 |
| DBP (mmHg) | 60.55 | 10.26 | 64.17 | 11.39 | 60.00 | 0.00 | 61.53 | 10.29 | 0.6004 |
| Serum insulin (IU/l) | 20.16 | 7.24 | 24.49 | 4.77 | 29.02 | 9.07 | 22.01 | 7.24 | 0.0014 |
| Serum glucose (mg/dl) | 94.71 | 16.89 | 98.21 | 17.79 | 90.83 | 4.36 | 95.42 | 16.59 | 0.7798 |
| HOMA-IR | 4.68 | 1.82 | 6.14 | 2.02 | 6.58 | 2.20 | 5.21 | 2.02 | 0.0030 |
| HOMA-BCF% | 319.96 | 301.98 | 271.44 | 88.29 | 349.52 | 121.95 | 308.79 | 250.76 | 0.3914 |
| QUICKI index | 0.35 | 0.16 | 0.33 | 0.14 | 0.30 | 0.02 | 0.34 | 0.15 | 0.0074 |
| Belfiore ISI | 0.11 | 0.46 | 0.08 | 0.41 | 0.01 | 0.00 | 0.10 | 0.43 | 0.0074 |
| Modified Stumvoll ISI | 61.03 | 17.53 | 69.31 | 16.41 | 72.88 | 10.81 | 64.20 | 17.25 | 0.0010 |
| Total cholesterol (mg/dl) | 130.47 | 30.60 | 129.13 | 27.46 | 130.33 | 27.19 | 130.08 | 29.20 | 0.8159 |
| HDL cholesterol (mg/dl) | 33.27 | 14.03 | 30.83 | 9.15 | 33.00 | 8.56 | 32.56 | 12.45 | 0.7176 |
| LDL cholesterol (mg/dl) | 75.69 | 18.99 | 73.13 | 18.66 | 76.17 | 22.47 | 75.00 | 18.94 | 0.8717 |
| Total triglycerides (mg/dl) | 121.91 | 61.78 | 135.54 | 59.47 | 84.17 | 25.81 | 123.09 | 60.12 | 0.0855 |
| HbA1c% | 5.43 | 0.39 | 5.16 | 0.43 | 5.43 | 0.30 | 5.35 | 0.41 | 0.0289 |
BCF: beta cell mass; BMI: body mass index; DBP: diastolic blood pressure; HbA1c: glycosylated haemoglobin; HDL cholesterol: high-density lipoprotein cholesterol; HOMA: homeostatic model assessment; IR: insulin resistance; ISI: insulin sensitivity index; LDL cholesterol: low-density lipoprotein cholesterol; QUICKI: quantitative insulin sensitivity check index; SD: standard deviation; SBP: systolic blood pressure; WC: waist circumference.
Clinical and biochemical profile of the population analysed by gender/degree of obesity.
| Pre-obesity | Grade I obesity | Grade 2 obesity | p-Value of ANOVA | ||||
|---|---|---|---|---|---|---|---|
| N = 102/56 (F/M) | N = 67/12 (F/M) | N = 11/7(F/M) | |||||
| Mean | S D | Mean | S D | Mean | S D | ||
| SBP (mmHg) | 101.34/103.5 | 5.13/8.22 | 103.2/104.55 | 6.39/5.76 | 103.75/101.1 | 4.12/1.3 | 0.7921 |
| DBP (mmHg) | 62.70/66.00 | 9.79/7.1 | 60.15/61.6 | 11.24/2.6 | 61.53/62.22 | 10.29/1.8 | 0.5558 |
| Serum insulin (IU/l) | 23.09/21.19 | 7.45/8.7 | 20.12/18.44 | 6.55/2.1 | 22.01/20.29 | 7.24/1.1 | 0.1976 |
| Serum glucose (mg/dl) | 96.70/90.33 | 16.63/15.66 | 94.19/91.86 | 16.74/1.6 | 95.82/96.13 | 16.59/1.2 | 0.3861 |
| HOMA-IR | 5.42/5.12 | 1.91/1.2 | 4.79/5.1 | 2.18/1.3 | 5.21/5.5 | 2.02/1.1 | 0.2796 |
| HOMA-BCF% | 326.22/325.49 | 28.35/11.16 | 273.74/268.3 | 58.03/2.55 | 305.76/303.1 | 50.76/1.8 | 0.3958 |
| QUICKI index | 0.31/0.33 | 0.09/0.11 | 0.37/0.39 | 0.21/0.18 | 0.34/0.3512 | 0.15/0.18 | 0.7330 |
| Belfiore ISI | 0.04/0.056 | 0.26/0.012 | 0.19/0.17 | 0.60/0.52 | 0.18/0.173 | 0.4/0.33 | 0.5562 |
| Modified Stumvoll ISI | 66.51/67.18 | 13.39/11.68 | 60.18/61.43 | 2.14/1.6 | 64.20/63.12 | 5.69/2.1 | 0.3863 |
| Total cholesterol (mg/dl) | 128.66/130.15 | 11.25/12.76 | 132.26/130.2 | 5.57/4.66 | 130.08/129.7 | 2.20/1.8 | 0.4013 |
| HDL cholesterol (mg/dl) | 33.86/35.11 | 8.91/7.33 | 30.29/31.5 | 1.10/1.87 | 35.96/26 | 12.45/3.24 | 0.2515 |
| LDL cholesterol (mg/dl) | 74.44/75.33 | 19.45/20.74 | 75.97/73.23 | 18.30/8.4 | 75.00/70.28 | 18.94/3.5 | 0.9821 |
| Total triglycerides (mg/dl) | 136.89/133.26 | 55.33/6.68 | 133.09/135.1 | 61.33/21.04 | 140.12/138.7 | 60.12/3.1 | 0.7321 |
| HbA1c % | 5.35 | 0.42 | 5.36 | 0.40 | 5.35 | 0.41 | 0.7242 |
BCF: beta cell mass; BMI: body mass index; DBP: diastolic blood pressure; HbA1c: glycosylated haemoglobin; HDL cholesterol: high-density lipoprotein cholesterol; HOMA: homeostatic model assessment; IR: insulin resistance; ISI: insulin sensitivity index; LDL cholesterol: low-density lipoprotein cholesterol; QUICKI: quantitative insulin sensitivity check index; SBP: systolic blood pressure; SD: standard deviation; WC: waist circumference.
Regarding the frequency of alleles of the VNTR of ATXN2 in the total population analysed, it was as follows: the 22-repeat allele is the most frequent with a frequency of 93.33% (n = 476 alleles); followed by the one with 23 repeats with 2.94% (n = 15 alleles), 18 and 19 repeats with 0.18 respectively 1.18% (n = 6/n = 6 alleles), those with 20 and 29 repeats with a frequency of 0.59% each (n = 3/n = 3 alleles), and 24 repeats with 0.19% (n = 1 allele), these last ones being allelic variants in the analysed population (frequency less than or equal to 0.5%), in which 7 of the 22 possible alleles were found. In relation to the distribution of observed genotypes of the VNTR of the ATXN2 gene in the study population (n = 255 subjects), the homozygous genotype with 22 repeats is the most frequent, in 86.67% of the study subjects (n = 221), followed by the 22/23 heterozygous genotype in 5.88% (n = 15 subjects), heterozygotes with short alleles 18/22 and 19/22 in 2.35% each (n = 6/n = 6 subjects), and 20/22 in 1.18% (n = 3 subjects). Heterozygotes with long alleles 22/29 with a relative frequency of 1.18% (n = 3 subjects) and 22/24 with a frequency of 0.39% (n = 1 subject), with 7 of the 482 possible genotypes found in the analysed population. The relative frequencies of expected genotypes were: 18/22 with 2.19% (n = 5.6 subjects), 19/22 with 2.19% (n = 5.6 subjects), 20/22 with 1.09% (n = 2.8 subjects), 22/22 with 87.05% (n = 222 subjects), 22/23 with 5.49% (n = 14 subjects), 22/24 with 0.38% (n = 0.9933 subjects) and 22/29 with 1.4% (n = 3.8 subjects). When comparing the distribution of the observed genotype frequencies with those we expected, no statistical differences were found, so the VNTR is in Hardy Weinberg equilibrium, X2 = 0.1677, p = >0.05.
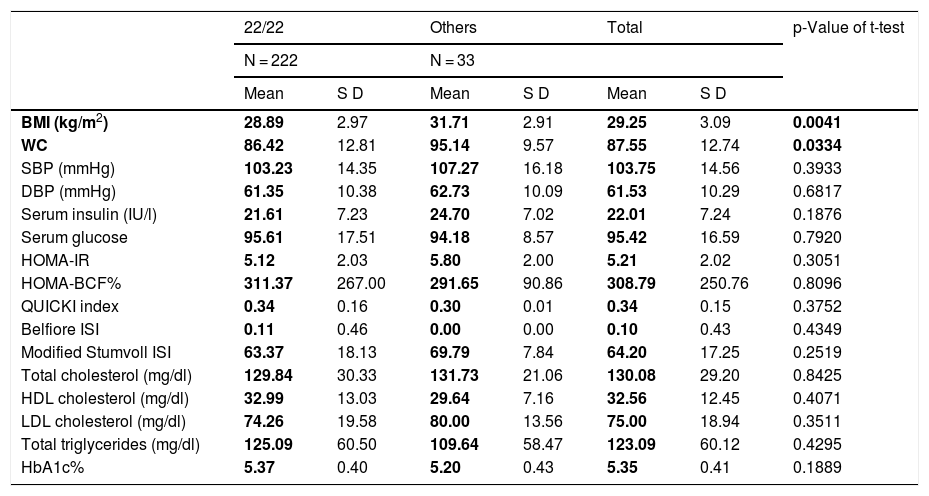
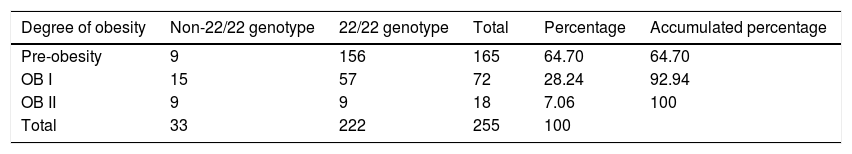
VNTR of ATXN2 and its relationship with the metabolic profileWhen grouping the study population by genotypes, we found that homozygous 22/22 carriers (n = 222 subjects) did not show differences in the parameters of the metabolic profile between the groups (Table 4). Therefore, the 22/22 genotype (which in general is the most frequent in all populations in the world), is not associated with obesity, but when comparing the average BMI and WC values of patients to the 22-repeat homozygote with the carriers of the different genotypes, the latter presented an association with a higher BMI and WC score (t-test, with a p value <0.05), and therefore with central obesity. This is corroborated by fitting a saturated linear log model, where all the variables that are analysed are considered as response variables; thus, the non-22/22 genotype (18/22, 19/22, 20/22, 22/23, 22/24, 22/29, n = 33 subjects), is the one that does correlate positively with the degree of obesity, with a correlation coefficient of 2.85, OR values of 4.56, p = 0.003, X2 = 11.3769, standard error of 0.816, as shown in Table 5. Therefore, there is a positive covariation between the degree of obesity and the distribution of VNTR of ATXN2 genotypes, which increases the risk of developing (OR) obesity.
Clinical and biochemical profile in relation to the VNTR of ATXN2.
| 22/22 | Others | Total | p-Value of t-test | ||||
|---|---|---|---|---|---|---|---|
| N = 222 | N = 33 | ||||||
| Mean | S D | Mean | S D | Mean | S D | ||
| BMI (kg/m2) | 28.89 | 2.97 | 31.71 | 2.91 | 29.25 | 3.09 | 0.0041 |
| WC | 86.42 | 12.81 | 95.14 | 9.57 | 87.55 | 12.74 | 0.0334 |
| SBP (mmHg) | 103.23 | 14.35 | 107.27 | 16.18 | 103.75 | 14.56 | 0.3933 |
| DBP (mmHg) | 61.35 | 10.38 | 62.73 | 10.09 | 61.53 | 10.29 | 0.6817 |
| Serum insulin (IU/l) | 21.61 | 7.23 | 24.70 | 7.02 | 22.01 | 7.24 | 0.1876 |
| Serum glucose | 95.61 | 17.51 | 94.18 | 8.57 | 95.42 | 16.59 | 0.7920 |
| HOMA-IR | 5.12 | 2.03 | 5.80 | 2.00 | 5.21 | 2.02 | 0.3051 |
| HOMA-BCF% | 311.37 | 267.00 | 291.65 | 90.86 | 308.79 | 250.76 | 0.8096 |
| QUICKI index | 0.34 | 0.16 | 0.30 | 0.01 | 0.34 | 0.15 | 0.3752 |
| Belfiore ISI | 0.11 | 0.46 | 0.00 | 0.00 | 0.10 | 0.43 | 0.4349 |
| Modified Stumvoll ISI | 63.37 | 18.13 | 69.79 | 7.84 | 64.20 | 17.25 | 0.2519 |
| Total cholesterol (mg/dl) | 129.84 | 30.33 | 131.73 | 21.06 | 130.08 | 29.20 | 0.8425 |
| HDL cholesterol (mg/dl) | 32.99 | 13.03 | 29.64 | 7.16 | 32.56 | 12.45 | 0.4071 |
| LDL cholesterol (mg/dl) | 74.26 | 19.58 | 80.00 | 13.56 | 75.00 | 18.94 | 0.3511 |
| Total triglycerides (mg/dl) | 125.09 | 60.50 | 109.64 | 58.47 | 123.09 | 60.12 | 0.4295 |
| HbA1c% | 5.37 | 0.40 | 5.20 | 0.43 | 5.35 | 0.41 | 0.1889 |
BCF: beta cell mass; BMI: body mass index; DBP: diastolic blood pressure; HbA1c: glycosylated haemoglobin; HDL cholesterol: high-density lipoprotein cholesterol; HOMA: homeostatic model assessment; IR: insulin resistance; ISI: insulin sensitivity index; LDL cholesterol: low-density lipoprotein cholesterol; QUICKI: quantitative insulin sensitivity check index; SBP: systolic blood pressure; SD: standard deviation; WC: waist circumference.
Saturated log linear model, includes obesity and the relationship between the VNTR of ATXN2.
| Degree of obesity | Non-22/22 genotype | 22/22 genotype | Total | Percentage | Accumulated percentage |
|---|---|---|---|---|---|
| Pre-obesity | 9 | 156 | 165 | 64.70 | 64.70 |
| OB I | 15 | 57 | 72 | 28.24 | 92.94 |
| OB II | 9 | 9 | 18 | 7.06 | 100 |
| Total | 33 | 222 | 255 | 100 |
| OR | p value | [95% confidence | interval] | |
|---|---|---|---|---|
| Obesity (non-22/22 genotype) | 4.56 | 0.005 | 4.462 | 4.661 |
| Obesity (22/22 genotype) | 3.80 | 0.164 | 1.842 | 5.762 |
OR: odds ratio. Non-22/22 genotype (18/22, 19/22, 22/20, 22/23, 22/24, 22/29).
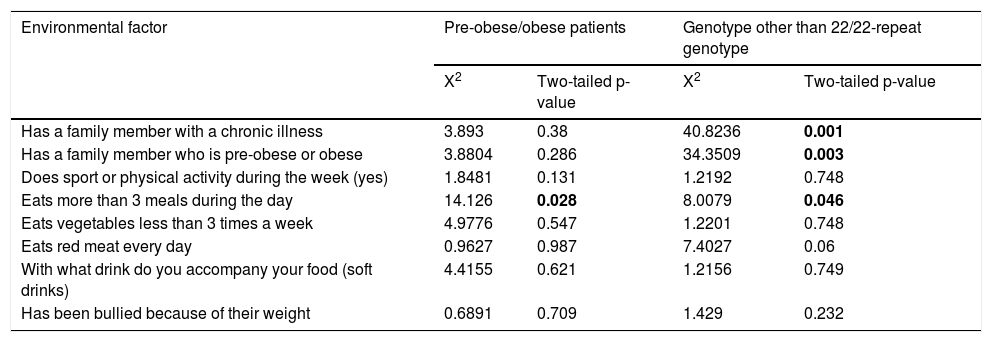
The most frequent environmental factor in the Chinantec Amerindian population analysed was the consumption of red meat every day (n = 252), followed by the consumption of vegetables fewer than three times per week (n = 222), having a relative suffering from a chronic disease (diabetes, dyslipidaemia, obesity or hypertension) (n = 177), what drink they accompany their meals with (soft drinks) (n = 141), more than three meals during the day (n = 135), sport or physical activity during the week (yes) (n = 108), being bullied because of their weight (n = 45), having a relative who was overweight or obese (n = 42). No gender differences were found regarding this distribution (p > 0.05, X2 <6.89). The consumption of food more than three times a day shows a moderate positive association with obesity, with a correlation coefficient of r = 0.384, X2 = 14.1260 and p = 0.028. Having a relative with a chronic disease, with pre-obesity or obesity, consuming more than three meals a day, and being a carrier of a genotype other than the homozygote with 22/22 repeats, correlate positively with obesity with correlation coefficients of r = 0.189, r = 0.327 and r = 114, respectively (Table 6). Consumption of red meat only influenced the development of obesity in carriers of a genotype other than the homozygote with 22/22 repeats (Table 6).
Environmental factors and interaction with the VNTR of ATXN2.
| Environmental factor | Pre-obese/obese patients | Genotype other than 22/22-repeat genotype | ||
|---|---|---|---|---|
| X2 | Two-tailed p-value | X2 | Two-tailed p-value | |
| Has a family member with a chronic illness | 3.893 | 0.38 | 40.8236 | 0.001 |
| Has a family member who is pre-obese or obese | 3.8804 | 0.286 | 34.3509 | 0.003 |
| Does sport or physical activity during the week (yes) | 1.8481 | 0.131 | 1.2192 | 0.748 |
| Eats more than 3 meals during the day | 14.126 | 0.028 | 8.0079 | 0.046 |
| Eats vegetables less than 3 times a week | 4.9776 | 0.547 | 1.2201 | 0.748 |
| Eats red meat every day | 0.9627 | 0.987 | 7.4027 | 0.06 |
| With what drink do you accompany your food (soft drinks) | 4.4155 | 0.621 | 1.2156 | 0.749 |
| Has been bullied because of their weight | 0.6891 | 0.709 | 1.429 | 0.232 |
The present study shows metabolic differences and cardiovascular risk factors in Amerindian men and women of Chinantec ancestry from the State of Oaxaca, which had not been previously reported. In this regard, the women included in the study presented more resistance to insulin, which can be explained by the higher percentage of subcutaneous fat in the hips and in the breasts.17 This is validated with their higher values in the Stumvoll index16 which considers BMI, the average value of which was higher in the women included in this study. The high levels of triglycerides in men coincide with what is expected from epidemiological studies in the Mexican population, and correlate directly with central obesity, as in the present study.17,18
In relation to the degree of obesity with the metabolic parameters, statistical differences were found in insulin levels, as well as indices related to insulin resistance, since the entire population shows this as the main phenotype, and it is a pathophysiological factor leading to obesity, which is expected according to the natural history of metabolic syndrome. It should be noted that the patients with obesity and pre-obesity analysed in this study presented normal HbA1c values. However, the group with grade II obesity had the highest average within the normal range among the patients, with this difference being significant. These results are very similar to those reported in the adult population of Costa Rica with diabetes, where controlled patients with grade 2 obesity and insulin resistance had higher HbA1c values, very similar to what was found in the present study.19 This may suggest that the degree of hyperglycaemia and metabolic deterioration, as well as protein glycosylation that subjects with a higher degree of obesity have, leads them more to microangiopathy that leads to the development of type 2 diabetes mellitus. And for this reason, when analysing the clinical and biochemical profile by gender/degree of obesity, as the groups become smaller, the variance is reduced and therefore no such correlation was found among the metabolic parameters in this sense, since the population per se presents a thrifty phenotype genotype with clinically evident insulin resistance that it is greater in women,5–7 as reported in this study. This is what really influences the different metabolic abnormalities that were found, together with other genetic factors.
It should be noted that this is the first study that analyses the frequency of alleles and genotypes of the VNTR (CAG)n of the ATXN2 gene in an adult Amerindian population from Oaxaca state, which contributes substantially to the diversity and genetic anthropology of the Mexican population. The frequencies are very similar to those reported in paediatric patients from Ribera de Chapala, Jalisco, in north-west Mexico, and from Tuxtepec, Oaxaca (paediatric patients), and in mestizo Mexican adults from the central area of Mexico City.20,21 The heterozygosity indices are greater than 80%, where the 22-repeat allele is the most frequent, as in other populations, which is consistent with the low evolutionary divergence of this locus and therefore the state of equilibrium preserved by the locus, as in this study.12,13,22–28
On the other hand, this study shows that the VNTR (CAG)n of the ATXN2 gene is a factor associated with the degree of obesity, since it correlates directly with BMI and WC, particularly in carriers of genotypes with alleles other than 22 repeats in the Chinantec Amerindian population of Oaxaca state. The results are very similar to those found in a study of severely obese patients from the United Kingdom, Indonesia and the Caribbean.14 This supports previous linkage studies that suggest that the ATXN2 gene is associated with the development of obesity.20–24
Moreover, this study is the first study that analyses the VNTR (CAG)n of the ATXN2 gene and its influence on the metabolic profile of cardiovascular risk in humans as such. It has been reported in murine models that ATXN2 deficiency leads to a decrease in the insulin receptor in the liver and the brain, as well as dyslipidaemia, fatty liver and obesity.9 Although it is true that it is postulated that ATXN2 could be one of the genes that make up the thrifty genotype and be associated with insulin resistance, in the present study it was not found that any ATXN2 genotype influenced insulin resistance, or the lipid profile as such, which were found to relate more closely to gender or the degree of obesity. But the population presented hyperphagia and hyperinsulinaemia, characteristic of multiple organ resistance syndrome, which Corkey described, clinically translated into the consumption of highly caloric and fatty foods such as red meat, several times a day, which, added to the genetic factor analysed, suggests that ataxin-2 may be one of the triggers of obesity and be part of the genes of the thrifty genotype.8
There have been previous reports of other polymorphisms that participate in the inflammation that goes hand in hand with insulin resistance and are part of the thrifty genotype, that influence serum levels of triglycerides and other parameters of cardiovascular risk in the mestizo population of Guerrero state, Mexico, such as the SNP −844 G/A of PAI,23 which have not been studied in the Amerindian population of Tuxtepec, and will not be included in the main objective of this report.
In the present study, other environmental factors were considered, such as physical activity, soft drink consumption, vegetable consumption, the number of times food is consumed per day and the incidence of bullying, with the consumption of red meat and a greater number of meals per day found to be associated with interaction with the VNTR of ATXN2, which suggests a synergistic effect that had not been previously described. In the Amerindian populations of Oaxaca, the diet factor is a determinant of hypertriglyceridaemia, since they have a high regional consumption of various breads (carbohydrates) and red meat, in enchiladas of pork (cecina) or beef (tasajo), therefore in the present study a positive association was found with this risk factor.26 Other environmental factors had no effect. This suggests that obesity in this Chinantec ethnic group has a high genetic component and a synergistic effect with diet, as has been seen in other populations.25 In addition, an association was observed between having a relative with chronic disease and the genotype other than the 22/22 homozygote, which had not been previously described in the literature.
There are other factors that lead to the development of obesity in Mexico and worldwide, including the presence of adenovirus 36, which has also been related to metabolic alterations in obese paediatric patients in south-eastern Mexico, and correlates with higher triglyceride levels, cholesterol and BMI. Its study in the population of the state of Oaxaca will be the subject of further studies, as it was beyond the scope of this study.27
It should be noted that this study has a limitation in that it is a cross-sectional study, which limits it to estimating the preventable fraction, as well as the fraction attributable to the population with VNTR of ATXN2, and the results presented are of attributable risk and relative risk, for which case-control and replication studies are subsequently required, in which the risk of development of obesity is estimated in comparison with the healthy Mexican population.
In conclusion, the present study suggests that the VNTR (CAG)n of the ATXN2 gene influences the degree of obesity and the waist circumference values in the adult Mexican Amerindian population analysed, as well as being associated with a history of chronic disease and the development of obesity. Other metabolic parameters analysed in this population are influenced by gender (female sex) as in the case of those related to insulin resistance, while others are influenced by the degree of obesity and metabolic control such as the percentage of glycosylated haemoglobin A1c. Triglyceride levels are influenced by gender (male sex), and by diet and the genetic factor that was analysed in the present study.
FundingPRODEP-SEP. Fund for the incorporation of new full-time lecturers. Project ID 60800. This study was financed by PROMEP-SEP Support Fund for the incorporation of new full-time lecturers-2012 [grant number PROMEP/103-5/12/4528]; Fondo de Fortalecimiento de CA Convocatoria 2013 [Academic Bodies Strengthening Fund Call 2013] [grant number IDCA11337, UNISIS-CA-10], Mexico.
Conflicts of interestThe authors declare that they have no conflicts of interest.
To the medical and nursing staff of the Jurisdiction of Tuxtepec Oaxaca, for their support in taking samples from patients, evaluations and conducting biochemical studies.
Please cite this article as: Dávalos-Rodríguez NO, Rincón-Sánchez AR, Madrigal Ruiz PM, Flores-Alvarado LJ, López-Toledo S, Villafán-Bernal JR, et al. Polimorfismo VNTR (CAG)n del gen ATXN2 y parámetros metabólicos de riesgo cardiovascular asociados con el grado de obesidad en población amerindia de Oaxaca. Endocrinol Diabetes Nutr. 2022;69:15–24.
