


The transition of adolescents from pediatric to adult hospitals is a planned and guided process that involves changes in the focus, style, and location of care. During this period, complications are common in those with type 1 diabetes mellitus (T1DM). The objective of this study was to understand the influence of a nurse-led structured therapeutic education program on maintaining glycemic control and emotional wellbeing in these adolescents.
Materials and methodsMonocentric quasi-experimental clinical trial of a single group. SPSS and R-Commander were used for statistical analysis, including Student's t-test, Wilcoxon test, Cohen's d, Rosenthal's r, and multivariate linear regression analysis.
ResultsA total of 15 adolescents with a 5-to-17-year history of the disease participated in the study. They had a BMI of 18–26.3kg/m2 and were on basal-bolus therapy. No significant differences were found in glycemic control and emotional wellbeing between baseline values and at 3 months. A significant difference in self-care was observed at 12 months. Family function and eating disorders were positively associated at baseline, 3 months, and 12 months.
ConclusionsThe structured therapeutic education program for adolescents with T1DM transitioning from pediatric to adult care maintains glycemic control and emotional wellbeing.
La transición de adolescentes desde el hospital infantil al de adultos es un proceso planificado y dirigido que representa un cambio en el enfoque, el estilo y en la ubicación de la atención. Durante este período, es común el inicio de complicaciones quienes poseen diabetes mellitus de tipo 1 (DMT1). El objetivo del estudio fue conocer la influencia de un programa de educación terapéutica estructurado liderado por enfermeras en el mantenimiento del control glucémico y bienestar emocional de estos adolescentes.
Materiales y métodosEnsayo clínico monocéntrico cuasiexperimental de un solo grupo. Se utilizaron SPSS y R-Commander para el análisis estadístico, incluyendo la prueba t de Student, la prueba de Wilcoxon, d de Cohen, r de Rosenthal y análisis de regresión lineal multivariable.
ResultadosParticiparon 15 adolescentes de 5–17 años de evolución de la DMT1, con un IMC de 18–26.3kg/m2, y todos estaban en tratamiento bolo-basal. No se encontraron diferencias significativas en el control glucémico y el bienestar emocional entre los valores del inicio y a los 3 meses. Se observó una diferencia significativa en el autocuidado a los 12 meses. La función familiar y los trastornos alimenticios se asociaron positivamente al inicio, a los 3 y a los 12 meses.
ConclusionesEl programa estructurado de educación terapéutica dirigido a adolescentes con DMT1 en la transición de la atención pediátrica a la atención en adultos mantiene el control glucémico y el bienestar emocional.
Type 1 diabetes mellitus (T1DM) is a metabolic disease characterized by a deficiency in the number or activity of pancreatic beta cells and insulin.1 Individuals with T1DM can experience significant biological, psychological, and social impacts due to its signs and symptoms, and are also at risk of severe acute and chronic complications.2 With the increasing incidence of T1DM and T2DM in children and adolescents, a rise in the number of individuals transitioning from childhood or adolescence to adulthood with diabetes is also expected.3
The treatment of T1DM involves comprehensive care, including insulin therapy, physical activity, the adoption of a diet tailored to individual needs,4 and the implementation of therapeutic patient education (TPE). This education is defined as "essential educational activities for the management of chronic diseases, which have an additional therapeutic effect beyond that of all other interventions performed".5 TPE is performed in various contexts, such as during the hospital-based transition from pediatric to adult care.6
Hospital care transition is defined as a scheduled and guided process to change the social and health care context of patient care.7 It represents a shift in focus, style, and often location of care, characterized by the transfer of responsibility for diabetes management from parents or caregivers to adolescents.8 During this period, various complications in the management of children or adolescents with diabetes are a common finding. Some of these complications include loss to follow-up, deterioration of glycemic control, and a decline in emotional well-being, potentially leading to maladaptive behaviors such as eating disorders.9 In fact, reports indicate that only 32% of individuals with T1DM aged 13–18 years and 18% of those older than 19 years achieve recommended glycemic control levels.3
Nurses play a key role in preventing these diabetes-related complications by overseeing the management of adolescents with T1DM during the transition across different phases of hospital care.6 Evidence suggests that nurse-led TPE can significantly benefit the lifestyles of individuals with diabetes, support disease self-management, reduce glycosylated hemoglobin (HbA1c) levels, and contribute to improved health outcomes.10
A study conducted by the American Diabetes Association examined the complexities inherent to the transition of adolescents with diabetes from pediatric to adult care. It highlighted the need to develop a more robust framework for the care and education of this demographic and proposed a series of recommendations to facilitate a gradual transition. The study underscored the importance of providing continuous support to youth during this critical period of change through educational interventions and support tailored to their unique needs.3
On the other hand, a European review emphasized the importance of adopting comprehensive strategies including both pediatric and adult care teams to support young adults during their transition. The review stressed the need for effective coordination, objective evaluation of self-care skills, and attention to psychosocial needs to achieve optimal glycemic control and prevent complications.8 Specifically, in Spain, a study conducted in Barcelona evaluated a structured transition program for youth with T1DM, demonstrating improvements in metabolic control parameters without affecting quality of life. A comparison of individuals with the disease, based on their treatment regimen and adherence, revealed different population profiles, highlighting the effectiveness of coordination between pediatric and adult teams.11
However, there is a relative scarcity of research in the Spanish context on the biopsychosocial impact of transition programs for adolescents with T1DM, underscoring the need for studies that explore the effects of a structured nurse-led hospital transition program on glycemic control and the emotional well-being of these individuals.
Objectives and hypothesesThe general objective of the study was to examine the influence of a structured nurse-led TPE program on maintaining glycemic control and emotional well-being in adolescents with T1DM undergoing the transition from a pediatric to an adult hospital. Specific objectives included: 1) determining the influence of family on eating behaviors, 2) identifying glycemic control and emotional well-being variables that influence the risk of developing eating disorders, and 3) verifying the variables that affect self-care during the transition.
A null (H₀) and an alternative hypothesis (H₁) were established. H₀ proposed that a structured TPE program results in changes in glycemic control and emotional well-being in adolescents with T1DM during hospital transition. H₁ suggested that the structured TPE program promotes the maintenance of glycemic control and emotional well-being in adolescents with T1DM during the hospital transition.
Material and methodsDesignThis study is a single-center, uncontrolled, single-group, non-randomized, quasi-experimental clinical trial. It was conducted to clarify the potential influence of a hospital transition program for adolescents with T1DM in a hospital in Spain. The JBI Checklist for Quasi-Experimental Studies12 was used as a guide to design the study, report the evaluation results, and review the manuscript.
Study context and recruitmentThe clinical trial was conducted at the Diagnostic and Treatment Center, a facility of the Hospital Universitario Virgen del Rocío in Andalusia, a region in southern Spain. Participant selection was based on the fact that only 17 adolescents with T1DM aged 17 and 18 years or younger, within the hospital reference area, would transition from the pediatric to the adult hospital. Recruitment involved nurses recommending study participation to adolescents meeting the eligibility criteria within the first quarter of 2023.
Inclusion and exclusion criteriaEligibility criteria consisted of inclusion and exclusion criteria: inclusion criteria: being an adolescent (17–18 years old), enrolled in the pediatric hospital, undergoing a hospital transition process, and absence of severe psychological disorders. Exclusion criteria: lack of physical access to the study center, recent T1DM onset (T1DM duration < 1 month). Sample size estimation was based on a 95% confidence interval and a 5% margin of error. Given the limited number of 17 adolescents transitioning hospitals, a minimum sample size of 10 participants was estimated.
Study interventionsEducator nurses prepared the transfer of adolescents’ health reports and organized a meeting with them prior to transitioning from the pediatric to the adult hospital. Once transitioned to adult care, visits alternated between endocrinologists and educator nurses. They implemented a course designed by the Advanced Practice Nurse in Complex Diabetes Treatments (APN-CDT), consisting of a 12-month care and TPE program structured in 4 nursing intervention phases:
Phase 1: nurse-led orientation visit. This phase involves a group intervention with 2–5 adolescents, divided into 2 parts. The first part included developing an orientation plan alongside their parents/caregivers. The second part assessed the adolescents’ knowledge and self-management of T1DM through a custom-designed questionnaire and provided a 70-minute educational session. The session covered control goals, downloading and interpreting glucose sensor reports, managing hypo- and hyperglycemia, nutrition, exercise, insulin injection, and precautions for nighttime outings, contraception, and alcohol consumption.
Phase 2: Diabetes education course. All adolescents participated in an educational reinforcement session focused on carbohydrate counting and calculating the insulin-to-carbohydrate ratio. This course was led by diabetes nurse educators in the education classroom, in groups of 2 up to 5 adolescents, over 3 60-minute sessions.
Phase 3: Individualized follow-up. Alternate appointments were scheduled with the endocrinologist and the APN-CDT. Three months after the nurse-led orientation visit, a consultation with the endocrinologist was held. Three months later, a teleconsultation with the APN-CDT was conducted to analyze downloaded glucose monitoring data and agree on necessary interventions for improving the management of T1DM.
Phase 4: Program evaluation and discharge. A final in-person visit with the APN-CDT was scheduled 1year after the nurse-led orientation visit. During this visit, the data downloaded from devices was reviewed, proper glucose monitoring practices were supervised, and key educational aspects of T1DM self-management were reinforced. Therapeutic adjustments were made as necessary.
Prior to implementing the described course, the APN-CDT provided a training session for the nurse educators to ensure understanding and adherence to the intervention protocol. A detailed manual outlining the step-by-step procedures and guidelines for each educational session was developed as a reference for the nurse educators. Additionally, the APN-CDT supervised 100% of the educational sessions for adolescents, ensuring adherence to the session structure and materials used. Any deviations from the original protocol were documented to allow for an analysis of the intervention fidelity.
Data collectionData collection was performed by educator nurses during individual consultations in the TPE room at the Diagnostic and Treatment Center over a 1-year period (March 2023–March 2024). Quantitative data collection included demographic variables (age in years, gender as male/female), T1DM progression (in years), treatment type (basal-bolus/insulin pump), sensor usage time (percentage), and variables related to metabolic control and psychosocial outcomes.
Metabolic control variables included HbA1c (%), sensor usage time (%), time in range (TIR, %), time above range (TAR, 181–250mg/dL [%] and > 250mg/dL [%]), time below range (TBR, 54–69mg/dL [%] and < 54mg/dL [%]), coefficient of variation (CV, %), mean glucose (mg/dL), weight (kg), height (cm), and body mass index (BMI, kg/m²). Values were obtained from device downloads and anthropometric measurements.
Psychosocial outcomes assessed included quality of life, hypoglycemia unawareness, eating behaviors, self-care, and family functioning.
Quality of life was assessed using the 12-item Short Form Survey (SF-12), an abbreviated version of the SF-36 that uses the same domains, such as limitations in physical activities due to health problems, limitations in social activities due to physical or emotional problems, limitations in usual role activities due to physical health or emotional problems, bodily pain, general mental health, vitality—energy and fatigue—and general health perceptions. It consists of 12 questions, can be used in the general population, and has similar validity to the SF-36, although with higher standard errors. The Cronbach's alpha for the physical dimension was 0.63 and for the mental dimension, it was 0.72.12
The number of unnoticed hypoglycemic events was measured using the Clarke questionnaire. It consists of 8 items regarding the patient's perception of hypoglycemia, the frequency of severe and non-severe events, and the range of glucose at which the patient begins to experience symptoms. Each response is classified as normal (A) or abnormal (R), so the total R establishes the patient's perception of hypoglycemia: 1−2R=normal perception; 3R=indeterminate perception; ≥ 4R=abnormal perception. The internal consistency evaluation of the questionnaire (Cronbach's alpha) was 0.75.13
Self-care was evaluated using the Diabetes Self-Care Inventory-Revised (SCI-R), which has 15 questions related to various dimensions of self-care, assigned a score between 0 and 100. Adherence is considered high when the score is ≥ 65 and low if < 65. It has good internal consistency (Cronbach's alpha=0.75), test-retest reliability (r=0.82), and structural validity (r>0.40).14
The risk of developing eating disorders was measured through the EPAD-R questionnaire, which has 16 questions organized around 5 factors (eating attitudes, bulimic behaviors, weight control, avoidance, and restriction). The questionnaire shows notable consistency in both its full and abbreviated versions, with a high consistency value (Cronbach's alpha=0.82).15
Family functioning was assessed using the validated Spanish version of the Family Apgar questionnaire consisting of 5 sections arranged in a unidimensional scale that evaluates 5 components of family function, such as adaptability, association, growth, affection, and resolution. The intraclass correlation coefficients for the 5 items of the Family Apgar were > 0.55, whether self- or hetero-administered; the scale coefficients were 0.86 and 0.81, respectively. The item-scale correlation ranged between 0.61 and 0.71. Cronbach's alpha was 0.84.16
Data analysisNormality and homoscedasticity were checked using the Shapiro-Wilk and Levene tests, respectively. These assumptions were met at baseline for all variables, except for both TBR, CV, unnoticed hypoglycemia, and the risk of eating disorders. At 3 months, TBR<54mg/dL, unnoticed hypoglycemia, the risk of eating disorders, and family support did not meet the normality and homoscedasticity assumptions. At 12 months, sensor use time, HbA1c, TAR 181−250mg/dL, both TBR, and lack of hypoglycemia awareness did not follow both assumptions.
The analysis of results was conducted blindly using Microsoft Excel version 2401, SPSS version 29.0.1.0, and R-Commander version 4.3.2, considering a 95% confidence interval. The analysis was based on the calculation of central tendency and dispersion measures of the variables, and on the comparison of values obtained for each variable at different time points, using the paired Student's t-test and the Wilcoxon test, depending on whether the distribution was parametric or non-parametric, respectively. The effect size of these potential differences was calculated using Cohen's d and Rosenthal's r, depending on whether the distribution followed a normal or non-normal distribution. The Student’s t and the Wilcoxon test were also used to verify possible statistical associations between variables, and multivariate analyses were conducted using 2 linear regression models:
- 1.
In model #1, the risk of developing eating disorders was designated as the dependent variable, while sex, duration of diabetes, BMI, weight, self-care, and family function were considered independent variables.
- 2.
In model #2, self-care was assigned as the dependent variable, and family function, coefficient of variability, risk of developing eating disorders, quality of life, TIR, BMI, mean glucose, and TBR<54mg/dL were considered independent variables.
The clinical trial was prospectively approved by an ethics committee (Biomedical Research Ethics Committee of Andalusia, (ID: MPSA-ETDT-2022)) and registered at clinicaltrials.gov (ID: NCT05766215). Participants signed an informed consent form. Data were digitized in Microsoft Excel, SPSS, and R-Commander files, which were safeguarded using a server protected by double-factor authentication.
ResultsThe nurses approached a total of 17 adolescents who met the eligibility criteria. Of these, 15 accepted participation and completed both the study and the hospital transition. A total of 10 (66.67 %) were men and 5 (33.33 %) were women, with ages ranging from 17.20±0.41years (range, 17–18). Additionally, they had a BMI of 22.68±2.47kg/m² (range, 18–26.30), a diabetes duration of 7.87±3.04 years (range, 5–17), and all were on basal-bolus therapy. The participants’ baseline characteristics with respect to variables related to glycemic control and emotional well-being are shown in Table 1.
Baseline characteristics of participants.
| Category | n | % |
|---|---|---|
| Sex | ||
| Male | 10 | 66.70 |
| Female | 5 | 33.30 |
| Type of treatment | ||
| Basal-Bolus | 15 | 100.00 |
| Min | Max | Mean | MSE | SD | |
|---|---|---|---|---|---|
| Age (years) | 17 | 18 | 17.20 | 0.10 | 0.41 |
| Weight (kg) | 52 | 92 | 67.63 | 3.00 | 11.64 |
| Height (cm) | 158.50 | 187 | 172.23 | 2.16 | 8.37 |
| BMI (kg/m²) | 18 | 26.30 | 22.68 | 0.63 | 2.47 |
| Progression of T1DM (years) | 5 | 17 | 7.87 | 0.78 | 3.04 |
| Sensor use time (%) | 80 | 100 | 87.27 | 1.77 | 6.86 |
| HbA1c (%) | 6.50 | 10.90 | 8.07 | 0.29 | 1.14 |
| TIR (%) | 18 | 77 | 46 | 3.96 | 15.35 |
| TAR 181−250mg/dL (%) | 14 | 59 | 30.53 | 3.32 | 12.88 |
| TAR > 250mg/dL (%) | 0 | 54 | 20.53 | 3.76 | 14.57 |
| TBR 54−69mg/dL (%) | 0 | 8 | 2.93 | 0.75 | 2.93 |
| TBR<54mg/dL (%) | 0 | 7 | 0.73 | 0.47 | 1.83 |
| CV (%) | 0.00 | 58.10 | 38.45 | 3.96 | 14.28 |
| Mean glucose (mg/dL) | 133 | 292 | 195.29 | 10.79 | 40.40 |
| Quality of life (SF-12) | 30 | 37 | 33 | 0.44 | 1.73 |
| Unnoticed hypoglycemia (Clarke) | 0 | 3 | 1 | 0.21 | 0.84 |
| Eating disorders (EPAD-R) | 0 | 37 | 11.40 | 2.72 | 10.54 |
| Self-care (SCI-R) | 49 | 64 | 56.57 | 1.45 | 5.45 |
| Family functioning (Apgar) | 20 | 36 | 29.27 | 1.42 | 5.53 |
The sample size was 15 for all variables except for the CV (13), mean glucose (14), and SCI-R (14).
CV: coefficient of variation; SD: standard deviation; MSE: mean standard error; HbA1c: glycated hemoglobin; BMI: body mass index; Min: minimum; Max: maximum; TAR: time above range; TBR: time below range; TIR: time in range.
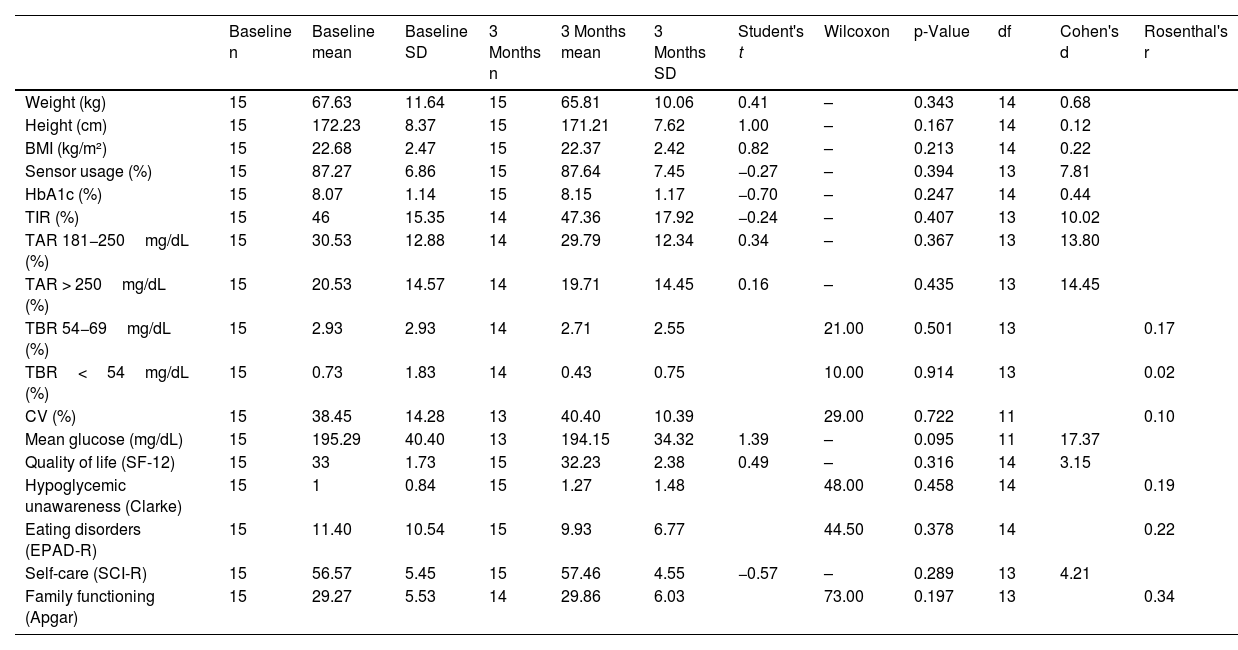
No significant differences (p>0.05) were found in any of the variables related to glycemic control and emotional well-being at baseline and 3 months (Table 2). However, of note, the difference found in mean glucose had a larger effect size vs the other variables, as the smallest effect size was 0.20 for BMI, while for mean glucose it was 17.37 (Table 2).
Comparison of glycemic control and emotional outcomes at baseline and at 3 months.
| Baseline n | Baseline mean | Baseline SD | 3 Months n | 3 Months mean | 3 Months SD | Student's t | Wilcoxon | p-Value | df | Cohen's d | Rosenthal's r | |
|---|---|---|---|---|---|---|---|---|---|---|---|---|
| Weight (kg) | 15 | 67.63 | 11.64 | 15 | 65.81 | 10.06 | 0.41 | – | 0.343 | 14 | 0.68 | |
| Height (cm) | 15 | 172.23 | 8.37 | 15 | 171.21 | 7.62 | 1.00 | – | 0.167 | 14 | 0.12 | |
| BMI (kg/m²) | 15 | 22.68 | 2.47 | 15 | 22.37 | 2.42 | 0.82 | – | 0.213 | 14 | 0.22 | |
| Sensor usage (%) | 15 | 87.27 | 6.86 | 15 | 87.64 | 7.45 | −0.27 | – | 0.394 | 13 | 7.81 | |
| HbA1c (%) | 15 | 8.07 | 1.14 | 15 | 8.15 | 1.17 | −0.70 | – | 0.247 | 14 | 0.44 | |
| TIR (%) | 15 | 46 | 15.35 | 14 | 47.36 | 17.92 | −0.24 | – | 0.407 | 13 | 10.02 | |
| TAR 181−250mg/dL (%) | 15 | 30.53 | 12.88 | 14 | 29.79 | 12.34 | 0.34 | – | 0.367 | 13 | 13.80 | |
| TAR > 250mg/dL (%) | 15 | 20.53 | 14.57 | 14 | 19.71 | 14.45 | 0.16 | – | 0.435 | 13 | 14.45 | |
| TBR 54−69mg/dL (%) | 15 | 2.93 | 2.93 | 14 | 2.71 | 2.55 | 21.00 | 0.501 | 13 | 0.17 | ||
| TBR<54mg/dL (%) | 15 | 0.73 | 1.83 | 14 | 0.43 | 0.75 | 10.00 | 0.914 | 13 | 0.02 | ||
| CV (%) | 15 | 38.45 | 14.28 | 13 | 40.40 | 10.39 | 29.00 | 0.722 | 11 | 0.10 | ||
| Mean glucose (mg/dL) | 15 | 195.29 | 40.40 | 13 | 194.15 | 34.32 | 1.39 | – | 0.095 | 11 | 17.37 | |
| Quality of life (SF-12) | 15 | 33 | 1.73 | 15 | 32.23 | 2.38 | 0.49 | – | 0.316 | 14 | 3.15 | |
| Hypoglycemic unawareness (Clarke) | 15 | 1 | 0.84 | 15 | 1.27 | 1.48 | 48.00 | 0.458 | 14 | 0.19 | ||
| Eating disorders (EPAD-R) | 15 | 11.40 | 10.54 | 15 | 9.93 | 6.77 | 44.50 | 0.378 | 14 | 0.22 | ||
| Self-care (SCI-R) | 15 | 56.57 | 5.45 | 15 | 57.46 | 4.55 | −0.57 | – | 0.289 | 13 | 4.21 | |
| Family functioning (Apgar) | 15 | 29.27 | 5.53 | 14 | 29.86 | 6.03 | 73.00 | 0.197 | 13 | 0.34 |
CV: coefficient of variation; SD: standard deviation; df: degrees of freedom; HbA1c: glycated hemoglobin; BMI: body mass index; TAR: time above range; TBR: time below range; TIR: time in range.
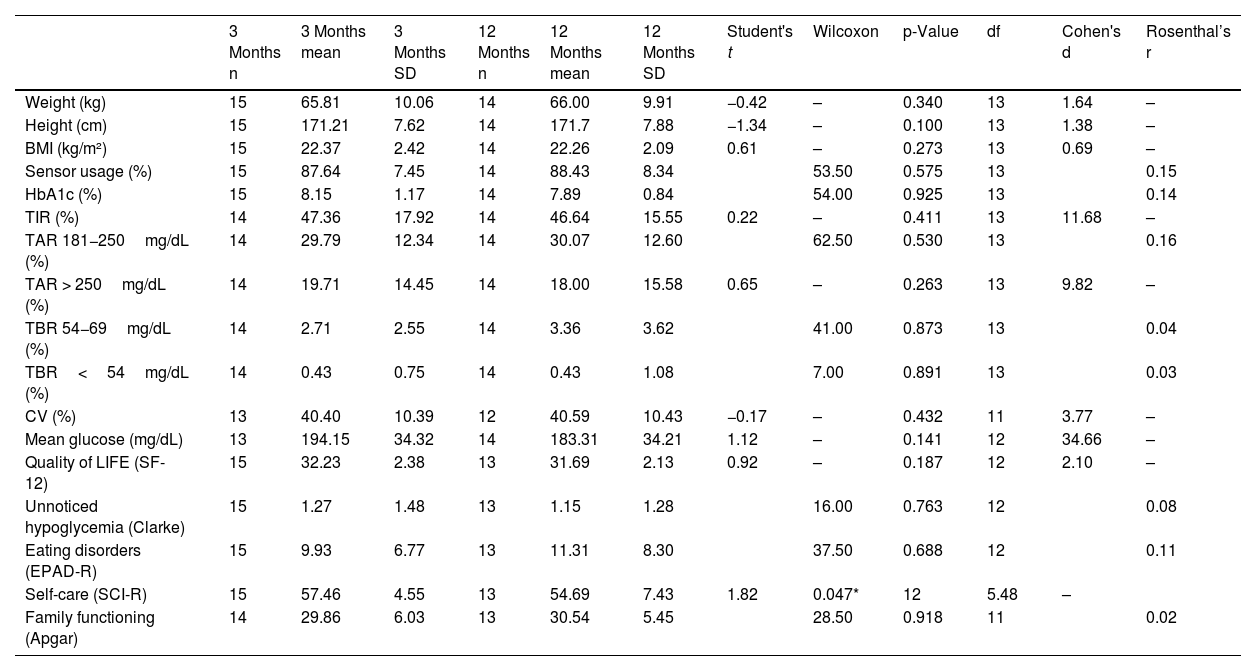
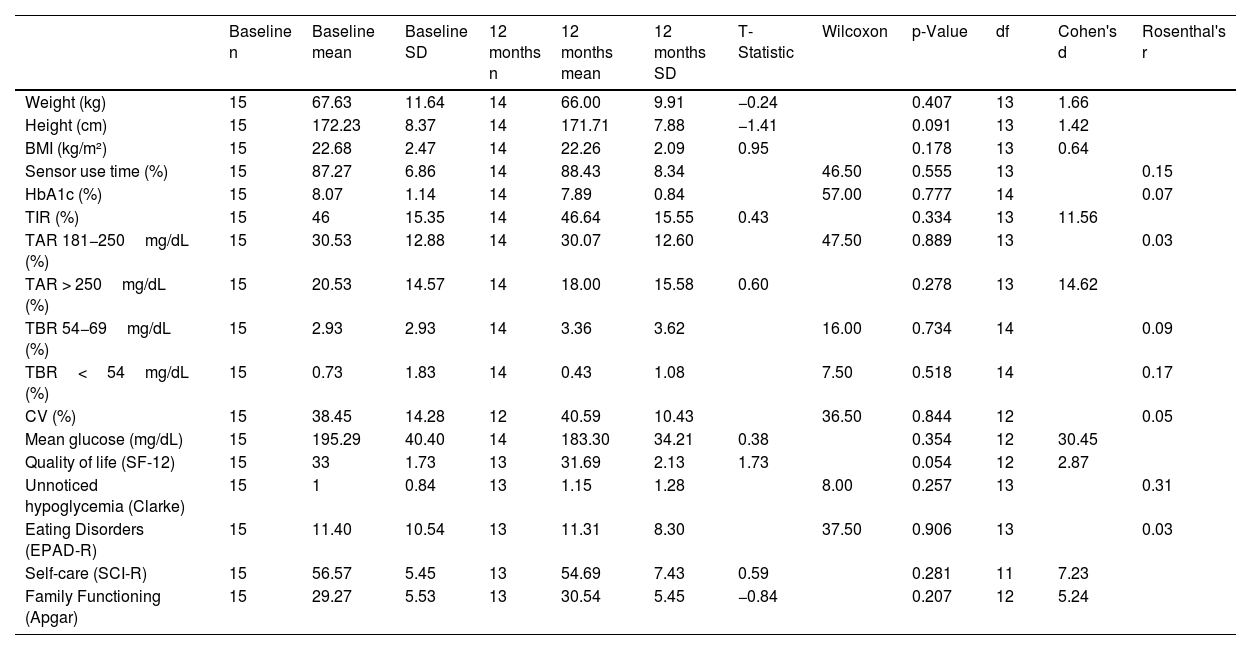
The difference in glycemic control and emotional well-being values obtained at 3 and 12 months from the start of the transition was compared. Only self-care achieved a statistically significant reduction (p=0.047), though it was close to being insignificant (Table 3). The same phenomenon observed in the previous time interval was also noted in the effect size for mean glucose—which was 34.66—vs the minimum value of 0.02 achieved by family function (Table 3). Differences between baseline and 12 months were also analyzed (Table 4).
Comparison of glycemic control and emotional outcomes at 3 months and 12 months.
| 3 Months n | 3 Months mean | 3 Months SD | 12 Months n | 12 Months mean | 12 Months SD | Student's t | Wilcoxon | p-Value | df | Cohen's d | Rosenthal’s r | |
|---|---|---|---|---|---|---|---|---|---|---|---|---|
| Weight (kg) | 15 | 65.81 | 10.06 | 14 | 66.00 | 9.91 | −0.42 | – | 0.340 | 13 | 1.64 | – |
| Height (cm) | 15 | 171.21 | 7.62 | 14 | 171.7 | 7.88 | −1.34 | – | 0.100 | 13 | 1.38 | – |
| BMI (kg/m²) | 15 | 22.37 | 2.42 | 14 | 22.26 | 2.09 | 0.61 | – | 0.273 | 13 | 0.69 | – |
| Sensor usage (%) | 15 | 87.64 | 7.45 | 14 | 88.43 | 8.34 | 53.50 | 0.575 | 13 | 0.15 | ||
| HbA1c (%) | 15 | 8.15 | 1.17 | 14 | 7.89 | 0.84 | 54.00 | 0.925 | 13 | 0.14 | ||
| TIR (%) | 14 | 47.36 | 17.92 | 14 | 46.64 | 15.55 | 0.22 | – | 0.411 | 13 | 11.68 | – |
| TAR 181−250mg/dL (%) | 14 | 29.79 | 12.34 | 14 | 30.07 | 12.60 | 62.50 | 0.530 | 13 | 0.16 | ||
| TAR > 250mg/dL (%) | 14 | 19.71 | 14.45 | 14 | 18.00 | 15.58 | 0.65 | – | 0.263 | 13 | 9.82 | – |
| TBR 54−69mg/dL (%) | 14 | 2.71 | 2.55 | 14 | 3.36 | 3.62 | 41.00 | 0.873 | 13 | 0.04 | ||
| TBR<54mg/dL (%) | 14 | 0.43 | 0.75 | 14 | 0.43 | 1.08 | 7.00 | 0.891 | 13 | 0.03 | ||
| CV (%) | 13 | 40.40 | 10.39 | 12 | 40.59 | 10.43 | −0.17 | – | 0.432 | 11 | 3.77 | – |
| Mean glucose (mg/dL) | 13 | 194.15 | 34.32 | 14 | 183.31 | 34.21 | 1.12 | – | 0.141 | 12 | 34.66 | – |
| Quality of LIFE (SF-12) | 15 | 32.23 | 2.38 | 13 | 31.69 | 2.13 | 0.92 | – | 0.187 | 12 | 2.10 | – |
| Unnoticed hypoglycemia (Clarke) | 15 | 1.27 | 1.48 | 13 | 1.15 | 1.28 | 16.00 | 0.763 | 12 | 0.08 | ||
| Eating disorders (EPAD-R) | 15 | 9.93 | 6.77 | 13 | 11.31 | 8.30 | 37.50 | 0.688 | 12 | 0.11 | ||
| Self-care (SCI-R) | 15 | 57.46 | 4.55 | 13 | 54.69 | 7.43 | 1.82 | 0.047* | 12 | 5.48 | – | |
| Family functioning (Apgar) | 14 | 29.86 | 6.03 | 13 | 30.54 | 5.45 | 28.50 | 0.918 | 11 | 0.02 |
CV: coefficient of variation; SD: standard deviation; df: degrees of freedom; HbA1c: glycated hemoglobin; BMI: body mass index.
Comparison of glycemic control and emotional results at baseline and 12 months.
| Baseline n | Baseline mean | Baseline SD | 12 months n | 12 months mean | 12 months SD | T-Statistic | Wilcoxon | p-Value | df | Cohen's d | Rosenthal's r | |
|---|---|---|---|---|---|---|---|---|---|---|---|---|
| Weight (kg) | 15 | 67.63 | 11.64 | 14 | 66.00 | 9.91 | −0.24 | 0.407 | 13 | 1.66 | ||
| Height (cm) | 15 | 172.23 | 8.37 | 14 | 171.71 | 7.88 | −1.41 | 0.091 | 13 | 1.42 | ||
| BMI (kg/m²) | 15 | 22.68 | 2.47 | 14 | 22.26 | 2.09 | 0.95 | 0.178 | 13 | 0.64 | ||
| Sensor use time (%) | 15 | 87.27 | 6.86 | 14 | 88.43 | 8.34 | 46.50 | 0.555 | 13 | 0.15 | ||
| HbA1c (%) | 15 | 8.07 | 1.14 | 14 | 7.89 | 0.84 | 57.00 | 0.777 | 14 | 0.07 | ||
| TIR (%) | 15 | 46 | 15.35 | 14 | 46.64 | 15.55 | 0.43 | 0.334 | 13 | 11.56 | ||
| TAR 181−250mg/dL (%) | 15 | 30.53 | 12.88 | 14 | 30.07 | 12.60 | 47.50 | 0.889 | 13 | 0.03 | ||
| TAR > 250mg/dL (%) | 15 | 20.53 | 14.57 | 14 | 18.00 | 15.58 | 0.60 | 0.278 | 13 | 14.62 | ||
| TBR 54−69mg/dL (%) | 15 | 2.93 | 2.93 | 14 | 3.36 | 3.62 | 16.00 | 0.734 | 14 | 0.09 | ||
| TBR<54mg/dL (%) | 15 | 0.73 | 1.83 | 14 | 0.43 | 1.08 | 7.50 | 0.518 | 14 | 0.17 | ||
| CV (%) | 15 | 38.45 | 14.28 | 12 | 40.59 | 10.43 | 36.50 | 0.844 | 12 | 0.05 | ||
| Mean glucose (mg/dL) | 15 | 195.29 | 40.40 | 14 | 183.30 | 34.21 | 0.38 | 0.354 | 12 | 30.45 | ||
| Quality of life (SF-12) | 15 | 33 | 1.73 | 13 | 31.69 | 2.13 | 1.73 | 0.054 | 12 | 2.87 | ||
| Unnoticed hypoglycemia (Clarke) | 15 | 1 | 0.84 | 13 | 1.15 | 1.28 | 8.00 | 0.257 | 13 | 0.31 | ||
| Eating Disorders (EPAD-R) | 15 | 11.40 | 10.54 | 13 | 11.31 | 8.30 | 37.50 | 0.906 | 13 | 0.03 | ||
| Self-care (SCI-R) | 15 | 56.57 | 5.45 | 13 | 54.69 | 7.43 | 0.59 | 0.281 | 11 | 7.23 | ||
| Family Functioning (Apgar) | 15 | 29.27 | 5.53 | 13 | 30.54 | 5.45 | −0.84 | 0.207 | 12 | 5.24 |
CV: coefficient of variation; SD: standard deviation; df: degrees of freedom; HbA1c: glycated hemoglobin; BMI: body mass index; TAR: time above range; TBR: time below range; TIR: time in range.
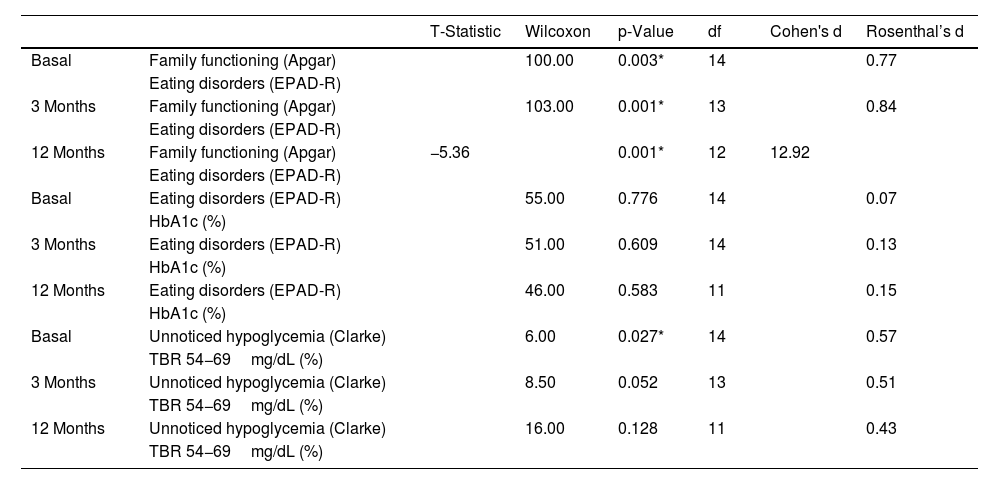
Additionally, an analysis was conducted regarding the association among family functioning, the risk of eating disorders, unnoticed hypoglycemia, HbA1c, and TBR (Table 5). A statistically significant association was found between family functioning and the risk of developing eating disorders at baseline (p=0.003), 3 months (p=0.001), and 12 months (p=0.001). However, this association was not present between the risk of developing eating disorders and HbA1c at baseline (p=0.776), 3 months (p=0.609), and 12 months (p=0.583). Regarding the relationship between unnoticed hypoglycemia and TBR 54−69mg/dL (%), a statistically significant association was observed only at baseline (p=0.027), but not at 3 (p=0.052) or 12 months (p=0.128) (Table 5).
Association between glycemic control and emotional well-being results.
| T-Statistic | Wilcoxon | p-Value | df | Cohen's d | Rosenthal’s d | ||
|---|---|---|---|---|---|---|---|
| Basal | Family functioning (Apgar) | 100.00 | 0.003* | 14 | 0.77 | ||
| Eating disorders (EPAD-R) | |||||||
| 3 Months | Family functioning (Apgar) | 103.00 | 0.001* | 13 | 0.84 | ||
| Eating disorders (EPAD-R) | |||||||
| 12 Months | Family functioning (Apgar) | −5.36 | 0.001* | 12 | 12.92 | ||
| Eating disorders (EPAD-R) | |||||||
| Basal | Eating disorders (EPAD-R) | 55.00 | 0.776 | 14 | 0.07 | ||
| HbA1c (%) | |||||||
| 3 Months | Eating disorders (EPAD-R) | 51.00 | 0.609 | 14 | 0.13 | ||
| HbA1c (%) | |||||||
| 12 Months | Eating disorders (EPAD-R) | 46.00 | 0.583 | 11 | 0.15 | ||
| HbA1c (%) | |||||||
| Basal | Unnoticed hypoglycemia (Clarke) | 6.00 | 0.027* | 14 | 0.57 | ||
| TBR 54−69mg/dL (%) | |||||||
| 3 Months | Unnoticed hypoglycemia (Clarke) | 8.50 | 0.052 | 13 | 0.51 | ||
| TBR 54−69mg/dL (%) | |||||||
| 12 Months | Unnoticed hypoglycemia (Clarke) | 16.00 | 0.128 | 11 | 0.43 | ||
| TBR 54−69mg/dL (%) | |||||||
HbA1c: glycated hemoglobin; TBR: time below range.
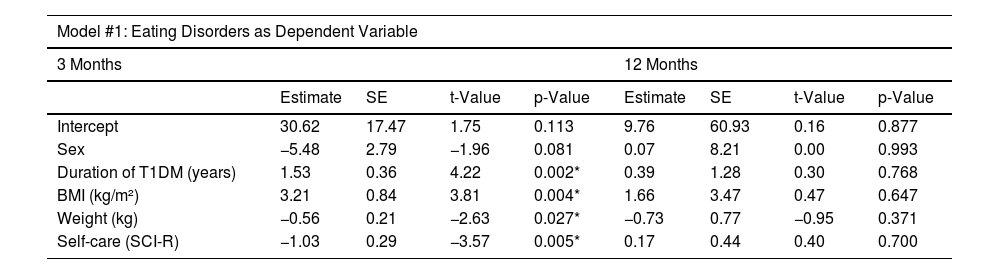
All variables in the first multivariate analysis model achieved statistical significance (p<0.05) at 3 months, except for sex (p=0.081), which remained in the model as it increased the overall significance, and family function (p>0.05), which was removed due to reducing it. In this period, the model was statistically significant (p=0.002), with an adjusted R-squared of 0.74 (Table 6). At 12 months, no statistical significance was reached in any of the mentioned variables (p>0.05), nor in the model per se (p=0.678), which had an adjusted R-squared of -0.17 (Table 6).
Multivariate linear regression models.
| Model #1: Eating Disorders as Dependent Variable | ||||||||
|---|---|---|---|---|---|---|---|---|
| 3 Months | 12 Months | |||||||
| Estimate | SE | t-Value | p-Value | Estimate | SE | t-Value | p-Value | |
| Intercept | 30.62 | 17.47 | 1.75 | 0.113 | 9.76 | 60.93 | 0.16 | 0.877 |
| Sex | −5.48 | 2.79 | −1.96 | 0.081 | 0.07 | 8.21 | 0.00 | 0.993 |
| Duration of T1DM (years) | 1.53 | 0.36 | 4.22 | 0.002* | 0.39 | 1.28 | 0.30 | 0.768 |
| BMI (kg/m²) | 3.21 | 0.84 | 3.81 | 0.004* | 1.66 | 3.47 | 0.47 | 0.647 |
| Weight (kg) | −0.56 | 0.21 | −2.63 | 0.027* | −0.73 | 0.77 | −0.95 | 0.371 |
| Self-care (SCI-R) | −1.03 | 0.29 | −3.57 | 0.005* | 0.17 | 0.44 | 0.40 | 0.700 |
| Model #2: Eating Disorders as Dependent Variable | ||||||||
|---|---|---|---|---|---|---|---|---|
| 3 Months | 12 Months | |||||||
| Estimate | SE | t-Value | p-Value | Estimate | SE | t-Value | p-Value | |
| Intercept | −15.24 | 10.01 | −0.84 | 0.459 | 41.61 | 2.11 | 19.68 | 0.032* |
| Family functioning (Apgar) | −0.40 | 0.08 | −4.56 | 0.019* | −1.20 | 0.04 | −27.30 | 0.023* |
| CV (%) | 0.09 | 0.07 | 1.30 | 0.283 | 0.36 | 0.01 | 20.82 | 0.030* |
| Eating disorders (EPAD-R) | 0.07 | 0.13 | 0.57 | 0.604 | 0.09 | 0.01 | 7.38 | 0.085 |
| Quality of life (SF-12) | −0.74 | 0.17 | −4.14 | 0.025* | −2.87 | 0.05 | −50.03 | 0.012* |
| TIR (%) | 0.43 | 0.12 | 3.60 | 0.036* | 0.59 | 0.01 | 50.11 | 0.012* |
| BMI (kg/m²) | 1.89 | 0.20 | 9.37 | 0.002* | 3.74 | 0.06 | 56.42 | 0.011* |
| Mean glucose (mg/dL) | 0.21 | 0.06 | 3.18 | 0.049* | 0.09 | 0.00 | 18.85 | 0.033* |
| TBR<54mg/dL (%) | 2.12 | 1.01 | 2.09 | 0.126 | 2.60 | 0.11 | 22.03 | 0.028* |
CV: coefficient of variation; DE: standard error; BMI: body mass index; TBR: time below range; TIR: time in range.
A statistically significant association (p<0.05) was found in all variables in model #2 at 3 months, except for the coefficient of variability (p=0.283), the risk of developing eating disorders (p=0.604), and TBR<54mg/dL (p=0.126). However, they were retained in the model because they increased its significance (p=0.015). In this period, the model had an adjusted R-squared of 0.93 (Table 6). At 12 months, a significant association was reached in all the described variables, except for the risk of developing eating disorders (p=0.08); however, it was retained in the model as it increased its significance (p=0.014). This model had an adjusted R-squared of 0.99 (Table 6).
DiscussionThis study presented a comprehensive approach to addressing the challenges associated with T1DM in adolescents during the transition from pediatric to adult care. It demonstrated the influence of a structured TPE program on maintaining variables related to glycemic control and emotional well-being over 12 months. This is comparable to findings from a different study, where 84% of people with T2DM achieved control goals (HbA1c < 7%), 88% successfully underwent chronic complication screenings, and improvements in body weight, physical activity, and disease awareness were observed.17
Of note, with the development of TPE during the hospital transition, no significant differences were found among variables measured at different time intervals, except for self-care at 12 months, suggesting the need for educational reinforcement during this timeframe, which is consistent with a different study indicating that improving self-care through diabetes education for individuals not achieving glycemic targets can lead to better HbA1c levels.18 Additionally, a significant effect size in mean glucose and TIR was noted both at 3 and 12 months, with a smaller effect size in TAR and TBR, which can be due to the educational sessions emphasizing the importance of preventing both hypo- and hyperglycemia, particularly raising awareness among adolescents about maintaining glycemic levels within target ranges.
The significant association between family functioning and the risk of developing eating disorders across all time intervals highlights the importance of family support during the transition process for adolescents with T1DM.19 However, no statistical significance was found between family functioning and HbA1c at any time interval, which may be indicative that, despite the risk of developing an eating disorder, this risk has not yet produced physical effects related to increased blood glucose levels, emphasizing the importance of hospital transition as a key factor in monitoring adolescents with T1DM.20
Of note, the significant association between unawareness of hypoglycemia and TBR 54–69mg/dL only at baseline, not at 3 or 12 months, may suggest a potential effect of the transition on the awareness of hypoglycemia alarms in monitoring sensors, likely preventing unnoticed hypoglycemia.21
On the other hand, the multivariate analysis clarified variables regulating aspects where significant differences over time were found, such as self-care. This showed significant associations with family functioning, quality of life, BMI, mean glucose, and TBR<54mg/dL. These findings emphasize the relevance of the family environment for health and well-being.22 Based on these findings, the relevance of the family environment to each individuals' health and well-being should be emphasized,22 suggesting that interventions aimed at improving family functioning could be effective in enhancing self-care and reducing the risk of eating disorders.
The study has several strengths, such as the duration of the follow-up, the coordination of the educational intervention by an APN-CDT-specialized nurse educator, and the use of multivariate analyses, which helped reduce the risk of potential confounding bias in the study results.23 However, some limitations are highlighted, such as the small sample size and the lack of randomization, which occurred due to the limited number of adolescents transitioning within the hospital. Of note, the absence of an analysis of variables related to physical exercise as it would have been relevant given that another study showed that most adolescents with T1DM did not meet the recommendations for an active lifestyle.24 Of note, the lack of comparison of outcomes by sex, as it was not possible due to the disparity in the proportion of men and women. Finally, it should be mentioned that the SF-12 and SCI-R tools are validated for adult populations, although the adolescents were able to complete them without adult assistance.
ConclusionsThe importance of adopting a comprehensive, structured approach to managing T1DM during the transition of adolescents from pediatric to adult care has been highlighted. Through a TPE program, participants maintained levels of glycemic control and emotional well-being during hospital transition.
Further research is needed to explore the impact of such programs on glycemic control, emotional well-being, and long-term effects. Personalized, multidisciplinary strategies that strengthen family dynamics should also be added to TPE programs to improve health outcomes, prevent eating disorders, and facilitate hospital transitions for adolescents with T1DM.
