


To report the anthropometric characteristics and body composition and to analyze the potential sex-based differences in Spanish schoolchildren and adolescents living in Granada and Ceuta. To estimate body fat percentage using regression equations and bioelectrical impedance to check for sex differences. An additional objective was to see whether the body fat percentages obtained by these two methods were similar.
MethodsA cross-sectional study including 1518 children and adolescents (aged 9–16) from 12 primary and secondary schools in Ceuta and Granada. The nutritional status of the subjects was assessed and their body fat percentage was calculated.
ResultsThere was a strong sexual dimorphism, with higher prevalence rates of overweight in boys and obesity in girls. Girls had higher mean body fat levels regardless of the measuring method used (p<0.001). Correlation between bioelectrical impedance analysis and regression equations was high (r=0.830), as was the internal correlation coefficient (ICC>0.75). A Bland–Altman comparison showed a high agreement between bioelectrical impedance and Behnke and Lohman equations.
ConclusionsSpecific equations considering subject sex and age should be used to estimate body density. Regardless of the method used, girls had higher body fat percentages. The Behnke and Lohman equations, combined with BIA, were found to be the most accurate methods for measuring body density in the study population.
Describir características antropométricas, composición corporal y verificar posibles diferencias entre sexos en escolares de Granada y la Ciudad Autónoma de Ceuta. Estimar el porcentaje de grasa corporal mediante ecuaciones de regresión e impedanciometría bioeléctrica, verificar posibles diferencias entre sexos. Comparar valores de porcentaje de grasa corporal estimados por ambos métodos para verificar su similitud.
MétodosEstudio transversal sobre 1.518 escolares (9-16 años), pertencientes a doce centros educativos de Ceuta y Granada. Se realizó una valoración del estado nutricional mediante antropometría e impedanciometría bioeléctrica, se procedió al cálculo del porcentaje de grasa corporal.
ResultadosSe observa un marcado dimorfismo sexual, con mayor prevalencia de sobrepeso entre chicos y de obesidad en chicas. Las chicas presentan valores medios de grasa corporal superiores, con independencia del método de estimación utilizado (p < 0,001). La correlación entre impedanciometría bioeléctrica y las ecuaciones de regresión fue elevada (r = 0,830), al igual que el coeficiente de correlación interna (CCI> 0,75). La prueba de Bland-Altman muestra una elevada concordancia entre impedanciometría bioeléctrica y las ecuaciones de Behnke y Lohman.
ConclusionesResulta conveniente utilizar ecuaciones específicas para el cálculo de la densidad corporal que contemplen el sexo y la edad de los sujetos. Independientemente del método utilizado para calcular el porcentaje de grasa corporal, las chicas poseen valores de grasa corporal más elevados. Sugerimos utilizar las ecuaciones de Behnke y Lohman junto a la BIA como métodos preferentes en las poblaciones estudiadas.
Analysis of body composition is an essential part of the assessment of nutritional status.1 However, the obtainment of precise results in the adult population is complex, since a constant body composition cannot be assumed.2 Among the safest and most reliable methods for analyzing body composition, mention must be made of neutron activation analysis, magnetic resonance (MR), hydrostatic weighing, plethysmography, dual-energy X-ray absorptiometry (DEXA), anthropometry and bioelectrical impedance analysis (BIA).3,4 Of all these techniques, anthropometry and BIA are the least complex options for application to children and adolescents.5 In this regard, the World Health Organization (WHO)6 considers anthropometry to be a useful tool for examining changes in body composition, being applicable to large populations thanks to its noninvasive nature and low cost. In this sense, regression equations have been developed in which the combination of different anthropometric parameters and variables allows us to estimate total body fat percentage (% TBF).7 The use of these equations is limited, however, since age group-specific body density conversion formulas must be applied.8
On the other hand, BIA measures the impedance or resistance to electrical current flow through the body fluids contained fundamentally in the lean and fatty tissues. Impedance is low in lean tissue, which contains mainly intracellular fluids and electrolytes, and is high in adipose tissue – being proportional to total body water.9 In the same way as anthropometry, BIA is a rapid, portable, noninvasive and inexpensive method involving scant technical difficulty. It is also safe, since it makes use of a constant alternating current with an intensity of 800A and a frequency of 50kHz, and does not stimulate the electrically excitable tissues of the body.10 Different authors recommend the use of BIA in epidemiological studies for estimating % TBF.11,12
Since predictive regression equations and BIA are analytical methods based on very different technical principles, some investigators advise caution when interpreting and comparing the results obtained.13–15 On the other hand, since the regression equations have been developed from different populations, interpretation of the results is complex. Considering the above, the present study was carried out to describe the anthropometric characteristics referred to body composition and to explore possible differences between the genders in a population of school children and adolescents in the city of Granada and the Autonomous City of Ceuta (Spain). In turn, % TBF was estimated using regression equations and BIA, with the evaluation of possible gender differences. Lastly, comparisons were made of the % TBF values using BIA versus each regression equation, with a view to assessing their similarity.
Study sample and methodologyStudy design and populationA descriptive, cross-sectional observational study was made during the academic years 2014–2015 and 2015–2016, in a population of 1518 school children and adolescents between 9 and 16 years of age (mean 11.9±1.98), pertaining to 12 educational centers in the cities of Ceuta and Granada. A concerted primary and secondary education center participated in the Autonomous City of Ceuta. In Granada, 6 nursery and primary education center and 5 secondary education institutes (all of a public nature) participated in the study.
All the pupils were of Caucasian origin and belonged to urban middle-class families. The following inclusion criteria were applied: Spanish boys and girls without established endocrine-metabolic disease, willingness to cooperate, and with authorization and written consent to participation from the parents and/or legal tutors. Failure to meet these criteria precluded participation in the study.
Anthropometric and body composition measuresAnthropometric evaluation of nutritional status was carried out according to the guidelines of the International Society for the Advancement of Kinanthropometry.16 All the variables were recorded by a single qualified evaluator with extensive experience (level II of the International Society for the Advancement of Kinanthropometry). Each educational center supplied the research team with a classroom for conducting all the measurements, with preservation of the intimacy of the participants. All measurements were made under fasting conditions and early in the morning (8:30a.m.). The anthropometric parameters studied were body weight, height and body mass index (BMI), calculated from the former two parameters. In addition, we evaluated the skin folds at tricipital, bicipital, subscapular, suprailiac, thigh and calf level, and the waist and hip circumferences. Height (in cm) was recorded with a measuring rod (Seca®, model 214), with a precision of 1mm. In order to carry out the measurements, the pupil stood with the back of the trunk and pelvis in contact with the vertical arm of the measuring rod, and with the head in the Frankfort plane. After establishing the correct position, the mobile horizontal arm of the measuring rod was positioned over the vertex.17 Body weight (in kg) in turn was measured on two occasions with the pupil wearing light clothing, and without shoes or metallic objects, using a body composition analyzer (TANITA BC-418MA®). Body mass index was calculated from the weight and height measurements. The subjects were stratified into low weight, normal weight, overweight and obese categories using the BMI percentiles established by Cole et al. as cut-off points.18 The skin folds (mm) were measured using Holtain® skin fold calipers with a precision of 0.1–0.2mm, exerting a constant pressure of (10g/mm2). The waist and hip perimeters were recorded using a flexible and non-elastic metric tape (Seca®) with a precision of 1mm.
The body fat percentage (% TBF) was determined using two methods. We first used BIA with the TANITA BC-418MA body composition analyzer®. This was followed by the determination of body density based on the regression equations of Brook19 and Durnin and Rahaman,20 described below:
Brook equation
1–11 years.
Boys: D=1.690–0.0788log(∑tricipital, bicipital, subscapular, suprailiac folds).
Girls: D=1.2063–0.0999log(∑tricipital, bicipital, subscapular, suprailiac folds).
Durnin and Rahaman equation
12–16 years.
Boys: D=1.1533–0.0643log(∑tricipital, bicipital, subscapular, suprailiac folds).
Girls: D=1.1369–0.0598log(∑tricipital, bicipital, subscapular, suprailiac folds).
After calculating body density, we estimated % TBF using the regression equations of Siri,21 Brozeck et al.,22 Behnke et al.23 and Lohman et al.24
Siri % fat=[(4.95/D)−4.50]×100.
Brozeck et al. % fat=[(4.57/D)−4.142]×100.
Behnke et al. % fat=[(5.053/D)−4.614]×100.
Lohman et al. % fat=[(5.30/D)−4.89]×100.
In order to determine the quality of the anthropometric measurements, we used a double measurement every 12 subjects for all variables: weight, height, and circumference of the relaxed arm, abdomen and mid-calf. The technical error of the measurements varied between 1% and 3%, and the intraclass reproducibility coefficient was r=0.94–0.97.
Ethical considerationsThe study was conducted in compliance with the principles of the Declaration of Helsinki referred to research in human subjects. The parents or tutors received an explanation of the study objectives, and all the included pupils presented the corresponding signed informed consent document. Likewise, a favorable opinion on the study was obtained from the Research Ethics Committee of the University of Granada (Ref. code 841). The research team processed the information with preservation of subject anonymity and ensuring data confidentiality at all times.
Statistical analysisFollowing the descriptive study of the direct and derived measurements, normal distribution of the data was assessed using the Kolmogorov–Smirnov test. With regard to the inferential statistical analysis, the Student t-test was used to compare means of continuous variables with a factor (gender), while the Chi-squared test was used to compare categorical variables. Agreement between the results obtained with BIA and the regression equations was explored by Pearson correlation analysis, with calculation of the intraclass correlation coefficient (ICC). Bland–Altman plots were also generated. The data were analyzed using the SPSS version 22.0 statistical package (SPSS Inc., Chicago, IL, USA). Statistical significance was considered for p≤0.05.
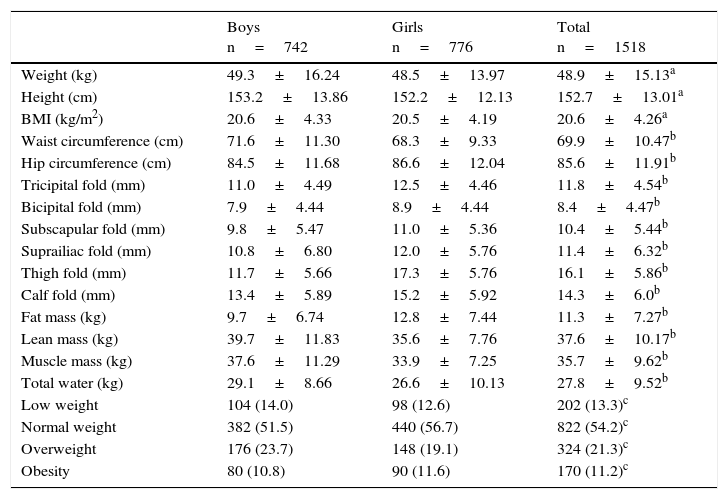
ResultsIn relation to the anthropometric and body composition characteristics (Table 1), statistically significant differences (p<0.001) in body perimeters were observed between males and females. Specifically, boys showed greater waist circumferences than the girls, who in turn presented greater hip circumferences. The skin fold analysis likewise revealed statistically significant differences (p<0.001) between genders, with girls yielding greater mean values for all the skin folds studied. On the other hand, boys presented higher values corresponding to lean mass, muscle mass and total water content. With regard to the study of nutritional status based on BMI, no statistically significant differences (p>0.05) were recorded between males and females, though boys showed a comparatively higher prevalence of overweight (23.7%) and girls presented a higher frequency of obesity (11.6%).
Anthropometric and body composition characteristics according to gender.
| Boys n=742 | Girls n=776 | Total n=1518 | |
|---|---|---|---|
| Weight (kg) | 49.3±16.24 | 48.5±13.97 | 48.9±15.13a |
| Height (cm) | 153.2±13.86 | 152.2±12.13 | 152.7±13.01a |
| BMI (kg/m2) | 20.6±4.33 | 20.5±4.19 | 20.6±4.26a |
| Waist circumference (cm) | 71.6±11.30 | 68.3±9.33 | 69.9±10.47b |
| Hip circumference (cm) | 84.5±11.68 | 86.6±12.04 | 85.6±11.91b |
| Tricipital fold (mm) | 11.0±4.49 | 12.5±4.46 | 11.8±4.54b |
| Bicipital fold (mm) | 7.9±4.44 | 8.9±4.44 | 8.4±4.47b |
| Subscapular fold (mm) | 9.8±5.47 | 11.0±5.36 | 10.4±5.44b |
| Suprailiac fold (mm) | 10.8±6.80 | 12.0±5.76 | 11.4±6.32b |
| Thigh fold (mm) | 11.7±5.66 | 17.3±5.76 | 16.1±5.86b |
| Calf fold (mm) | 13.4±5.89 | 15.2±5.92 | 14.3±6.0b |
| Fat mass (kg) | 9.7±6.74 | 12.8±7.44 | 11.3±7.27b |
| Lean mass (kg) | 39.7±11.83 | 35.6±7.76 | 37.6±10.17b |
| Muscle mass (kg) | 37.6±11.29 | 33.9±7.25 | 35.7±9.62b |
| Total water (kg) | 29.1±8.66 | 26.6±10.13 | 27.8±9.52b |
| Low weight | 104 (14.0) | 98 (12.6) | 202 (13.3)c |
| Normal weight | 382 (51.5) | 440 (56.7) | 822 (54.2)c |
| Overweight | 176 (23.7) | 148 (19.1) | 324 (21.3)c |
| Obesity | 80 (10.8) | 90 (11.6) | 170 (11.2)c |
Data reported as the mean±standard deviation and absolute (relative) frequency.
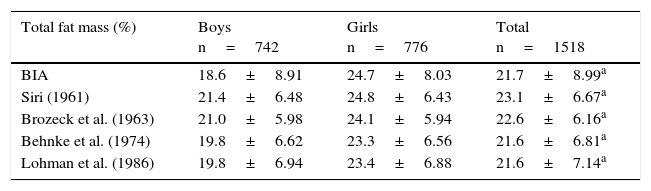
Based on the body density values, Table 2 shows % TBF calculated using BIA, together with % TBF obtained from the regression equations, according to gender. As can be seen, statistically significant differences (p<0.001) were recorded between males and females regardless of the method used. As expected, % TBF was greater among the girls.
Body fat percentage determined by BIA and the equations of Siri, Brozeck, Behnke and Lohman according to gender.
| Total fat mass (%) | Boys n=742 | Girls n=776 | Total n=1518 |
|---|---|---|---|
| BIA | 18.6±8.91 | 24.7±8.03 | 21.7±8.99a |
| Siri (1961) | 21.4±6.48 | 24.8±6.43 | 23.1±6.67a |
| Brozeck et al. (1963) | 21.0±5.98 | 24.1±5.94 | 22.6±6.16a |
| Behnke et al. (1974) | 19.8±6.62 | 23.3±6.56 | 21.6±6.81a |
| Lohman et al. (1986) | 19.8±6.94 | 23.4±6.88 | 21.6±7.14a |
Data reported as the mean±standard deviation.
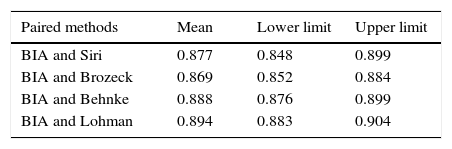
The Pearson correlation coefficient between BIA and each of the regression equations proved positive (r=0.830) and highly significant (p<0.001). With regard to the ICC (Table 3), all the values were >0.75, indicating strong agreement between the two methods compared.
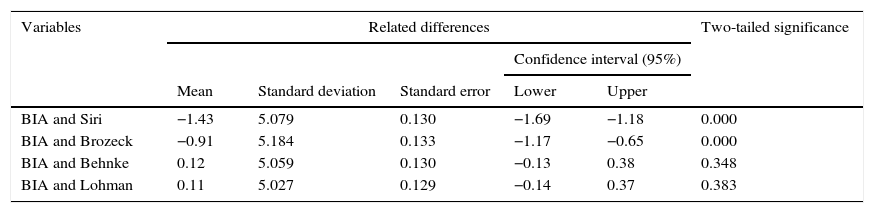
Due to the limitations of the Pearson correlation coefficient and the ICC, we used the Bland–Altman test to establish the agreement between % TBF determined by BIA and from the regression equations when p>0.05. On comparing % TBF obtained via BIA with the values calculated from the regression equations (Table 4), no statistically significant differences were obtained for the Behnke (p=0.348) and Lohman equations (p=0.383)—the latter being specific for children and adolescents. The Bland–Altman test was therefore only performed with these two equations. Figs. 1 and 2 reflect the strong agreement between the BIA method and the regression equations of Behnke and Lohman – the latter being specific for children and adolescents, as indicated above.
Contrast between BIA and the equations of Siri, Brozeck, Behnke and Lohman.
| Variables | Related differences | Two-tailed significance | ||||
|---|---|---|---|---|---|---|
| Confidence interval (95%) | ||||||
| Mean | Standard deviation | Standard error | Lower | Upper | ||
| BIA and Siri | −1.43 | 5.079 | 0.130 | −1.69 | −1.18 | 0.000 |
| BIA and Brozeck | −0.91 | 5.184 | 0.133 | −1.17 | −0.65 | 0.000 |
| BIA and Behnke | 0.12 | 5.059 | 0.130 | −0.13 | 0.38 | 0.348 |
| BIA and Lohman | 0.11 | 5.027 | 0.129 | −0.14 | 0.37 | 0.383 |
.")
.")
The results obtained reveal significant differences between males and females in relation to the anthropometric and body composition characteristics—specifically, in body perimeters, skin folds, and in all the body composition parameters studied. With regard to the waist and hip perimeters, emphasis must be placed on their importance as indicators of adipose tissue distribution among the school children and adolescents studied. In this regard, the boys showed a greater mean waist circumference than the girls, who in turn presented a greater mean hip circumference. This once again highlights the gender differences inherent to the human species.17
The results obtained in the skin fold measurements of the body extremities reveal marked sexual dimorphism. This dimorphism manifests in the form of higher subcutaneous fat values in girls compared with boys. In the concrete case of the tricipital fold, which is important as a parameter for estimating the fat and protein components,25 differences were recorded between the genders, with higher values among girls. These results are consistent with those obtained in other studies involving Spanish school populations.26 With regard to evaluation of the skin folds at trunk level, fat accumulation was likewise seen to be greater in girls than in boys. These findings are in agreement with those of other authors such as Sánchez-Andrés27 and Martínez et al.28
With regard to BMI, and according to the BMI percentiles used to define overweight and obesity established by Cole et al.,18 the prevalence of overweight was seen to be higher in boys (23.7%), while obesity was more frequent in girls (11.6%). These results are similar to those published by González García et al.29 among Spanish school children from Cuenca and Ciudad Real, where obesity was likewise more prevalent among girls. In contrast, our data differ from those obtained by González-Jiménez et al.,26 who in their study of school children in the province of Granada found a higher prevalence of both overweight and obesity among girls. In any case, these data justify the need for more in-depth studies on the habits and lifestyles of our school population, which is probably characterized by an altered energy balance secondary to unhealthy eating habits or an excessively sedentary lifestyle.30,31
The anthropometric variables analyzed showed low technical error in the within-evaluator measurements—ranging between 1% and 3%—and great reproducibility (0.94–0.97), consistent with the findings of other studies.32,33 According to Goto and Mascie-Taylor,34 control of the quality of anthropometric measurements is a prerequisite, affording better interpretation of the findings and therefore greater precision and reproducibility of the results, especially when intending to use anthropometric variables to predict % TBF in school populations.
With regard to the two indirect procedures employed to calculate % TBF, i.e., using BIA and by means of anthropometric regression equations, the results obtained reflect significant gender differences, with higher values among the girls, regardless of the method used. This observation is in contrast to the results of other studies35 in which the use of BIA and regression equations revealed no sexual dimorphism in relation to total body fat. Likewise, our data differ from those of previous studies in which the comparison of BIA versus the classical reference anthropometric parameters yielded contradictory results.36 In this respect, some investigators suggest that BIA tends to overestimate % TBF, while others consider that BIA underestimates this parameter.37 The frequent differences observed between these two methods could moreover also be inherent to their use and to the algorithms employed to calculate body composition, as well as to inter-individual variations inherent to participant gender.38 This situation could be explained by methodological differences in the estimation of body density.39 In our study we used different equations19,20 considering gender and age range, thereby allowing a precise estimation of body density. It is therefore advisable to use specific equations contemplating subject age and gender in the case of children and adolescents.
With regard to the mean % TBF values obtained with BIA and each of the regression equations used, BIA and the equations of Behnke et al.23 and Lohman et al.24 afforded similar mean values for both sexes. In turn, in our study the equations of Siri21 and Brozeck et al.22 seemed to slightly overestimate % TBF among boys and girls. These results coincide with other previous studies40–42 in which the authors concluded that the regression equations of Siri21 and Brozeck et al.22 systematically overestimate % TBF in children and adolescents by 3–5%. Having confirmed agreement based on the Pearson correlation coefficient, ICC and Bland–Altman test, our results suggest the advisability of using the equations of Behnke et al.23 and Lohman et al.24 in populations of children and adolescents similar to our own.
As limitations of this study, mention must be made of the use of only four regression equations and a single bioimpedance measurement model. On the other hand, our study only included Caucasian subjects—a fact that requires some caution when interpreting the results.
In conclusion, the results obtained reflect the existence of marked sexual dimorphism, with a higher prevalence of overweight in boys, while obesity was seen to be more frequent in girls. In calculating body density, it is advisable to use specific equations contemplating subject age and gender. Regardless of the method used to calculate % TBF, girls are seen to have higher body fat values. Lastly, on the basis of the results obtained, we suggest using the equations of Behnke and Lohman, together with BIA, as preferential methods in the populations studied in Granada and the Autonomous City of Ceuta.
Conflicts of interestThe authors state that they have no conflicts of interest.
Thanks are due to the educational centers, the parent and/or tutors, and to the participating pupils for their collaboration in the conduction of this study.
Please cite this article as: Tovar-Galvez MI, González-Jiménez E, Martí-García C, Schmidt-RioValle J. Composición corporal en escolares: comparación entre métodos antropométricos simples e impedancia bioeléctrica. Endocrinol Diabetes Nutr. 2017;64:424–431.
