


Presence of metabolic syndrome (MS) in patients with type 2 diabetes mellitus (T2DM) involves an increased risk of cardiovascular disease and death. Markers such as ApoB/ApoA1 and non-HDL-cholesterol/HDL-cholesterol ratios have been used to predict this risk with conflicting results. The study objective was to establish the relationship between the apoB/apoA1 and non-HDL-cholesterol/HDL-cholesterol ratios and MS in T2DM patients from a Madrid (Spain) district.
Patients and methodsOne hundred patients with T2DM who attended University Hospital Infanta Leonor (Vallecas, Madrid, Spain) between January 2014 and June 2017 were enrolled. A blood sample was taken every 6 months from all patients to measure the different lipid parameters and to calculate ApoB/ApoA1 and non-HDL-cholesterol/HDL-cholesterol ratios. A Mann–Whitney's U test to compare means and a Spearman's correlation test for correlations between variables were used, and a multivariate regression analysis was performed to determine the association between MS and the ApoB/ApoA1 and non-HDL-cholesterol/HDL-cholesterol ratios. Values of p<0.05 were considered significant.
ResultsAssociations were found between MS and ApoA1 (R2=0.164, p=0.028), ApoB/ApoA1 (R2=0.187, p=0.001), and non-HDL-cholesterol/HDL-cholesterol (R2= 0.269, p=0.0001) ratios and, in women with MS, between ApoB/ApoA1 ratio and ischemic cardiomyopathy (IC) (R2=0.160, p=0.032). Associations remained after adjusting for comorbidities and risk factors.
ConclusionsIn the T2DM patients studied, MS was independently associated to ApoA1 and the ApoB/ApoA1 and non-HDL-cholesterol/HDL-cholesterol ratios. Both ratios were better predictors of MS in T2DM subjects that its components alone. The ApoB/ApoA1 ratio could be used as a cardiovascular risk marker in women with MS.
La presencia del síndrome metabólico (MetS) en pacientes con diabetes mellitus tipo 2 (T2DM) conlleva mayor riesgo de enfermedad cardiovascular y muerte. Se han utilizado marcadores para predecir este riesgo, como los índices ApoB/ApoA1 y no-HDL-C/HDL-C, pero con resultados controvertidos. El objetivo ha sido determinar las relaciones entre los índices ApoB/ApoA1 y no-HDL-C/HDL-C y el MetS en pacientes con T2DM de un distrito de Madrid, España.
Pacientes y métodosSe reclutaron 100 pacientes con T2DM del Hospital Universitario Infanta Leonor (distrito de Vallecas, Madrid). A todos, entre enero de 2014 y junio de 2017, se les determinaron cada 6 meses los diferentes parámetros lipídicos, calculándose los índices ApoB/ApoA1 y no-HDL-C/HDL-C. De cada parámetro se realizó una media de 4-5 determinaciones. Se utilizó la U de Mann-Whitney para las comparaciones entre medias, la correlación de Spearman para las relaciones entre variables y un análisis de regresión multivariable para determinar la asociación entre el MetS y los índices ApoB/ApoA1 y no-HDL-C/HDL-C. Una p<0,05 fue significativa.
ResultadosSe han observado asociaciones entre MetS y ApoA1 (R2=0,164; p=0,028), ApoB/ApoA1 (R2=0,187; p=0,001) y no-HDL-C/HDL-C (R2=0,269; p=0,0001); y en mujeres con MetS, entre ApoB/ApoA1 y cardiomiopatía isquémica (IC) (R2=0,160; p=0,032), que permanecen después de ajustar las comorbilidades y los factores de riesgo.
ConclusionesEn los pacientes con T2DM estudiados, el MetS se asocia de forma independiente con ApoA1, ApoB/ApoA1 y con no-HDL-C/HDL-C. Ambos índices son mejores predictores de MetS que sus componentes por separado. El índice ApoB/ApoA1 podría usarse como marcador de riesgo cardiovascular en mujeres con MetS.
Metabolic syndrome (MetS) is a common disease in the elderly. The age-standardized prevalence in Spain is 38.37% in men and 29.62% in women, and risk increases with age, and low education in women.1 Diagnosis criteria are: central obesity, dyslipidemia (elevated triglycerides, reduced levels of HDL-C), hypertension and insulin resistance or hyperglycemia.2 The prevalence of MetS has grown worldwide and comprises an increased risk of cardiovascular diseases,3 twice according to Manson.4
Several chronic conditions, like obesity, hypertension and diabetes, have a low-level inflammatory status.5,6 Inflammatory pathways are able to recruit a large number of cells in the arteries causing the onset, evolution and rupture of an atheromatous plaque.5 Some emerging cardiovascular risk factors like ApoB, ApoA1, high sensitivity C-reactive protein (hsCRP), ApoB/ApoA1 ratio and non-HDL-cholesterol/HDL-cholesterol ratio are related to inflammation6 and to MetS.
hsCRP is an acute inflammatory reactant that is related to inflammation in chronic diseases that occur at the onset of thrombogenesis and remains elevated during the progression of the atheromatous plaque, leading to endothelial dysfunction.7 HDL-C has anti-atherogenic, anti-apoptotic, and anti-inflammatory effects, and can prevent the oxidation of LDL-C. Also, HDL-C participates in reverse cholesterol transport, promoting cholesterol to be removed from the arteries and transported to the liver. ApoA1, the main component of HDL, plays an important role in cellular cholesterol balance. It also has a major immunity role and an anti-platelet effect.8,9
ApoB is found on the surface of atherogenic proteins such as LDL and VLDL. Many factors are needed for the genesis and development of atherosclerosis.11 The ApoB/ApoA1 ratio represents the balance of atherogenic and anti-atherogenic factors in plasma.12 All of these risk factors are involved in the components of MetS, and they can lead to cardiovascular complications, like ischemic cardiomyopathy (IC), and premature death. Mao et al.13 reported a relationship between non-HDL/HDL ratio and T2DM, as well as a non-linear relationship between ApoB/ApoA1 ratio and T2DM.13 Other studies, like Hwang et al.14 concluded that ApoB/ApoA1 was independently associated to T2DM and Sierra-Johnson et al.15 found that ApoB/ApoA1 ratio is an independent predictor of insulin resistance and should be considered for future clinical guidelines. On the other hand, Du et al.16, in the same population, concluded that ApoB/ApoA1 was not better than other lipid ratios in correlating with insulin resistance. In European population Walldius et al.17 found that ApoB/ApoA1 ratio, ApoB and ApoA1 were a highly predictive marker for cardiac risk. Further research is needed.
For detecting MetS in Chinese population the optimal cut-off values of ApoB/ApoA1 ratio were established in 0.80 for women and in 0.85 for men18 and, in another study, for detecting T2DM was 0.614 for both sexes. Therefore, in Korean population, the cut-off >0.65 in men and >0.62 in women was a marker of MetS,10 for Sweden population, the cut-off value of cardiovascular risk is 0.9 for men and 0.8 for women.17 In Korean subjects the optimal cut-off values of Non-HDL-cholesterol/HDL-cholesterol ratio for detecting MetS was established in 2.89 in women and 3.39 in men.19 The data now published have been made in other population and extrapolating these findings to other racial or ethnic population should be interpreted with caution.
The use of ApoB/ApoA1 ratio is reliable, cheap, can be measured at any time without fasting, and in the clinical setting is very convenient.13,14 Their association with MetS has been reported in the last years,18,19 but our study is the first performed in a Spanish population.
A plausible way of determining MetS and cardiovascular risk in diabetic patients is necessary. Therefore, the aim of this study was to determine the relationship between ApoB/ApoA1 ratio, non-HDL-cholesterol/HDL-cholesterol ratio and MetS in T2DM patients from Madrid.
Material and methodsStudy designRetrospective and analytical study was designed to evaluate the relationship between ApoB/ApoA1 ratio, non-HDL-cholesterol/HDL-cholesterol ratio and MetS in T2DM subjects attending routine follow-up in an outpatient clinic.
SubjectsThe study was performed at the University Hospital Infanta Leonor, a public health center, and specialized secondary referral, which provides services to the 31 urban district of Madrid, Spain (Vallecas district, 300,000 people). One hundred T2DM and high cardiovascular risk subjects who attended the clinic between January of 2014 and June of 2017 for a routine follow-up were enrolled in this study. A blood sample was taken every 6 months in all patients and an average of 4–5 values prior to analysis were performed. Diagnosis of T2DM was made according to ADA/EASD criteria20 and diagnosis of MetS was made according to definition of Modified NCEP-ATPIII (National Cholesterol Education Program's Adult Treatment Panel III).2 This study was conducted according to the Declaration of Helsinki as revised in 2013.
Laboratory analysisBlood samples were collected by venipuncture after an overnight fast. The following variables were measured in serum or plasma samples and obtained from patients records, by the following methods: HDL cholesterol by elimination/catalase, cholesterol by enzymatic, high-sensitivity CRP serum concentration by means of a turbidimetry latex high-sensitivity Kit, ferritin by turbidimetry latex, transferrin by immune-turbidimetry improved with PEG, triglycerides by GPO-trinder, LPA by immune-turbidimetry improved with latex particles, all of them using ADVIA Chemistry Systems, Siemens.21 LDL was calculated (Friedewald). ApoA1 and ApoB by immune-turbidimetry assay, Dimension Vista system, Siemens22; a minimum of one level of quality control material was analyzed with known apolipoprotein concentrations.
Normality references values for biochemical parameters are: HDL cholesterol ≥60mg/dl, cholesterol <200mg/dl, high-sensitivity CRP serum concentration 0–5.0mg/l, ferritin 10–120ng/ml for women and 20–250ng/ml for men, transferrin 250–380mg/dl for women and 215–365mg/dl for men, triglycerides <150mg/dl, ApoA1 125–215mg/dl for women and 110–205mg/dl for men, LPA 10.00–85.00mg/dl, ApoB 55–125mg/dl for women and 55–140mg/dl for men, ApoB/ApoA1 0.30–0.90 for women and 0.35–1.00 for men.21,22
Statistical analysisChi-square was used to compare discrete variables. In the descriptive analysis, continuous variables with a normal distribution were expressed as mean and standard deviation (SD) or median and percentiles (p25th/75th) for not-normally distribution variables. Median comparisons were done with the Mann–Whitney U test. Relationships between variables were measure with Spearman correlation test. Multivariate regression analysis was performed with ApoB/ApoA1 and non-HDL-cholesterol/HDL-cholesterol ratios as dependent variable (model 1) with MetS+ and age, gender, other cardiovascular risk factors (hypertension, dyslipidemia, obesity) and other characteristics (IC, use of prescribed drugs, etc.) as independent variables, after outlier identification (model 2), because de close relationship between ApoB/ApoA1 and non-HDL-cholesterol/HDL-cholesterol ratios additional analyses were performed. All statistical analyses were performed using SPSS for Windows statistical program (version 21.0, Chicago, SPSS Inc.).23 A level of p<0.05 was considered statistically significant with 2-sided p values.
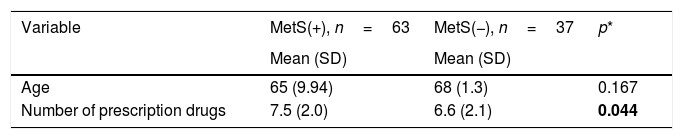
ResultsBaseline characteristics of the study population are presented in Table 1. Our study sample consisted in 100 T2DM patients, 63 of them had MetS. The mean (SD) age for subjects without MetS was 68 (11.30) years old, 62% were male, and 23% had previous IC; and for subjects with MetS was 68 (9.94) years old; 66% were male, and 22% had previous IC. In both groups is not frequent the presence of T2DM complications. Marginal difference for hsCRP is observed (p=0.048). MetS patients have a higher intake number of prescription drugs (p=0.044) and higher systolic blood pressure (p=0.003). IC is more frequent in the MetS group, but is not significant.
Characteristics of study population stratified by MetS.
| Variable | MetS(+), n=63 | MetS(−), n=37 | p* |
|---|---|---|---|
| Mean (SD) | Mean (SD) | ||
| Age | 65 (9.94) | 68 (1.3) | 0.167 |
| Number of prescription drugs | 7.5 (2.0) | 6.6 (2.1) | 0.044 |
| Variable | n (%) | n (%) | p* |
|---|---|---|---|
| Gender (M/F) | 42 (66)/21 (44) | 23 (62)/14 (38) | 0.538 |
| IC | 15 (23) | 8 (22) | 0.835 |
| Hypertension | 52 (83) | 28 (76) | 0.508 |
| Dyslipidemia | 58 (92) | 31 (83.7) | 0.308 |
| Obesity | 42 (66) | 8 (21) | 0.0001 |
| Retinopathy | 5 (8) | 1 (3) | 0.298 |
| Polyneuropathy | 1 (1.6) | 1 (2) | 0.447 |
| CRF | 2 (3) | 0 | 0.648 |
| Insulin | 39 (61) | 21 (57) | 0.682 |
| Hypoglycemic drugs | 57 (89) | 32 (87) | 0.701 |
| Antihypertensive drugs | 54 (90) | 30(85) | 0.671 |
| Hypolipidemic drugs | 62 (98) | 33 (89) | 0.630 |
| Antiplatelet agents | 31 (49) | 15 (40) | 0.445 |
| Variable | Median (p25th/75th) | Median (p25th/75th) | p* |
|---|---|---|---|
| Evolution of T2DM (years) | 14.5 (10/24.50) | 18.0 (10/24) | 0.589 |
| Glomerular filtration (ml/min/1.73m2) | 76.13 (63.20/86.05) | 82.89 (69.24/88.69) | 0.106 |
| HbA1c (%) | 7.13 (6.81/7.91) | 7.00 (6.74/7.6) | 0.203 |
| Systolic blood pressure (mmHg) | 140.00 (129.0/150.0) | 124.00 (115.0/145.0) | 0.003 |
| Diastolic blood pressure (mmHg) | 70.00 (62.25/82.0) | 68.00 (60.5/74.5) | 0.173 |
| Cholesterol (mg/dl) | 150.00 (134.25/174.0) | 155.00 (137.0/168.0) | 0.808 |
| HDL-C (mg/dl) | 38.55 (33.40/42.23) | 48.60 (42.2/54.5) | 0.0001 |
| LDL-C (mg/dl) | 81.20 (61.80/98.73) | 79.20 (66.6/95.6) | 0.899 |
| Triglycerides (mg/dl) | 157.9 (112.25/193.17) | 89.8 (114.0/60.0) | 0.0001 |
| Lipoprotein A (mg/dl) | 23.98 (9.65/58.38) | 26.07 (14.62/68.77) | 0.536 |
| ApoA1 (mg/dl) | 132.7 (121.47/142.95) | 143.7 (136.40/160.05) | 0.0001 |
| ApoB (mg/dl) | 85.2 (70.85/98.12) | 74.6 (63.85/89.55) | 0.022 |
| ApoB/ApoA1 ratio | 0.60 (0.51/0.73) | 0.49 (0.40/0.62) | 0.0001 |
| Non-HDL-cholesterol/HDL-cholesterol ratio | 3.94 (3.49/4.35) | 2.89 (2.34/3.53) | 0.0001 |
| hsCRP (mg/l) | 3.21 (3.21/5.84) | 1.74 (0.65/3.67) | 0.043 |
| Ferritin (ng/ml) | 64.50 (23.8/116.4) | 53.00 (25.37/119.8) | 0.504 |
| Transferrin (mg/dl) | 290.80 (251.0/310.0) | 263.80 (250.2/304.9) | 0.089 |
p values statistically significant are remarked. IC: ischemic cardiomyopathy, CRF: chronic renal failure, T2DM: type 2 diabetes mellitus, HbA1c: glycated hemoglobin, HDL: high-density lipoprotein, LDL: low-density lipoprotein, hsCRP: high sensitivity C-reactive protein, ApoB: apolipoprotein B, ApoA1: apolipoprotein A1.
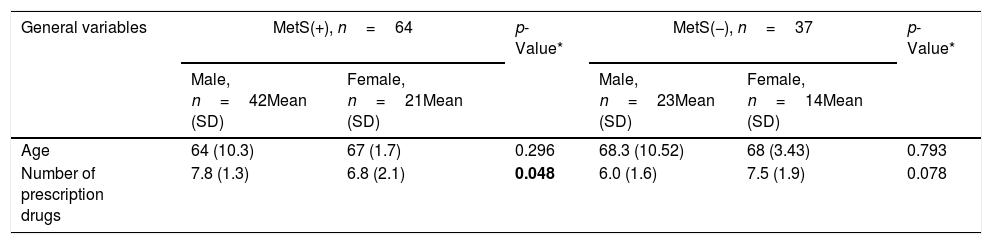
The main characteristics of subjects stratified by MetS and gender are shown in Table 2. Prevalence of IC for MetS patients is significant between genders (p=0.014). As it can be seen, HDL-C and apolipoprotein A1 have statistical differences (both p<0.0001). Levels of ApoB/ApoA1 ratio and Non-HDL-Cholesterol/HDL-Cholesterol ratio have a significant difference (p<0.0001). The differences between groups for the variable obesity, number of prescription drugs, HDL-C, triglycerides, systolic blood pressure, hsCRP and ApoB were lost after adjustment.
Characteristics of study population stratified by MetS and gender.
| General variables | MetS(+), n=64 | p-Value* | MetS(−), n=37 | p-Value* | ||
|---|---|---|---|---|---|---|
| Male, n=42Mean (SD) | Female, n=21Mean (SD) | Male, n=23Mean (SD) | Female, n=14Mean (SD) | |||
| Age | 64 (10.3) | 67 (1.7) | 0.296 | 68.3 (10.52) | 68 (3.43) | 0.793 |
| Number of prescription drugs | 7.8 (1.3) | 6.8 (2.1) | 0.048 | 6.0 (1.6) | 7.5 (1.9) | 0.078 |
| General variables | n (%) | n (%) | p-Value* | n (%) | n (%) | p-Value* |
|---|---|---|---|---|---|---|
| IC | 14 (32.5) | 1 (4.7) | 0.014 | 5 (21.7) | 3 (21.4) | 0.982 |
| Hypertension | 35 (81.3) | 17 (80) | 0.966 | 16 (69.5) | 12 (85.7) | 0.429 |
| Dyslipidemia | 38 (88.3) | 20 (9.5) | 0.380 | 19 (82.6) | 12 (85.7) | 0.380 |
| Obesity | 28 (65.1) | 21 (10.0) | 0.903 | 2 (8.7) | 6 (42.8) | 0.019 |
| Retinopathy | 3 (6.9) | 2 (9.5) | 0.724 | 1 (4.3) | 1 (7.1) | 0.482 |
| Polyneuropathy | 1 (2.3) | 0 | 0.485 | 0 | 0 | – |
| CRF | 3 (6.9) | 2 (9.5) | 0.724 | 2 (8.7) | 0 | 0.263 |
| Insulin | 26 (60.4) | 13 (61.9) | 0.912 | 11 (47.8) | 10 (71.4) | 0.166 |
| Hypoglycemic drugs | 39 (90.6) | 18 (85.7) | 0.552 | 19 (82.6) | 13 (92.8) | 0.383 |
| Antihypertensive drugs | 37 (86.0) | 17 (80.9) | 0.601 | 17 (73.9) | 13 (92.8) | 0.344 |
| Hypolipidemic drugs | 41 (95.3) | 21 (10.0) | 0.319 | 21 (91.2) | 12 (85.7) | 0.699 |
| Antiplatelet agents | 24 (55.8) | 7 (33.3) | 0.094 | 9 (39.1) | 6 (42.8) | 0.864 |
| Clinical and biochemicals | MetS(+), n=64Median (p25th/75th)p-Value* | MetS(−), n=37Median (p25th/75th) | p-Value* | |||
|---|---|---|---|---|---|---|
| Male, n=42 | Female, n=21 | Male, n=23 | Female, n=14 | |||
| Evolution of T2DM (years) | 15.0 (9.0/25.0) | 13.0 (11.50/23.5) | 0.764 | 19.0 (11.0/27.0) | 15.0 (7.75/23.0) | 0.638 |
| Glomerular filtration (ml/min/1.73m2) | 76.0 (64.3/88.1) | 77.38 (51.3/83.6) | 0.647 | 82.0 (69.0/84.5) | 87.69 (67.5/91.0) | 0.079 |
| HbA1c (%) | 7.24 (6.8/7.8) | 7.02 (6.70/8.09) | 0.726 | 6.85 (6.55/7.2) | 7.29 (6.9/7.8) | 0.026 |
| Systolic blood pressure (mmHg) | 139.00 (128.0/149.2) | 141.00 (132.5/153.0) | 0.325 | 127.00 (118.0/146.0) | 120.50 (108.5/114.5) | 0.355 |
| Diastolic blood pressure (mmHg) | 71.00 (63.0/85.0) | 68.00 (62.0/80.0) | 0.470 | 69.00 (61.0/77.0) | 67.00 (60.00/71.0) | 0.638 |
| Cholesterol (mg/dl) | 149.00 (134.0/173.0) | 153.00 (135.0/176.5) | 0.582 | 148.00 (122.0/158.0) | 165.00 (149.2/179.0) | 0.024 |
| HDL-C (mg/dl) | 36.20 (32.0/40.6) | 42.00 (39.4/48.5) | 0.0001 | 45.00 (41.2/51.60) | 51.75 (47.8/69.2) | 0.023 |
| LDL-C (mg/dl) | 76.00 (59.8/99.2) | 83.20 (74.3/94.9) | 0.607 | 79.20 (60.6/93.0) | 81.10 (72.5/1117.0) | 0.398 |
| Triglycerides (mg/dl) | 158.00 (116.4/193.4) | 157.80 (111.4/195.1) | 0.742 | 88.60 (75.0/114.2) | 89.90 (72.5/117.0) | 0.863 |
| Lipoprotein A (mg/dl) | 22.78 (9.9/58.5) | 23.98 (9.9/65.7) | 0.843 | 18.07 (9.90/58.97) | 32.18 (16.7/81.4) | 0.153 |
| ApoA1 (mg/dl) | 127.43 (115.5/136.6) | 143.00 (135.1/154.2) | 0.0001 | 142.00 (135.4/149.6) | 159.70 (136.6/181.5) | 0.030 |
| ApoB (mg/dl) | 85.86 (69.6/99.1) | 79.22 (73.2/93.9) | 0.923 | 70.8 (60.15/85.12) | 82.00 (55.5/90.2) | 0.140 |
| ApoB/ApoA1 ratio | 0.65 (0.5/0.8) | 0.55 (0.50/0.64) | 0.039 | 0.48 (0.40/0.58) | 0.51 (0/0.6) | 0.922 |
| Non-cholesterol/HDL ratio | 3.05 (2.6/3.6) | 2.57 (2.2/2.9) | 0.011 | 2.92 (2.5/3.4) | 1.92 (1.5/2.4) | 0.889 |
| hsCRP (mg/l) | 2.36 (1.2/5.8) | 4.15 (2.4/5.5) | 0.126 | 1.04 (0.6/2.4) | 2.73 (1.4/6.8) | 0.056 |
| Ferritin (ng/ml) | 77.00 (22.2/131.0) | 50.70 (25.7/79.6) | 0.368 | 62.60 (25.0/146.5) | 37.80 (24.3/113.9) | 0.425 |
| Transferrin (mg/dl) | 291.60 (266.4/308.5) | 281.62 (250.8/330.2) | 0.737 | 263.60 (244.5/307.8) | 267.10 (254.6/299.7) | 0.752 |
p values statistically significant are remarked. IC: ischemic cardiomyopathy, CRF: chronic renal failure, T2DM: type 2 diabetes mellitus, HbA1c: glycated hemoglobin, HDL: high-density lipoprotein, LDL: low-density lipoprotein, hsCRP: high sensitivity C-reactive protein, ApoB: apolipoprotein B, ApoA1: apolipoprotein A1.
In the Spearman correlation analyses for all the variables in both studied groups we found that in the MetS group hsCRP demonstrated a low positive correlation with ApoB/ApoA1 ratio (rho=0.36, p=0.005) but not in subjects without MetS. The correlation between hsCRP and non-HDL-cholesterol/HDL-cholesterol ratio was not significant. Also, non-HDL-cholesterol/HDL-cholesterol ratio and ApoB/ApoA1 ratio are highly correlated in MetS subjects (rho=0.863, p<0.0001) and in the group without MetS (rho=0.859, p<0.0001).
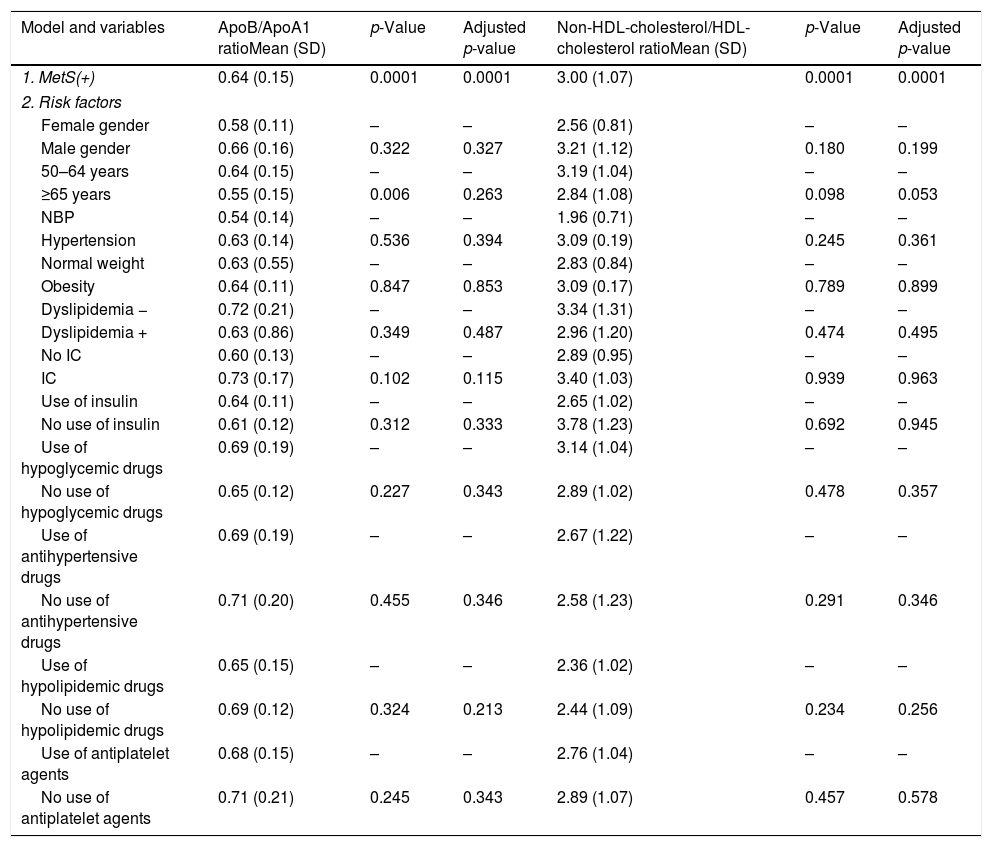
Patients with MetS have a significant association, after linear regression analysis, with: ApoA1 (R2=0.164, p=0.028); ApoB/ApoA1 ratio (R2=0.187, p=0.001); and Non-HDL-Cholesterol/HDL-Cholesterol ratio (R2=0.269, p<0.0001). Age had lost the significance after adjustment (Table 3).
MetS effect on ApoB/ApoA1 ratio and non-HDL cholesterol/HDL-cholesterol ratio in patients with T2DM and MetS adjusted by risk factors.
| Model and variables | ApoB/ApoA1 ratioMean (SD) | p-Value | Adjusted p-value | Non-HDL-cholesterol/HDL-cholesterol ratioMean (SD) | p-Value | Adjusted p-value |
|---|---|---|---|---|---|---|
| 1. MetS(+) | 0.64 (0.15) | 0.0001 | 0.0001 | 3.00 (1.07) | 0.0001 | 0.0001 |
| 2. Risk factors | ||||||
| Female gender | 0.58 (0.11) | – | – | 2.56 (0.81) | – | – |
| Male gender | 0.66 (0.16) | 0.322 | 0.327 | 3.21 (1.12) | 0.180 | 0.199 |
| 50–64 years | 0.64 (0.15) | – | – | 3.19 (1.04) | – | – |
| ≥65 years | 0.55 (0.15) | 0.006 | 0.263 | 2.84 (1.08) | 0.098 | 0.053 |
| NBP | 0.54 (0.14) | – | – | 1.96 (0.71) | – | – |
| Hypertension | 0.63 (0.14) | 0.536 | 0.394 | 3.09 (0.19) | 0.245 | 0.361 |
| Normal weight | 0.63 (0.55) | – | – | 2.83 (0.84) | – | – |
| Obesity | 0.64 (0.11) | 0.847 | 0.853 | 3.09 (0.17) | 0.789 | 0.899 |
| Dyslipidemia − | 0.72 (0.21) | – | – | 3.34 (1.31) | – | – |
| Dyslipidemia + | 0.63 (0.86) | 0.349 | 0.487 | 2.96 (1.20) | 0.474 | 0.495 |
| No IC | 0.60 (0.13) | – | – | 2.89 (0.95) | – | – |
| IC | 0.73 (0.17) | 0.102 | 0.115 | 3.40 (1.03) | 0.939 | 0.963 |
| Use of insulin | 0.64 (0.11) | – | – | 2.65 (1.02) | – | – |
| No use of insulin | 0.61 (0.12) | 0.312 | 0.333 | 3.78 (1.23) | 0.692 | 0.945 |
| Use of hypoglycemic drugs | 0.69 (0.19) | – | – | 3.14 (1.04) | – | – |
| No use of hypoglycemic drugs | 0.65 (0.12) | 0.227 | 0.343 | 2.89 (1.02) | 0.478 | 0.357 |
| Use of antihypertensive drugs | 0.69 (0.19) | – | – | 2.67 (1.22) | – | – |
| No use of antihypertensive drugs | 0.71 (0.20) | 0.455 | 0.346 | 2.58 (1.23) | 0.291 | 0.346 |
| Use of hypolipidemic drugs | 0.65 (0.15) | – | – | 2.36 (1.02) | – | – |
| No use of hypolipidemic drugs | 0.69 (0.12) | 0.324 | 0.213 | 2.44 (1.09) | 0.234 | 0.256 |
| Use of antiplatelet agents | 0.68 (0.15) | – | – | 2.76 (1.04) | – | – |
| No use of antiplatelet agents | 0.71 (0.21) | 0.245 | 0.343 | 2.89 (1.07) | 0.457 | 0.578 |
Dependent variable: ApoB/ApoA1 ratio and non-HDL-cholesterol/HDL-cholesterol ratio. Model 1. Metabolic syndrome, ischemic cardiomyopathy and ratios. Model 2: model 1 plus classical risk factors. Comparisons were made by linear regression. IC: ischemic cardiomyopathy, MetS: metabolic syndrome, NBP: normal blood pressure.
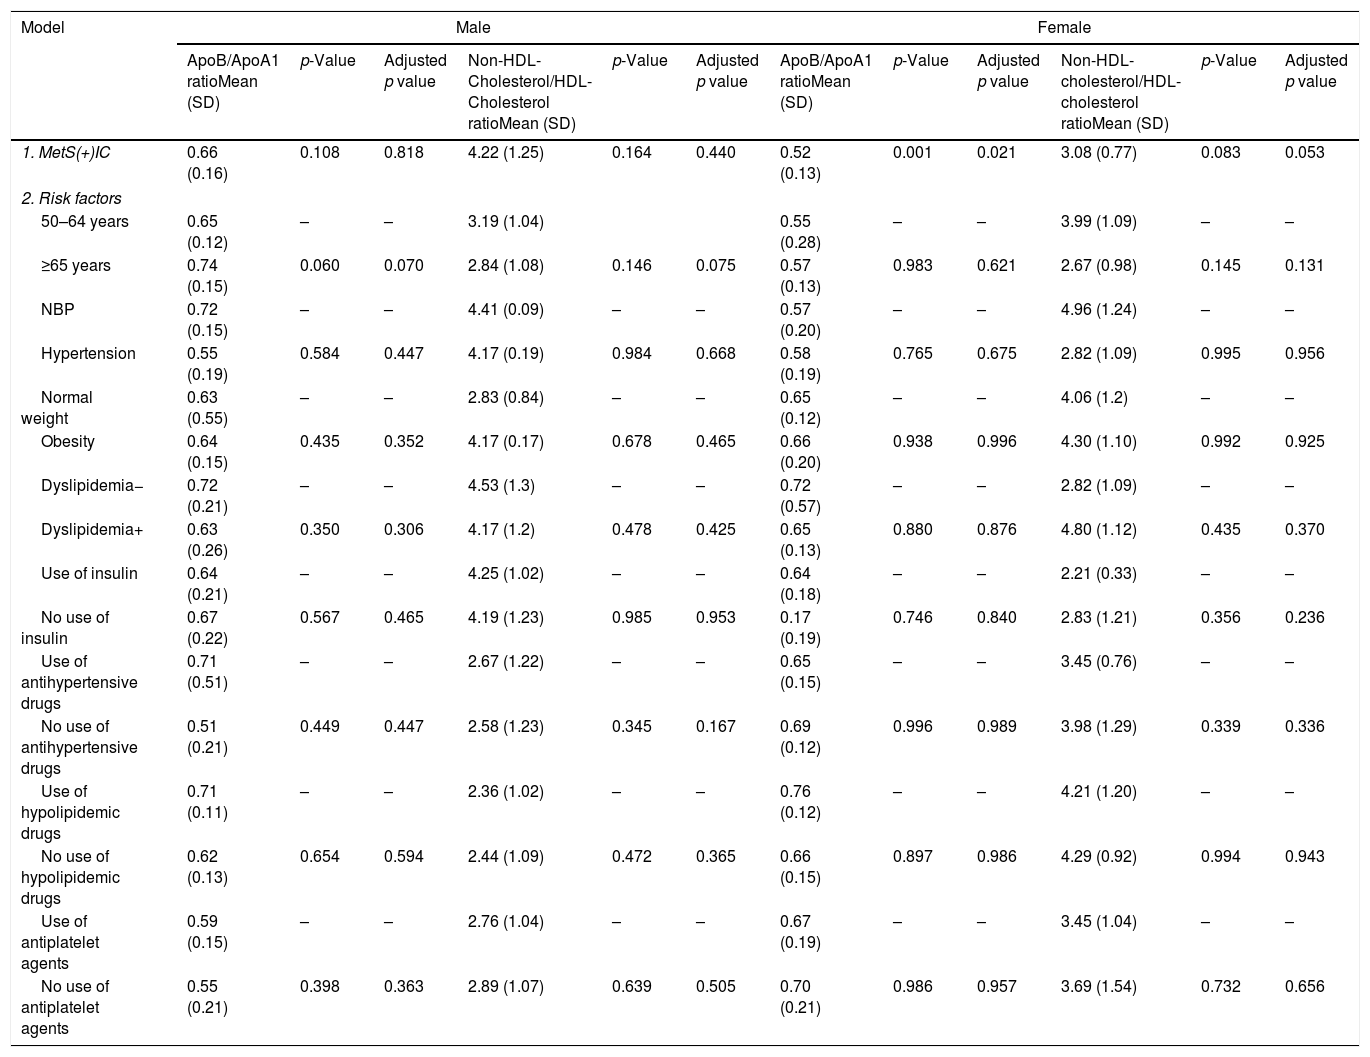
There is an association between women with MetS and the presence of IC and ApoB/ApoA1 ratio, although after adjusting risk factors (R2=0.228, p=0.032), but it is not in women and Non-HDL-Cholesterol/HDL-Cholesterol ratio. No differences have been found in men (Table 4).
MetS and IC effect on ApoB/ApoA1 ratio and non-HDL-cholesterol/HDL-cholesterol ratio in T2DM patients divided by gender.
| Model | Male | Female | ||||||||||
|---|---|---|---|---|---|---|---|---|---|---|---|---|
| ApoB/ApoA1 ratioMean (SD) | p-Value | Adjusted p value | Non-HDL-Cholesterol/HDL-Cholesterol ratioMean (SD) | p-Value | Adjusted p value | ApoB/ApoA1 ratioMean (SD) | p-Value | Adjusted p value | Non-HDL-cholesterol/HDL-cholesterol ratioMean (SD) | p-Value | Adjusted p value | |
| 1. MetS(+)IC | 0.66 (0.16) | 0.108 | 0.818 | 4.22 (1.25) | 0.164 | 0.440 | 0.52 (0.13) | 0.001 | 0.021 | 3.08 (0.77) | 0.083 | 0.053 |
| 2. Risk factors | ||||||||||||
| 50–64 years | 0.65 (0.12) | – | – | 3.19 (1.04) | 0.55 (0.28) | – | – | 3.99 (1.09) | – | – | ||
| ≥65 years | 0.74 (0.15) | 0.060 | 0.070 | 2.84 (1.08) | 0.146 | 0.075 | 0.57 (0.13) | 0.983 | 0.621 | 2.67 (0.98) | 0.145 | 0.131 |
| NBP | 0.72 (0.15) | – | – | 4.41 (0.09) | – | – | 0.57 (0.20) | – | – | 4.96 (1.24) | – | – |
| Hypertension | 0.55 (0.19) | 0.584 | 0.447 | 4.17 (0.19) | 0.984 | 0.668 | 0.58 (0.19) | 0.765 | 0.675 | 2.82 (1.09) | 0.995 | 0.956 |
| Normal weight | 0.63 (0.55) | – | – | 2.83 (0.84) | – | – | 0.65 (0.12) | – | – | 4.06 (1.2) | – | – |
| Obesity | 0.64 (0.15) | 0.435 | 0.352 | 4.17 (0.17) | 0.678 | 0.465 | 0.66 (0.20) | 0.938 | 0.996 | 4.30 (1.10) | 0.992 | 0.925 |
| Dyslipidemia− | 0.72 (0.21) | – | – | 4.53 (1.3) | – | – | 0.72 (0.57) | – | – | 2.82 (1.09) | – | – |
| Dyslipidemia+ | 0.63 (0.26) | 0.350 | 0.306 | 4.17 (1.2) | 0.478 | 0.425 | 0.65 (0.13) | 0.880 | 0.876 | 4.80 (1.12) | 0.435 | 0.370 |
| Use of insulin | 0.64 (0.21) | – | – | 4.25 (1.02) | – | – | 0.64 (0.18) | – | – | 2.21 (0.33) | – | – |
| No use of insulin | 0.67 (0.22) | 0.567 | 0.465 | 4.19 (1.23) | 0.985 | 0.953 | 0.17 (0.19) | 0.746 | 0.840 | 2.83 (1.21) | 0.356 | 0.236 |
| Use of antihypertensive drugs | 0.71 (0.51) | – | – | 2.67 (1.22) | – | – | 0.65 (0.15) | – | – | 3.45 (0.76) | – | – |
| No use of antihypertensive drugs | 0.51 (0.21) | 0.449 | 0.447 | 2.58 (1.23) | 0.345 | 0.167 | 0.69 (0.12) | 0.996 | 0.989 | 3.98 (1.29) | 0.339 | 0.336 |
| Use of hypolipidemic drugs | 0.71 (0.11) | – | – | 2.36 (1.02) | – | – | 0.76 (0.12) | – | – | 4.21 (1.20) | – | – |
| No use of hypolipidemic drugs | 0.62 (0.13) | 0.654 | 0.594 | 2.44 (1.09) | 0.472 | 0.365 | 0.66 (0.15) | 0.897 | 0.986 | 4.29 (0.92) | 0.994 | 0.943 |
| Use of antiplatelet agents | 0.59 (0.15) | – | – | 2.76 (1.04) | – | – | 0.67 (0.19) | – | – | 3.45 (1.04) | – | – |
| No use of antiplatelet agents | 0.55 (0.21) | 0.398 | 0.363 | 2.89 (1.07) | 0.639 | 0.505 | 0.70 (0.21) | 0.986 | 0.957 | 3.69 (1.54) | 0.732 | 0.656 |
Dependent variable: ApoB/ApoA1 ratio and non-HDL-cholesterol/HDL-cholesterol ratio. Model 1. Metabolic syndrome, ischemic cardiomyopathy and ratios. Model 2: model 1 plus classical risk factors. Comparisons were made by linear regression. IC: ischemic cardiomyopathy, MetS: metabolic syndrome, NBP: normal blood pressure.
T2DM and insulin resistance are important components of MetS, contributing to the high associated cardiovascular risk. ApoA1 might have a proinflammatory effect in chronic inflammation10 and help to regulate the homeostasis of glucose-insulin increasing its synthesis and secretion in pancreatic B cells through protein activating mechanisms that depressing transcription of the insulin gene.24 Despite its antiatherogenic mechanisms, ApoA1 turns dysfunctional when chronic inflammation occurs (obesity, T2DM, MetS, aging, etc.) and its elevation might be proinflammatory,10 that paradoxical effect is directly related with development of T2DM25 and probably with MetS. Thus, identifying subjects with MetS in that conditions could represent a limitation. A lack of homeostasis between anti-thrombotic and pro-thrombotic factors can lead to myocardial infarction, IC and several cardiovascular complications.8
In our study correlations between both ratios are strong, and ApoB/ApoA1 is correlated with hsCRP. It is in accordance to what was expected, since the apolipoproteins are important components of cholesterol, and they are related to hsCRP in the inflammatory pathways associated with chronic diseases.9 In Asian and European populations have been reported a relationship between non-HDL/HDL ratio and T2DM, and between ApoB/ApoA1 ratio and T2DM13,14,16,26 but we did not find a similar report in Spanish population. Thus, inflammatory markers are promising predictors of metabolic risk in T2DM patients.
There are a lot of variables that can affect the levels of apolipoproteins and cholesterol, and a confounder's adjustment by linear regression is necessary. For example, 98% of the MetS+ patients used hypolipidemic drugs (96% statins and 21% statins and fibrates), and 89% of the MetS− patients (97% statins, and 30% statins and fibrates). Statins affects apolipoprotein levels, about 40–50% for ApoB, increase the ApoA1 about 10–15%, and for the ApoB/ApoA1 ratio lowers by about 50%.27
In the present study, we found that cholesterol components, like HDL-C and ApoA1 are accurate markers for MetS. A significant difference between groups for ApoA1, ApoB/ApoA1 ratio and non-HDL-cholesterol/HDL-cholesterol ratio was found after adjustment. This means that none of the different risk factors had influenced the variable.
There is still controversy on which is the best marker for MetS diagnosis. A study in Koreans suggests that the non-HDL-cholesterol/HDL-cholesterol ratio is more reliable as a predictor of MetS than ApoB/ApoA1 ratio.19 Another study in Sweden concludes that the ApoB/ApoA1 ratio is more effective than the cholesterol indexes to predict cardiac risk in healthy patients.17
Litinget al.28 demonstrated that ApoB/ApoA1 ratio are associated with coronary heart disease in a group of cardiac patients with similar age to our study. As we expected, MetS are associated with these two ratios stronger than their components separately, in accordance with several previous studies.18,19,29,30 In the study AMORIS (apolipoprotein-related MOrtalityRISk), in healthy Swedish population, Walldius et al.17 concluded that ApoB, ApoB/ApoA1 ratio and ApoA1 is predictive in cardiac risk evaluation, especially helpful for fatal myocardial infarction in people of both sexes with normal or low concentrations of LDL-cholesterol.
The number of MetS components may have a relationship with ApoB/ApoA1 ratio31,32 but this data was not gathered in the present study. The small sample size in the present study is probably a limitation, as well as the lack of data of alcohol consumption, smoking and socioeconomic status.32
Non-HDL-cholesterol/HDL-cholesterol ratio has the disadvantage that the dietary intake of fat causes variations in serum levels; thus its measurement needs a fasting period. Some authors prefer the apolipoprotein ratio to determine MetS risk, for the facilities to get the blood samples and because it is simple to standardize.18 Adequate cut-off for prediction of MetS is not well established, there are few studies in Caucasian population.
Also, ApoB and ApoA1 could improve the classic risk factor model for first-ever myocardial infarction, including some novel sex-specific biomarkers.33 Coronary risk could be predicted with ApoA1 and ApoB in non-diabetic subjects with MetS.34 Some new studies of this issue are needed.
In our medical center, both ratios are feasible for follow-up and control of patients with high cardiovascular and metabolic risk, and it can be an important prognostic test.
The relationship between cardiovascular risk and age-related decline of sex hormones are well documented in women.35 The incidence of IC in women is significantly different than in men. Women in our study are all in menopausal status, so we cannot compare with premenopausal women. As we documented, women have increased levels of ApoA1 and low levels of ApoB. We can say that their relative cardiovascular risk is lower compared with men in spite of their menopausal status. Nevertheless, the elevation of ApoB/ApoA1 ratio is of worse prognosis in women.19 Pathophysiology and clinical expression of MetS are different between genders. The prevalence of abdominal fat, adipocyte biology and underdiagnoses of MetS could explain an increase of cardiovascular risk in women after menopause. Bodde36 et al.; have been demonstrated that apoA1, ApoB and their ratio can predict an increased risk of ST-elevation myocardial infarction (STEMI). So far it is not clear if MetS confers an elevated cardiovascular risk in women with diabetes.4 Several authors conclude that the role of ApoA1 and ApoB in cardiovascular risk according sex is uncertain.4 A recent report described a relationship between ApoB/ApoA1 ratio and myocardial infarction in Caucasian middle-aged men, but did not include women for comparison and had a long-term follow up,37 therefore it is not comparable with our study.
In the present research MetS is independently associated with ApoA1, ApoB/ApoA1 and non-HDL-cholesterol/HDL-cholesterol ratios in T2DM subjects studied. Both of the ratios are better at predicting MetS than ApoB, ApoA1, cholesterol and HDL-C separately. That conclusion is in accordance with other investigations in Caucasian population.38–40 Also, theApoB/ApoA1 ratio is an independent predictor of IC for women with MetS in the subjects studied. Further studies are needed to confirm the prognostic value of these two ratios in MetS and cardiovascular risk.
In conclusion, we found that both ratios are adequate for predicting MetS in T2DM patients. ApoB/ApoA1 ratio shows to be a better cardiovascular risk marker in women with MetS than in men. New studies should be carried out to confirm this finding.
ContributionsAll the authors contributed actively in the realization of the article.
Gabriela Lizet Reynoso-Villalpando and Francisco Javier del Cañizo-Gómez, contributed to the conception and design of the study, data acquisition, analysis and interpretation of the data, the draft of the article, the critical review of the important intellectual content, and the approval definitive of the version presented.
Cristina Sevillano-Collantes and Inmaculada Moreno-Ruiz, contributed to the conception and design of the study, data acquisition, analysis and interpretation of the data, the critical review of the important intellectual content and the final approval of the version presented.
Yeminia Valle and Jorge Ramón Padilla-Gutiérrez contributed to the conception and design of the study, analysis and interpretation of the data, the critical review of the important intellectual content and the final approval of the version presented.
Conflict of interestNo competing financial interest exists.
