


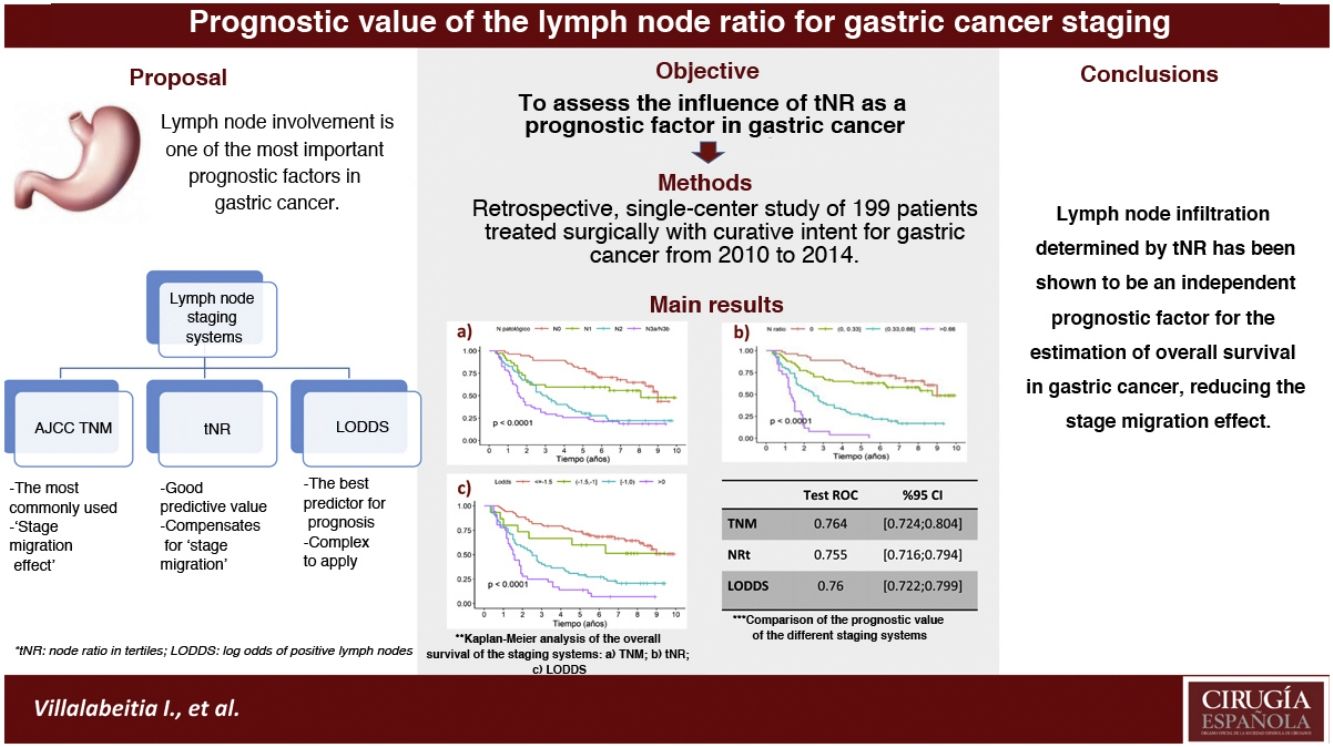
In the gastric cancer the most widely used classification is the AJCC TNM system. However, it presents limitations, such as staging migration in cases with suboptimal lymphadenectomies. The nodal ratio has been proposed as an alternative system, proving to be a good prognostic predictor of survival. The aim was to assess the influence of the nodal ratio measured in tertiles [tNR] as a prognostic factor and compare with the TNM systems (7th ed.) and log odds of positive lymph nodes [LODDS].
Material and methodsRetrospective and single-center study on 199 patients operated on with curative intent between 2010 and 2014. For each system an univariate and multivariate analysis was performed and the overall survival rates [OS] were compared by the ROC test.
ResultsThe prognostic factors that showed statistical significance in the multivariate analysis were: tRN2 (HR2.87) and tRN3 (HR7.29); LODDS 2 (HR1.55), LODDS3 (HR2.6) and LODDS4 (HR4.9); pN2 (HR1.84) and pN3 (HR2.91). The 5-year OS was 75.8%, 61.4%, 25.8%, and 3.84% for tRN0, tRN1, tRN2 and tRN3; 72.4%, 60%, 29.1% and 13.9% for LODDS1, LODDS2, LODDS3 and LODDS4; and 77.6%, 59.4%, 28.8% and 25.5% for pN0, pN1, pN2 and pN3, respectively. The three systems behaved as good predictors, with areas under the curve >0.75.
ConclusiontNR was an independent prognostic factor for estimating survival in gastric cancer. Furthermore, the ease of its calculation in clinical practice could reduce the effect of staging migration.
El sistema de clasificación ganglionar gástrico más utilizado en el cáncer gástrico es el TNM. No obstante presenta limitaciones, como la “migración de estadiaje” en los casos con linfadenectomías subóptimas, por ello se han planteado distintos sistemas. Asimismo, el objetivo fue valorar la influencia del ratio nodal medido en terciles [RNt] como factor pronóstico, y compararlo con los sistemas TNM (7ª ed.) y log odds of positive lymph nodes [LODDS].
Material y métodosSe trata de un estudio retrospectivo y unicéntrico sobre 199 pacientes con neoplasia gástrica intervenidos con intención curativa entre 2010 y 2014. Se realizó un análisis univariante y multivariante de cada sistema, y se compararon las tasas de supervivencia global [SG] obtenidas mediante test ROC.
ResultadosLos factores pronóstico que mostraron significación estadística en el análisis multivariante fueron: RNt2 (HR2,87) y RNt3 (HR7,29); LODDS 2 (HR1,55), LODDS3 (HR2,6) y LODDS4 (HR4,9); pN2 (HR1.84) y pN3 (HR2.91). La SG a 5 años fue del 75,8%, 61,4%, 25,8% y 3,84% para RNt0, RNt1, RNt2 y RNt3; 72,4%, 60%, 29,1% y 13,9% para LODDS1, LODDS2, LODDS3 y LODDS4; y 77,6%, 59,4%, 28,8% y 25,5% para pN0, pN1, pN2 y pN3, respectivamente. Los tres sistemas se comportaron como buenos predictores, con áreas bajo la curva >0,75.
ConclusiónEl RNt fue un factor pronóstico independiente para la estimación de la supervivencia en el cáncer gástrico. Además, la facilidad de su cálculo en la práctica clínica podría disminuir el efecto de migración de estadificación.
Lymph node involvement is one of the most important prognostic factors in gastric cancer. The pathological N category (pN) is the most widely used in staging1; however, its main limitation is the influence of the number of resected lymph nodes. Thus, some cases with suboptimal lymphadenectomies (less than 15 lymph nodes analyzed) may have a ‘stage migration’ effect.2,3
The lymph node ratio (LNR), which is the number of metastatic lymph nodes among the total number of resected lymph nodes, has been proposed as an alternative to the Tumor-Node-Metastasis (TNM) lymph node classification system due to its good predictive value and its ease of application.4,5
In addition, the log odds of positive lymph nodes (LODDS) system, which is based on the logarithm of the positive lymph nodes among the negative nodes analyzed, has been shown to be the best prognostic predictor to estimate the survival of this cancer.4 However, its clinical application is not very reproducible due to the complexity of its calculation and interpretation: log (pnod + 0.5)/(tnod − pnod + 0.5), where pnod refers to the number of positive nodes and tnod to the total number of resected nodes; +0.5 is added to both the numerator and the denominator to avoid results that tend to infinity.6
The objective of this study was to assess the influence of LNR as a prognostic factor in gastric cancer, and to compare it with the classical staging system (TNM pN category) and the LODDS.
MethodsThe methodology was based on a retrospective study of a prospective series of patients from a single hospital who underwent surgery with curative intent for gastric cancer between January 1, 2010 and December 31, 2014. Follow-up continued until December 31, 2019. Patients with metastatic disease in the pathology analysis (pM+) and those who died in the first 120 postoperative days were excluded.
Data was collected retrospectively by reviewing medical records, specifically analyzing the variables under study: demographic, surgical, pathological and prospective follow-up.
All patients diagnosed with gastric neoplasm were evaluated by a multidisciplinary committee. Total or partial gastrectomy was indicated individually depending on the extension, histology and location of the tumor. D2 lymphadenectomy was performed in a standardized manner and later extended to the D1 region in patients of advanced age or with comorbidities.
Tumors were classified during the study period according to the current TNM system of the American Joint Committee on Cancer (AJCC), 7th Edition, 2010. All patients were reassessed by the medical oncology service to estimate the need for adjuvant treatments. A joint follow-up was established between the gastrointestinal surgery and medical oncology services (scheduled every 6 months for 5 years), with alternating lab work and radiological and/or gastroscopic follow-up. Patients who presented disease recurrence underwent individualized follow-up that lasted until survival, death, or cure.
The cut-off points for LNR were established in tertiles in order to homogenize the number of patients included in each subgroup. The LODDS system was based on the classification proposed by Jian-Hui, et al.: LODDS1 < −1.5; −1.5 < LODDS2< −1; −1 < LODDS3 < 0; and LODDS4 > 0.4
Informed consent was obtained from all patients undergoing surgery in order to use the information derived for teaching or research purposes. The study was approved by the Clinical Research Ethics Committee of the OSI Ezkerraldea-Enkarterri-Cruces (CEIC E20/14).
Statistical analysisQuantitative variables were described using the median and range or mean and its standard deviation, while qualitative variables were described as percentages. Five-year overall survival (OS) was calculated, which was defined as the time interval between the date of the intervention and the date of death or last follow-up. The percentages of 5-year survivors were presented and compared with the percentages of 5-year deaths using the chi-square test. Kaplan-Meier curves were made to compare OS according to each lymph node classification: a) LNR expressed in tertiles (tNR): tNR0 = 0; tNR1 > 0 ≤ 0.33; tNR2 > 0.33 ≤ 0.66; and tNR3 > 0.66; b) TNM classification (AJCC, 7th Ed, 2010): pN0 = 0 nodes, pN1 = 1–2; pN2 = 3–6; pN3 > 6); and c) LODDS system: LODDS1 < −1.5, −1.5 < LODDS2 < −1, −1 < LODDS3 < 0, and LODDS4 > 0. A univariate analysis of the categories of each classification and a multivariate analysis with Cox regression models were performed, adding these same variables and age (≤65 or >65 years), as well as the location (according to the gastroscopy) and pathological T (according to TNM) as adjustment variables. To measure the discrimination capacity of the models, we calculated the area under the curve (AUC), in addition to comparing which of the models demonstrated better discrimination capability by calculating the difference in AUC (Δ AUC).
For the study of the requirements to be considered in the classification systems, the following were analyzed: (1) Monotonicity, evaluating the proportional increase obtained by the hazard ratio (HR) or the relative risk in the multivariate analysis; (2) Homogeneity, analyzing the range of the confidence interval; and (3) Differentiation, quantified by superimposing the survival intervals of each stage according to Kaplan–Meier graphs.2
All analyses were performed with the statistical program R (version 4.0.1): A language and environment for statistical computing (R Foundation for Statistical Computing, Vienna, Austria). P values <.05 were considered statistically significant.
ResultsA total of 222 patients underwent surgery with curative intent. Fourteen subjects were excluded due to the presence of pM + and 9 due to death in the first 120 days after surgery or due to loss of follow-up (Fig. 1).

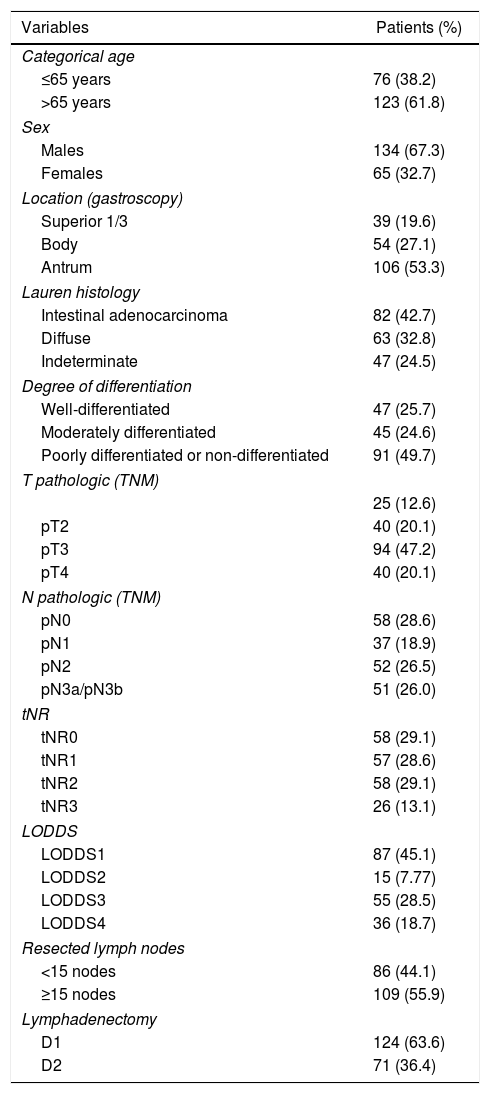
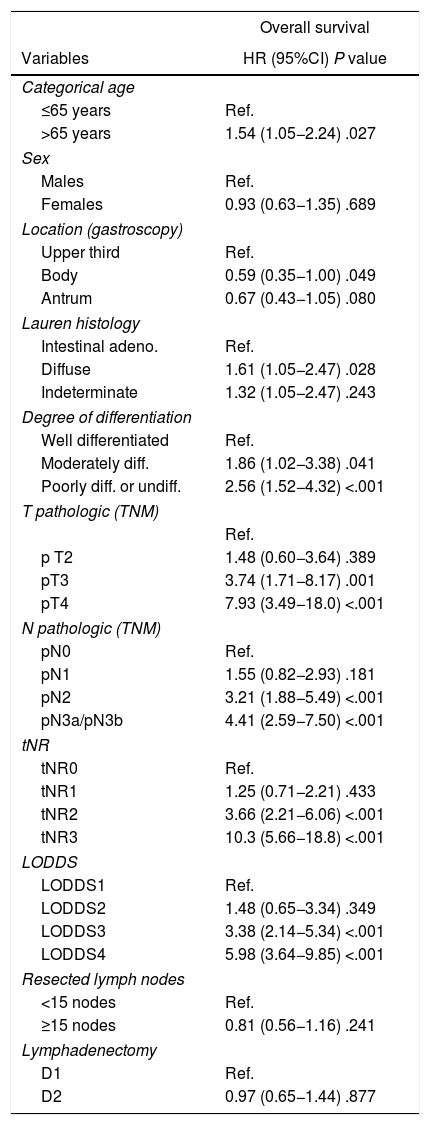
In the end, 199 patients were included in the study. The main demographic data and pathological factors are shown in Table 1. Lymphadenectomies of ≥15 lymph nodes were performed in 109 patients (55.9%), while lymph node resection was considered suboptimal in 86 cases (44.1%). In the univariate analysis, the following were statistically significant prognostic factors for survival: age >65 years, diffuse histology, moderately and poorly differentiated or undifferentiated tumors, categories T3–4, categories pN2−3, tNR 2–3 and LODDS 3–4 (Table 2).
Demographic data and pathologic factors.
| Variables | Patients (%) |
|---|---|
| Categorical age | |
| ≤65 years | 76 (38.2) |
| >65 years | 123 (61.8) |
| Sex | |
| Males | 134 (67.3) |
| Females | 65 (32.7) |
| Location (gastroscopy) | |
| Superior 1/3 | 39 (19.6) |
| Body | 54 (27.1) |
| Antrum | 106 (53.3) |
| Lauren histology | |
| Intestinal adenocarcinoma | 82 (42.7) |
| Diffuse | 63 (32.8) |
| Indeterminate | 47 (24.5) |
| Degree of differentiation | |
| Well-differentiated | 47 (25.7) |
| Moderately differentiated | 45 (24.6) |
| Poorly differentiated or non-differentiated | 91 (49.7) |
| T pathologic (TNM) | |
| 25 (12.6) | |
| pT2 | 40 (20.1) |
| pT3 | 94 (47.2) |
| pT4 | 40 (20.1) |
| N pathologic (TNM) | |
| pN0 | 58 (28.6) |
| pN1 | 37 (18.9) |
| pN2 | 52 (26.5) |
| pN3a/pN3b | 51 (26.0) |
| tNR | |
| tNR0 | 58 (29.1) |
| tNR1 | 57 (28.6) |
| tNR2 | 58 (29.1) |
| tNR3 | 26 (13.1) |
| LODDS | |
| LODDS1 | 87 (45.1) |
| LODDS2 | 15 (7.77) |
| LODDS3 | 55 (28.5) |
| LODDS4 | 36 (18.7) |
| Resected lymph nodes | |
| <15 nodes | 86 (44.1) |
| ≥15 nodes | 109 (55.9) |
| Lymphadenectomy | |
| D1 | 124 (63.6) |
| D2 | 71 (36.4) |
LODDS, log odds of positive lymph nodes; tNR, node ratio expressed with tertiles; pN, pathologic category N; LNR, lymph node ratio; TNM, tumor-node-metastasis.
Univariate study of survival of the lymphatic dissemination classification systems.
| Overall survival | |
|---|---|
| Variables | HR (95%CI) P value |
| Categorical age | |
| ≤65 years | Ref. |
| >65 years | 1.54 (1.05−2.24) .027 |
| Sex | |
| Males | Ref. |
| Females | 0.93 (0.63−1.35) .689 |
| Location (gastroscopy) | |
| Upper third | Ref. |
| Body | 0.59 (0.35−1.00) .049 |
| Antrum | 0.67 (0.43−1.05) .080 |
| Lauren histology | |
| Intestinal adeno. | Ref. |
| Diffuse | 1.61 (1.05−2.47) .028 |
| Indeterminate | 1.32 (1.05−2.47) .243 |
| Degree of differentiation | |
| Well differentiated | Ref. |
| Moderately diff. | 1.86 (1.02−3.38) .041 |
| Poorly diff. or undiff. | 2.56 (1.52−4.32) <.001 |
| T pathologic (TNM) | |
| Ref. | |
| p T2 | 1.48 (0.60−3.64) .389 |
| pT3 | 3.74 (1.71−8.17) .001 |
| pT4 | 7.93 (3.49−18.0) <.001 |
| N pathologic (TNM) | |
| pN0 | Ref. |
| pN1 | 1.55 (0.82−2.93) .181 |
| pN2 | 3.21 (1.88−5.49) <.001 |
| pN3a/pN3b | 4.41 (2.59−7.50) <.001 |
| tNR | |
| tNR0 | Ref. |
| tNR1 | 1.25 (0.71−2.21) .433 |
| tNR2 | 3.66 (2.21−6.06) <.001 |
| tNR3 | 10.3 (5.66−18.8) <.001 |
| LODDS | |
| LODDS1 | Ref. |
| LODDS2 | 1.48 (0.65−3.34) .349 |
| LODDS3 | 3.38 (2.14−5.34) <.001 |
| LODDS4 | 5.98 (3.64−9.85) <.001 |
| Resected lymph nodes | |
| <15 nodes | Ref. |
| ≥15 nodes | 0.81 (0.56−1.16) .241 |
| Lymphadenectomy | |
| D1 | Ref. |
| D2 | 0.97 (0.65−1.44) .877 |
HR, hazard ratio; 95%CI, 95% confidence interval; LODDS, log odds of positive lymph nodes; tNR, node ratio expressed in tertiles; pN, pathologic category N; LNR, lymph node ratio; TNM, tumor-node-metastasis system.
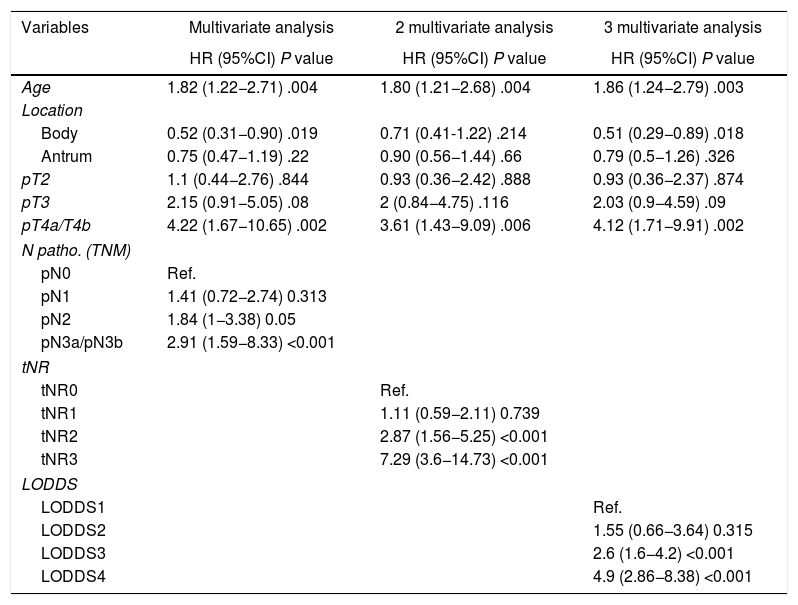
In the multivariate analysis, the tNR system was shown to be an independent prognostic factor for survival: HR for tNR2: 2.87 (1.57–5.25) and HR for tNR3: 7.29 (3.6−14.73) (Table 3). The 5-year OS estimate was 75.8% for tNR0; 61.4% para tNR1; 25.8% para tNR2; and 3.84% para tNR3 (Fig. 2A).
Multivariate study of overall survival of lymph node staging systems.
| Variables | Multivariate analysis | 2 multivariate analysis | 3 multivariate analysis |
|---|---|---|---|
| HR (95%CI) P value | HR (95%CI) P value | HR (95%CI) P value | |
| Age | 1.82 (1.22−2.71) .004 | 1.80 (1.21−2.68) .004 | 1.86 (1.24−2.79) .003 |
| Location | |||
| Body | 0.52 (0.31−0.90) .019 | 0.71 (0.41-1.22) .214 | 0.51 (0.29−0.89) .018 |
| Antrum | 0.75 (0.47−1.19) .22 | 0.90 (0.56−1.44) .66 | 0.79 (0.5−1.26) .326 |
| pT2 | 1.1 (0.44−2.76) .844 | 0.93 (0.36−2.42) .888 | 0.93 (0.36−2.37) .874 |
| pT3 | 2.15 (0.91−5.05) .08 | 2 (0.84−4.75) .116 | 2.03 (0.9−4.59) .09 |
| pT4a/T4b | 4.22 (1.67−10.65) .002 | 3.61 (1.43−9.09) .006 | 4.12 (1.71−9.91) .002 |
| N patho. (TNM) | |||
| pN0 | Ref. | ||
| pN1 | 1.41 (0.72−2.74) 0.313 | ||
| pN2 | 1.84 (1−3.38) 0.05 | ||
| pN3a/pN3b | 2.91 (1.59−8.33) <0.001 | ||
| tNR | |||
| tNR0 | Ref. | ||
| tNR1 | 1.11 (0.59−2.11) 0.739 | ||
| tNR2 | 2.87 (1.56−5.25) <0.001 | ||
| tNR3 | 7.29 (3.6−14.73) <0.001 | ||
| LODDS | |||
| LODDS1 | Ref. | ||
| LODDS2 | 1.55 (0.66−3.64) 0.315 | ||
| LODDS3 | 2.6 (1.6−4.2) <0.001 | ||
| LODDS4 | 4.9 (2.86−8.38) <0.001 | ||
HR, hazard ratio; 95%CI, 95% confidence interval; LODDS, log odds of positive lymph nodes; tNR, node ratio expressed in tertiles; pN, pathologic category N; LNR, lymph node ratio; TNM, tumor-node-metastasis system.
 According to the pN classification of the TMN; (B) According to the lymph node ratio expressed with tertiles; (C) According to LODDS.")
The LODDS system was also shown to be an independent prognostic factor in the multivariate survival analysis (Table 3): HR for LODDS2: 1.55 (0.66−3.64); LODDS3: 2.6 (1.6−4.2); and LODDS4: 4.9 (2.86−8.38). Thus, the 5-year survival rate was 72.4% for LODDS1, 60% for LODDS2, 29.1% for LODDS3, and 13.9% for LODDS4 (Fig. 2B).
Likewise, the pN category of the classic TNM system was shown to be an independent prognostic factor in the multivariate survival analysis (Table 2): HR for pN2: 1.84 (1−3.38), and HR for pN3: 2.91 (1.59−8.33). The 5-year survival according to this system was 77.6% for pN0, 59.4% for pN1, 28.8% for pN2, and 25.5% for pN3 (Fig. 2C).
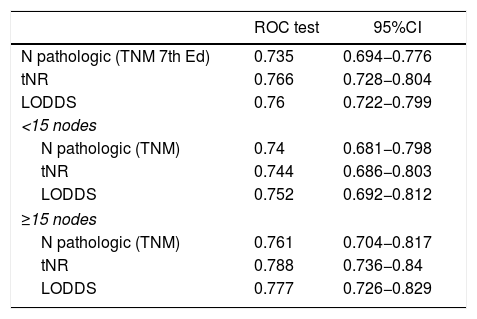
In the present cohort, the 3 assessment systems for lymph node involvement can be considered good prognostic predictors according to the ROC curves, with AUC close to 0.75 (Table 4). In the specific assessment of the patients with suboptimal lymphadenectomies, the LODDS system obtained the best score, with an AUC = 0.752. Likewise, the tNR systems and the pN category of the TNM showed similar values: AUC = 0.744 and 0.74, respectively (Table 4). Similarly, the 3 models were compared by calculating the Δ AUC, as shown in Table 4.
Comparison of the prognostic value of the different staging systems and comparison among the 3 systems using Δ AUC.
| ROC test | 95%CI | |
|---|---|---|
| N pathologic (TNM 7th Ed) | 0.735 | 0.694−0.776 |
| tNR | 0.766 | 0.728−0.804 |
| LODDS | 0.76 | 0.722−0.799 |
| <15 nodes | ||
| N pathologic (TNM) | 0.74 | 0.681−0.798 |
| tNR | 0.744 | 0.686−0.803 |
| LODDS | 0.752 | 0.692−0.812 |
| ≥15 nodes | ||
| N pathologic (TNM) | 0.761 | 0.704−0.817 |
| tNR | 0.788 | 0.736−0.84 |
| LODDS | 0.777 | 0.726−0.829 |
| pN system (TNM) | LNR | LODDS |
|---|---|---|
| pN (TNM) | P = .675 | P = .351 |
| LNR | Δ = 0.005 | P = .543 |
| LODDS | Δ = 0.013 | Δ = 0.008 |
AUC, area under curve; 95%CI, 95% confidence interval; LODDS, log odds of positive lymph nodes; tNR, node ratio expressed in tertiles; pN, pathologic category N; ROC, receiver operating characteristic curve; LNR, lymph node ratio; TNM, tumor-node-metastasis system.
Finally, regarding monotonicity, homogeneity and differentiation capacity, the results were as follows: 1) Monotonicity of the pN category of the TNM: pN1 = HR1.84; pN2 = HR2.75; pN3 = HR6.23; for LNR (tNR0 = HR0.9, tNR1 = HR2.36, tNR3 = HR6.17); and from the LODDS: LODDS2 = HR1.55, LODDS3 = HR2.6, LODDS4 = HR4.9; 2) TNM system homogeneity: pN0 = 28.6%; pN1 = 18.9%; pN2 = 26.5%; and pN3 = 26.0%; for tNR: tNR0 = 29.1%, tNR1 = 28.6%, tNR3 = 13.1%; and for LODDS: LODDS1 = 45.1%, LODDS2 = 7.77%, LODDS3 = 28.5%, LODDS4 = 18.7%, and 3). Discrimination ability is shown in Fig. 2.
DiscussionLymph node spread is one of the most important prognostic factors in gastric cancer and has a great impact on survival. According to the latest edition of the clinical practice guidelines of the National Comprehensive Cancer Network (NCCN), standardized D2 lymphadenectomy is recommended.6 However, various studies show that in large Western and Asian cohorts, this type of lymph node resection was only performed in 29% and 60.2% of cases, respectively.7,8 This often leads to a suboptimal lymph node resection rate (<15 nodes), which is consistent with the rate of our hospital (55.9%).
The most widely used international staging system is the TNM by the AJCC. For our study, we used the 7th Edition, which was valid in the period in which the patients of the study underwent surgery, with the following lymph node staging: pN0 in cases without lymph node involvement, pN1 1–2 positive nodes, pN2 3–6 positive nodes and pN3 >6 positive nodes. It should be noted that, in said edition, the pN3 category did not adequately discriminate lymph node disease. In order to reduce this limitation, in 2018 the 8th Edition began to be used, which subdivides the pN3 group into pN3a for cases with 7–15 affected nodes and pN3b for cases with 15 or more affected nodes.1 However, the current TNM system still has several limitations, especially in cases with suboptimal lymphadenectomies, which may imply a ‘stage migration’ effect and, consequently, reduce its prognostic value.9
On the other hand, when analyzing the positive lymph nodes among the total number of resected nodes, the LNR is less affected by the extension of the lymphadenectomies, which would more accurately determine lymph node involvement and help minimize ‘stage migration’. In addition, it would also provide greater precision as an independent prognostic factor.2,3,10,11 In fact, the cohort study published by Kong SH et al. reported that the LNR seemed to be the best predictor of the prognosis.3 However, the great heterogeneity in its different categories, as well as the absence of the theoretical benefit in grade N0 patients, would prevent its general consideration as an alternative to the pN category of the TNM, with NR0 being the same as pN0. That is, its discrimination capacity decreases when the LNR is 0 or 1, and patients with 0/0 or 0/30 and 3/3 or 30/30 positive nodes obtain the same LNR.12,13 Due to these limitations, the LODDS was proposed, which is a system that had been previously used in colon and breast cancers,14,15 and which has also been proposed as an alternative for the staging of gastric cancer.16 Hui J et al. reported the superiority of LODDS compared to LNR and the pN category, as did Sun Z et al, who demonstrated its benefit as a prognostic factor in gastric cancer.17 All this has greater clinical relevance in tumors with more lymph node involvement, such as those with diffuse histology. In the recent publication by Pengfei G et al., the authors state that when the LNR value is limited to 0.2−0.8, both systems (LNR and LODDS) are similar; however, as the LNR value approaches the absolute value of 0 or 1, the LODDS value is heterogeneous, which implies the discriminatory capacity of LODDS in patients with the same LNR.12
In the present study, the 3 classification systems have been compared in order to determine which would be the most appropriate based on its theoretical prognostic value. The 3 systems obtained similar results in the univariate analysis and behaved as independent prognostic factors in the multivariate analysis. It should be noted that the tNR and LODDS systems proved to be better than the pN category in cases with suboptimal lymphadenectomies (44.1% of the subjects studied), with a more favorable AUC for the LODDS. In contrast, the applicability of the latter is tedious and difficult to interpret17 and, therefore, not very feasible for use in routine clinical practice, which does not occur with the calculation of the LNR.
Likewise, for a staging system to be adequate, it should meet several requirements: (1) Monotonicity, meaning that as the stage of the disease increases, survival decreases; (2) Homogeneity, with similar survival rates within each category; and (3) Differentiation, or distinction of survival among the different patient groups.18
After analyzing our data, we have noticed that the TNM is a system with monotonicity and homogeneity; however, it has little discrimination capacity, and the survival curves for pN2 and pN3 overlap at 5 years. The tNR system, on the other hand, has been shown to have the most homogeneous distribution, monotonicity, adequate discriminatory capacity and no overlapping Kaplan–Meier curves. Third, the LODDS turned out to be a system with monotonicity and discrimination capacity, but it did not obtain homogeneous distribution in the sample. Nevertheless, it was the system that presented the highest ROC value (AUC: 0.734), which suggests that it could be the most specific to estimate the prognosis of gastric cancer. But, its calculation and interpretation are complex, both in clinical practice and in research. The LNR, however, is a simpler system that is more widely used among professionals, and both are valid as independent prognostic factors.12 In fact, although we have obtained similar AUC for TNM and LNR in our cohort, various studies, including a meta-analysis published in 2018 by Zhu J et al., recommend the use of LNR as a prognostic factor for lymph node staging in gastric cancer.19 The benefit of its application, which is simpler than the LODDS system,12,13 lies in the fact that its correct interpretation can reduce the ‘stage migration’ effect, which sometimes occurs in patients with insufficient lymph node dissection who are staged using the classical TNM system.5–9
Among the limitations of the study, it is worth mentioning that it is a retrospective single-center series, which may have negative repercussions in terms of higher-level scientific evidence. In addition, another problem that arises is the correct choice of cut-off points to define the different prognostic subgroups.
In closing, we can conclude that lymph node involvement determined by LNR expressed with tertiles has been shown to be an independent prognostic factor for estimating survival in our cohort of patients operated on for gastric cancer, especially in cases with suboptimal lymphadenectomy. However, more prospective, randomized studies are needed to evaluate the efficacy of these lymph node staging systems, assess the feasibility of their application, and even consider the possibility of their inclusion within the TNM system. To this end, the creation of audited prospective registries, such as that of the European Registry of Cancer Care (EURECCA) group,20 could be of interest.
FundingNo grants were received to fund this study.
Conflict of interestsThe authors have no conflict of interests to declare.
Please cite this article as: Villalabeitia Ateca I, Perfecto Valero A, Serrano Hermosilla C, Marcaida Salazar A, Pérez Fernández S, Sarriugarte Lasarte A. Valor pronóstico del ratio nodal en el cáncer gástrico: análisis unicéntrico de 199 pacientes. Cir Esp. 2022;100:266–273.
