


This study analyses the relationship between the incidence of idiopathic spontaneous pneumothorax (ISP) and atmospheric pressure (AP).
MethodsA total of 288 cases of ISP were included, 229 men and 59 women. The AP of the day of diagnosis, of the 3 prior days and the monthly average were registered. The association between the incidence of ISP and AP was analyzed by calculating standardized incidence ratio (SIR) and Poisson regression.
ResultsThe AP on the day of admission (mean±standard deviation) (1017.9±7 hectopascals [hPa]) was higher than the monthly average AP (1016.9±4.1hPa) (P=.005). There was a monthly distribution pattern of ISP with the highest incidence in the months of January, February and September and the lowest in April. When AP was less than 1014hPa, there were fewer cases registered than what would statistically have been expected (58/72 cases). In contrast, when the pressure was higher than 1019hPa, the registered cases were more than expected (109/82 cases) (SIR=1.25; 95% CI: 1.04–1.51). The risk of ISP increased 1.15 times (95% CI: 1.05–1.25, P=.001) for each hPa of AP, regardless of gender, age and monthly average AP. A dose–response relationship was observed, with progressive increases in risk (IRR=1.06 when the AP was 1014–1016hPa; 1.17hPa when the AP was 1016–1019hPa and 1.69 when the AP was superior to 1019hPa) (P for trend=.089).
ConclusionAP is a risk factor for the onset of idiopathic spontaneous pneumothorax.
Se analiza la relación entre incidencia de neumotórax espontáneo idiopático (NEI) y presión atmosférica (PA).
MétodosSe incluyen 288 casos de NEI, 229 hombres y 59 mujeres. Se recogió PA el día del diagnóstico, PA en los 3 días previos y PA media mensual. Se analizó la asociación entre incidencia de NEI y PA mediante cálculo de razón de incidencia estandarizada (RIE) y regresión de Poisson.
ResultadosLa PA el día del ingreso (media±desviación típica) (1.017,9±7 hectopascales [hPa]), fue más elevada que la PA media mensual (1.016,9±4.1hPa; p=0,005). Hubo un patrón de distribución mensual del NEI, con mayor incidencia los meses de enero, febrero y septiembre y menor en abril. Cuando la PA fue inferior a 1.014hPa se registraron menos casos de los que estadísticamente hubiera sido esperable encontrar (58/72 casos); sin embargo, cuando la PA fue superior a 1.019hPa se registraron más casos de los esperados (109/82 casos) (RIE=1,25; IC95%: 1,04–1,51). El riesgo de NEI aumentó 1,15 veces (IC 95%: 1,05–1,25; p=0,001) por cada hPa de PA, independientemente del género, la edad y la PA media mensual. Se observó relación dosis-respuesta, con aumentos progresivos del riesgo (IRR=1,06 cuando la PA fue 1.014–1.016hPa; 1,17 cuando la PA fue 1.016–1.019hPa y 1,69 cuando la PA fue superior a 1.019hPa) (p de tendencia=0,089).
ConclusionesLa PA es factor de riesgo para la aparición de neumotórax espontáneo idiopático.
Idiopathic spontaneous pneumothorax (ISP) is usually caused by air exiting the pleura from bullae located at the apex of the upper lobe of the lung.1,2
The process that makes the bullae’ wall to break and triggers the ISP is unknown. Probably, the changes in transpulmonary gradient (pressure difference between alveoli and pleural cavity) have an important role. Thus, the breakage would occur by increasing the gradient of transpulmonary pressure, disrupting the balance between the bulla and the surrounding parenchyma.3 It may be that something common in everyday life, such as barometric variations dependent on the weather, could influence the balance between alveolar and pleural pressures, predisposing an onset of ISP. Several studies have looked for an influence of atmospheric pressure (AP), temperature changes, humidity, season, and atmospheric storms; something that would be consistent with the observation that ISP cases are grouped together.4–11 This assumption is attractive, but the published results do not provide conclusive data. This study aimed to evaluate the influence of 2 climatic factors, seasonality and AP, on the occurrence of spontaneous pneumothorax.
Materials and MethodsData were retrospectively gathered from all patients consecutively admitted with ISP diagnosis at the Hospital Príncipe de Asturias de Alcalá de Henares [Prince of Asturias of Alcalá de Henares Hospital] (Madrid), between January 1, 2002 and December 31, 2010. During this time, this hospital center was the only one in health area III of the Community of Madrid and was serving approximately 400,000 inhabitants. All first or second level emergencies would come to this center, after being evaluated by primary care.
In our center, patients with ISP>20% (distance between visceral pleura and chest wall >2cm) are admitted and treated with pleural drainage. Patients with ISP<20% remain in 24-h emergency observation; in the event of ISP progression, pleural drainage tubes are placed. In the event of ISP stability or decrease, patients are discharged with follow-up consultations.
This study included only patients treated with pleural drainage. Small pneumothorax cases seen in the emergency room (less than 20%), those under observation and those not admitted were not included. Access to these patients’ clinical information is very limited, and also, their chronology is more uncertain. Patients with secondary spontaneous pneumothorax due to COPD or previous chronic lung disease were also not included.
Each patient's AP was recorded on the day the pneumothorax was diagnosed, which was the first day of hospitalization. Mean AP was also recorded for the 3 previous days and the mean BP for the month. Measurements performed at the meteorological observatory at Barajas Airport, located 15 kilometers from Alcalá de Henares, were recorded. These data were obtained from the Agencia Estatal de Meteorología [State Meteorological Agency] (AEMET) database (http://www.aemet.es). The geographical area covered is in a great plain, with zero altitude variations and identical weather conditions.
A database was developed and then analyzed with the Stata statistics program, version 11. Cases were grouped and stratified by month, year and gender. The time series was plotted graphically; annual trend and seasonality were analyzed, and adjusted for age and gender, using generalized linear Poisson regression models.
Multi-variant analysis of the association between AP and pneumothorax occurrence, adjusted for age, gender and mean AP for the month, was performed using Poisson regression, assuming that the number of cases followed a negative binomial distribution. The association between the number of cases and mean AP for 3 days prior to admission was also analyzed. Results are expressed as incidence rate ratio (IRR) and its confidence interval (CI) of 95%. IRR is an associated risk measure similar to relative risk.
ResultsThe studied series included 288 ISP cases; all of them needed pleural drainage. Of the total, 229 (79.5%) were men and 59 (20.5%) women, with a mean age of 30.7 (±13) years. Computed tomography was performed in 94 cases (32.6%), with 83 cases (28.8%) showing apical bullae. In 63 patients (21.9%), thoracoscopy and bulla resection were performed.
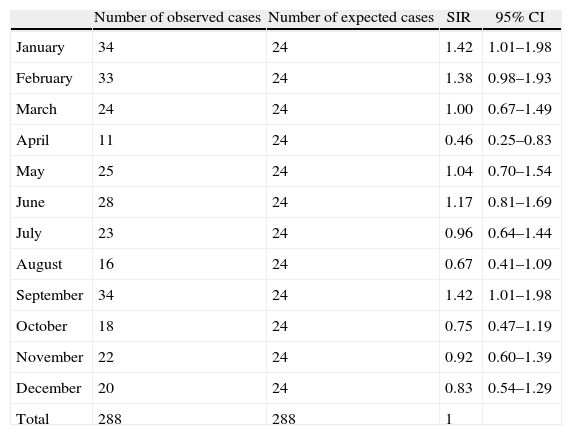
The incidence of ISP remained constant over the 9-year study. The annual trend, adjusted for age and gender, analyzed using generalized linear regression models, showed no significant variations (IRR=1.00; P=.88, data not shown in table). Monthly variations were found in the frequency of ISP approaching statistical significance (P=.10) (Fig. 1). Therefore, we grouped the same months for different years. Thus, we observed more cases than expected in a normal distribution (24 cases) in January, February and September, and smaller numbers in April (Table 1).

Number of Cases Observed Each Month.
| Number of observed cases | Number of expected cases | SIR | 95% CI | |
| January | 34 | 24 | 1.42 | 1.01–1.98 |
| February | 33 | 24 | 1.38 | 0.98–1.93 |
| March | 24 | 24 | 1.00 | 0.67–1.49 |
| April | 11 | 24 | 0.46 | 0.25–0.83 |
| May | 25 | 24 | 1.04 | 0.70–1.54 |
| June | 28 | 24 | 1.17 | 0.81–1.69 |
| July | 23 | 24 | 0.96 | 0.64–1.44 |
| August | 16 | 24 | 0.67 | 0.41–1.09 |
| September | 34 | 24 | 1.42 | 1.01–1.98 |
| October | 18 | 24 | 0.75 | 0.47–1.19 |
| November | 22 | 24 | 0.92 | 0.60–1.39 |
| December | 20 | 24 | 0.83 | 0.54–1.29 |
| Total | 288 | 288 | 1 |
SIR, standardized incidence ratio; 95% CI, 95% confidence interval.
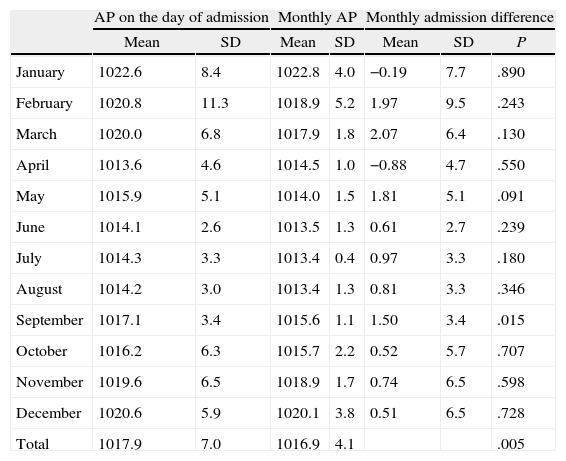
The mean AP in the days that pneumothorax occurred was 1017.9±7hPa greater than the monthly mean pressure, which was 1016.9±4.1hPa (P=.005). Table 2 shows that the difference between pressure on the day of admission and the monthly mean pressure was higher in February (1.9±9.5; P=.243), March (2.07±6.4; P=.13), May (1.81±5.1; P=.091) and September (1.5±3.4; P=.015) and was lower in April (−0.88±4.7; P=.55).
Comparison of Mean AP on the Date of Admission and Monthly Mean AP.
| AP on the day of admission | Monthly AP | Monthly admission difference | |||||
| Mean | SD | Mean | SD | Mean | SD | P | |
| January | 1022.6 | 8.4 | 1022.8 | 4.0 | −0.19 | 7.7 | .890 |
| February | 1020.8 | 11.3 | 1018.9 | 5.2 | 1.97 | 9.5 | .243 |
| March | 1020.0 | 6.8 | 1017.9 | 1.8 | 2.07 | 6.4 | .130 |
| April | 1013.6 | 4.6 | 1014.5 | 1.0 | −0.88 | 4.7 | .550 |
| May | 1015.9 | 5.1 | 1014.0 | 1.5 | 1.81 | 5.1 | .091 |
| June | 1014.1 | 2.6 | 1013.5 | 1.3 | 0.61 | 2.7 | .239 |
| July | 1014.3 | 3.3 | 1013.4 | 0.4 | 0.97 | 3.3 | .180 |
| August | 1014.2 | 3.0 | 1013.4 | 1.3 | 0.81 | 3.3 | .346 |
| September | 1017.1 | 3.4 | 1015.6 | 1.1 | 1.50 | 3.4 | .015 |
| October | 1016.2 | 6.3 | 1015.7 | 2.2 | 0.52 | 5.7 | .707 |
| November | 1019.6 | 6.5 | 1018.9 | 1.7 | 0.74 | 6.5 | .598 |
| December | 1020.6 | 5.9 | 1020.1 | 3.8 | 0.51 | 6.5 | .728 |
| Total | 1017.9 | 7.0 | 1016.9 | 4.1 | .005 | ||
SD, standard deviation; AP, atmospheric pressure.
Fig. 2 graphically shows AP progression on the day of admission and monthly mean pressure. Note how the line representing the mean pressure on ISP day is almost every month above the line representing monthly mean pressure. Furthermore, on a column chart, the number of ISP cases occurring each month is superimposed. In the months when there were more ISP cases, AP increased and the pressure difference was greater.

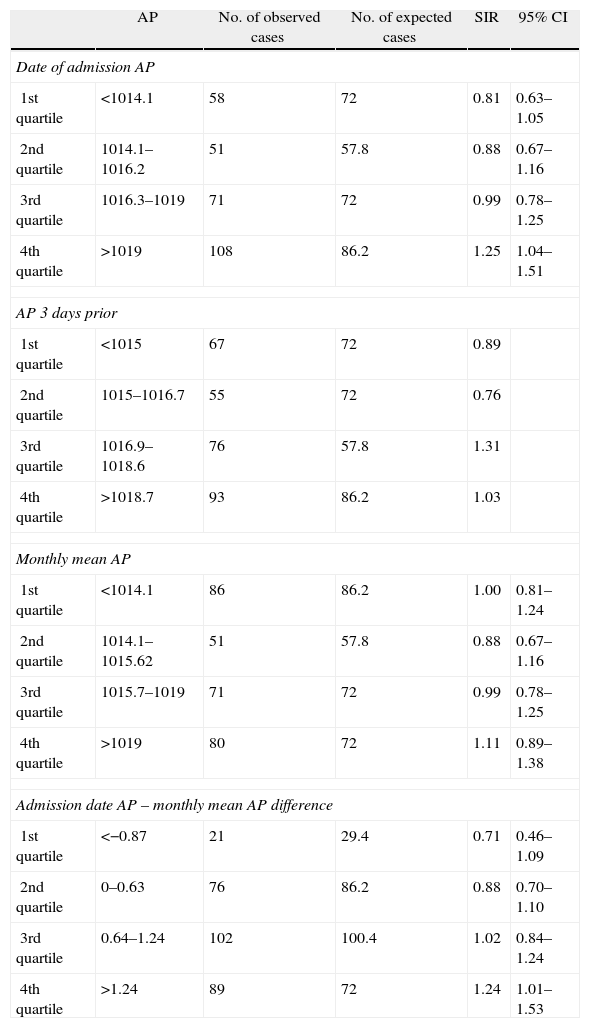
Table 3 shows the univariate analysis of the association between AP and the incidence of pneumothorax. Pressure values on the day of admission, pressure in the 3 days prior and monthly pressure were measured as discontinuous variables and classified into 4 categories according to their distribution in quartiles. It was noted that the higher the AP, the greater the amount of ISP. When the AP was lower than 1014hPa, the cases recorded were fewer than those expected to be found statistically (58/72 cases). Conversely, when the pressure was higher than 1019hPa, more cases than expected (109/82 cases) were recorded. Furthermore, the strength of the association showed a progressive increase from the first quartile (SIR=0.81; 95% CI: 0.63–1.05) up to the fourth quartile (SIR=1.25; 95% CI: 1.04–1.51). No relationship was observed between the number of pneumothorax cases and the AP taken 3 days before admission.
Univariate Analysis of the Relationship Between Pneumothorax and AP.
| AP | No. of observed cases | No. of expected cases | SIR | 95% CI | |
| Date of admission AP | |||||
| 1st quartile | <1014.1 | 58 | 72 | 0.81 | 0.63–1.05 |
| 2nd quartile | 1014.1–1016.2 | 51 | 57.8 | 0.88 | 0.67–1.16 |
| 3rd quartile | 1016.3–1019 | 71 | 72 | 0.99 | 0.78–1.25 |
| 4th quartile | >1019 | 108 | 86.2 | 1.25 | 1.04–1.51 |
| AP 3 days prior | |||||
| 1st quartile | <1015 | 67 | 72 | 0.89 | |
| 2nd quartile | 1015–1016.7 | 55 | 72 | 0.76 | |
| 3rd quartile | 1016.9–1018.6 | 76 | 57.8 | 1.31 | |
| 4th quartile | >1018.7 | 93 | 86.2 | 1.03 | |
| Monthly mean AP | |||||
| 1st quartile | <1014.1 | 86 | 86.2 | 1.00 | 0.81–1.24 |
| 2nd quartile | 1014.1–1015.62 | 51 | 57.8 | 0.88 | 0.67–1.16 |
| 3rd quartile | 1015.7–1019 | 71 | 72 | 0.99 | 0.78–1.25 |
| 4th quartile | >1019 | 80 | 72 | 1.11 | 0.89–1.38 |
| Admission date AP – monthly mean AP difference | |||||
| 1st quartile | <−0.87 | 21 | 29.4 | 0.71 | 0.46–1.09 |
| 2nd quartile | 0–0.63 | 76 | 86.2 | 0.88 | 0.70–1.10 |
| 3rd quartile | 0.64–1.24 | 102 | 100.4 | 1.02 | 0.84–1.24 |
| 4th quartile | >1.24 | 89 | 72 | 1.24 | 1.01–1.53 |
95% CI, 95% confidence interval; AP, atmospheric pressure; SIR, standardized incidence ratio.
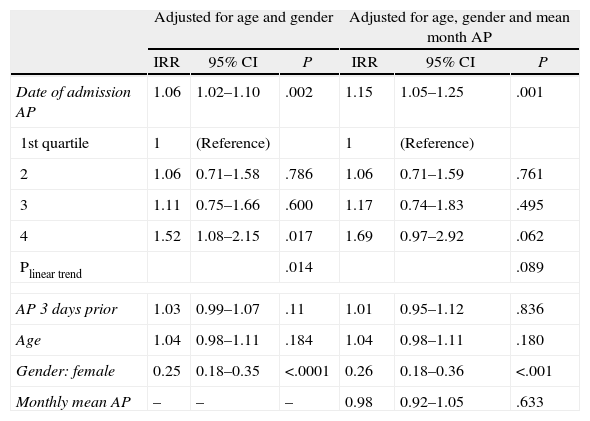
Table 4 analyzes the association between the onset of ISP and AP, taking into account the effect of other coinciding variables. ISP risk increased 1.15 times (95% CI: 1.05–1.25; P=.001) per each hPa of increasing AP on the day of admission, regardless of the effect of gender, age, and monthly mean AP. We repeated this analysis, but taking the AP as a qualitative variable. We noted that the effect of AP on the incidence of pneumothorax showed a dose–response relationship, with progressive increases (IRR=1.06 when the pressure was 1014–1016hPa; 1.17 when the pressure was 1016–1019hPa and 1.69 when the pressure was higher than 1019hPa), with a linear trend at the limit of statistical significance (trend P=.089).
Effect of Pressure on Pneumothorax Incidence. Results Adjusted for Gender, Age and Monthly Mean AP.
| Adjusted for age and gender | Adjusted for age, gender and mean month AP | |||||
| IRR | 95% CI | P | IRR | 95% CI | P | |
| Date of admission AP | 1.06 | 1.02–1.10 | .002 | 1.15 | 1.05–1.25 | .001 |
| 1st quartile | 1 | (Reference) | 1 | (Reference) | ||
| 2 | 1.06 | 0.71–1.58 | .786 | 1.06 | 0.71–1.59 | .761 |
| 3 | 1.11 | 0.75–1.66 | .600 | 1.17 | 0.74–1.83 | .495 |
| 4 | 1.52 | 1.08–2.15 | .017 | 1.69 | 0.97–2.92 | .062 |
| Plinear trend | .014 | .089 | ||||
| AP 3 days prior | 1.03 | 0.99–1.07 | .11 | 1.01 | 0.95–1.12 | .836 |
| Age | 1.04 | 0.98–1.11 | .184 | 1.04 | 0.98–1.11 | .180 |
| Gender: female | 0.25 | 0.18–0.35 | <.0001 | 0.26 | 0.18–0.36 | <.001 |
| Monthly mean AP | – | – | – | 0.98 | 0.92–1.05 | .633 |
95% CI, 95% confidence interval; AP, atmospheric pressure; SIR, standardized incidence ratio.
Data from our study show that AP influences the onset of ISP. ISP risk increases 1.15 times (95% CI: 1.05–1.25; P=.001) per each hPa of increasing AP, regardless of the effect of gender, age and monthly mean pressure. The risk increases progressively when analyzing AP as a qualitative variable, distinguishing 4 categories, with values very close to statistical significance: IRR=1.06 when the pressure was 1014–1016hPa; 1.17 when the pressure was 1016–1019hPa; and 1.69 when the pressure was greater than 1019hPa (trend P=.089).
Moreover, the occurrence of ISP is not evenly distributed throughout all the months of the year; rather, it runs parallel to AP progression. Indeed, we found more cases in January, February and September; in Spain, these periods have a stable climate and greater AP, i.e., cold and anticyclonic weather.12 We also found fewer cases in April, which is less stable and with lower AP.
In a study by Alifano et al.,10 they found that pneumothorax cases usually occurred chronologically grouped to form “clusters”; these cases usually occur in groups of 2–3 subjects, in short periods of 2–4 days, followed by a period where new cases were not detected; this had already been observed in previous studies.5,7,8 These “clusters” are closely related to significant variations between AP and the ISP onset day and the day before.
Studies are contradictory with regard to seasonality. Accard et al.9 found an increase in cases between November and February. Bulajich et al.6 list the occurrence of spontaneous pneumothorax in anticyclonic situations and cold front passages. They have even tried to relate it to certain special weather situations.13,14 There are many similarities with our study, although these results do not conform entirely to those obtained in our study. It should be noted that the geographical areas are not the same. Many other studies fail to demonstrate a seasonal relationship.10
Obuchi et al.15 mention the “meteoropathic mechanism”, relating it to other studies with a similar approach, in which the meteorological changes relate to certain diseases.16,17
If we consider that AP usually varies between 995 and 1025hPa, which are daily oscillations of about 5hPa, and that seasonal differences are 15–20hPa, then a 1hPa AP increase is not so small in relative terms, as they represent a 5% increase. However, it seems unlikely to be only a direct action of pressure,8,10 a factor that also occurs in scuba diving. The variation in AP is, firstly, due to the large difference in the pressure change magnitude (several atmospheres compared to some hPa), and, secondly, due to the fact that each breath has a point where air pressure is equalized in the bronchial tree with atmospheric air. Moreover, there is evidence of histopathological changes in the lung that has suffered ISP, including “emphysema type” changes, increased pleural permeability and inflammation18; this would explain the occurrence of pneumothorax in patients failing to show macroscopic blisters. We believe that these histologic changes would be enhanced by the effect of particular weather conditions, among other factors.
To give an explanation to the fact that these cold month periods showing an increase in AP (anticyclonic time) are related to the onset of ISP, we present the following hypothesis. Atmospheric air is heated and humidified progressively in a physiological way reaching alveoli, until body temperature is 36.5°C and a partial water vapor pressure of about 63hPa19 is reached; this leads to the gas absorbing an amount of energy. According to the kinetic gas theory, the increase in kinetic energy would result in an increase of the product of pressure and volume. Therefore, the gas pressure expands and increases.20
The colder and drier atmospheric air requires a higher energy absorption to reach steam temperature and pressure that have a higher temperature and humidity; this produces a greater change in volume. Under basal conditions, the pressure difference between alveoli and the pleural cavity oscillates around 3–4hPa, although the difference is modified by respiratory movements. Considering that a significant portion of these patients have bullae, the latter progressively become larger with each ventilation and their walls become thinner with increasing volume. At equal pressures, bulla walls suffer greater stress than alveoli walls, given that a sphere's surface tension is directly proportional to its radius, based on the Laplace-Young formula, further increasing volume and leading to critical thinning with gas permeability, and even breakage.
This study has some limitations. First, because it is a retrospective study, we do not know certain epidemiological data, and especially, what was the exact date of ISP onset. It is possible that the diagnosis date and actual date of the onset of pneumothorax do not match. Clinical history does not always reflect that information. Therefore, we preferred selecting the diagnosis date as the reference date, since it is objective and verifiable information for all cases. Moreover, patients with small pneumothorax and those under observation without hospitalization were not taken into account, since the available clinical information of these patients is uneven and incomplete. We do not believe that excluding this group would have an influence on the final results. Logically, small ISP shares the same pathogenesis with larger ISP. So, in principle, the results could be considered extrapolated. Finally, it would have been interesting to have taken into account a more extensive battery of climatological data: temperature and humidity.
The data presented indicate that the increase in AP is a risk factor for the onset of ISP. Study limitations do not allow us to definitely quantify the weight of the effect of AP. Future studies must examine the influence of other contributing factors.
Conflict of InterestThe authors declare that they have no conflict of interest.
Please cite this article as: Díaz R, Díez MM, Medrano MJ, Vera C, Guillamot P, Sánchez A, et al. Influencia de la presión atmosférica sobre la incidencia de neumotórax espontáneo. 2014;92(6):415–420.
