


The purpose of this prospective multicentre multilevel study was to investigate the influence of hospital caseload on long-term outcomes following standardization of rectal cancer surgery in the Rectal Cancer Project of the Spanish Society of Surgeons.
MethodsData relating to 2910 consecutive patients with rectal cancer treated for cure between March 2006 and March 2010 were recorded in a prospective database. Hospitals were classified according to number of patients treated per year as low-volume, intermediate-volume, or high volume hospitals (12–23, 24–35, or ≥36 procedures per year).
ResultsAfter a median follow-up of 5 years, cumulative rates of local recurrence, metastatic recurrence and overall survival were 6.6 (95% CI 5.6–7.6), 20.3 (95% CI 18.8–21.9) and 73.0 (95% CI 74.7–71.3) respectively. In the multilevel regression analysis overall survival was higher for patients treated at hospitals with an annual caseload of 36 or more patients (HR 0.727 [95% CI 0.556–0.951]; P=.02). The risk of local recurrence and metastases were not related to the caseload. Moreover, there was a statistically significant variation in overall survival (median hazard ratio [MHR] 1.184 [95% CI 1.071–1333]), local recurrence (MHR 1.308 [95% CI 1.010–1.668]) and metastases (MHR 1.300 [95% CI 1.181; 1.476]) between all hospitals.
ConclusionsOverall survival was higher for patients treated at hospitals with an annual caseload of 36 or more patients. However, local recurrence was not influenced by caseload.
Determinar la influencia del volumen quirúrgico en los resultados oncológicos del Proyecto del Cáncer de Recto de la Asociación Española de Cirujanos.
MétodosSe incluyeron 2.910 pacientes consecutivos tratados con una operación curativa entre marzo de 2006 y marzo de 2010 en 36 hospitales. Los hospitales se clasificaron según el número de pacientes operados por año en: pequeños (12-23), intermedios (24-35) y grandes (≥ 36).
ResultadosCon un seguimiento de al menos cinco años la incidencia acumulada de recidiva local fue 6,6 (IC 95% 5,6-7,6), la de metástasis 20,3 (IC 95% 18,8-21,9) y la de supervivencia global 73,0 (IC 95% 74,7-71,3). En el análisis de regresión multinivel, la supervivencia global fue mayor en los hospitales que operaban 36 o más pacientes [HR 0,727 (IC 95% 0,556-0,951); p=0,02]. El riesgo de recidiva local y metástasis no se relacionó con el volumen quirúrgico. Además, hubo una variación significativa en las tasas de supervivencia global (mediana hazard ratio [MHR] 1,184 [IC 95% 1,071-1,333]), recidiva local (MHR 1,308 [IC 95% 1,010-1,668]) y metástasis (MHR 1,300 [IC 95% 1,181-1,476]) entre todos los hospitales.
ConclusionesEn los grupos multidisciplinares seleccionados e incluidos en el proyecto de la Asociación Española de Cirujanos, que incluye la enseñanza de la escisión total del mesorrecto y la realimentación de los resultados, la supervivencia global es mayor en los hospitales con mayor volumen quirúrgico, y la variabilidad interhospitalaria de la tasa de recidiva local no se explica por el volumen quirúrgico.
The influence of the surgical volumes of hospitals and surgeons, as well as surgeons’ specialties, on the oncological results of colon and rectal cancer surgery has been the focus of several studies. The latest meta-analysis1 published about this topic, which included 51 European and American studies, demonstrated that hospitals with higher surgical volumes had better 5-year survival rates. However, the results also suggested great variability among the hospitals of the countries included. Studies done in countries that have established teaching programs with multidisciplinary groups and registries of rectal cancer surgery outcomes have demonstrated the influence of surgical volume on survival and local recurrence.2,3 The aim of this study was to assess the influence of surgical volume on the oncological results at hospitals participating in the Rectal Cancer Project of the Spanish Association of Surgeons (AEC).
MethodsThis multicenter observational study has been conducted with the prospective database of the Rectal Cancer Project of the AEC. This teaching initiative was started in 2006 with the aim to initially compile the results from mesorectal excision surgery (which later included extended abdominoperineal amputation) from multidisciplinary groups at hospitals of the National Healthcare System that requested inclusion and met the required conditions: coloproctology units with the means for essential diagnostic techniques that performed 12 or more resections per year.
The data collected prospectively at the hospitals by surgeons in charge of the project were sent to a centralized registry, which made annual reports for each of the hospitals of the outcomes of their activity compared to the overall results of the participating hospitals. A more detailed description of the project has been published previously.4
Inclusion and Exclusion Criteria of the PatientsWe included patients who underwent one of the three following elective surgeries: anterior resection (AR), abdominoperineal resection (APR) and Hartmann's procedure. The study was conducted from March 1, 2006 to March 1, 2010 at the first 36 hospitals included in the project that met the required conditions.
Excluded from the study were patients treated with emergency surgery, those for whom no results were available for one of the variables of interest, and those with incongruent results.
Study VariablesThe outcome variables studied were: local recurrence (LR), metastasis (M) that appeared during follow-up and overall survival (OS). Confounding variables were defined as either set or random. The following were considered set confounding variables: age, categorized in 3 groups (<65, 65–80, >80 years); sex; severity of surgical risk (measured by the ASA anesthesia risk classification); tumor location, categorized in 3 groups (0–6, 7–12, 13–15cm); type of mesorectal excision (partial or total); type of resection (AR, APR, Hartmann procedure); pathological tumor stage and lymphadenopathies; state of circumferential resection margins (CRM); intraoperative perforation; use of neoadjuvant therapy; and the hospital case load, categorized into 3 groups according to the mean number of patients treated annually (12–23, 24–35, and ≥36 patients). The hospital was considered a random confounding variable.
DefinitionsRectal tumors were defined as those situated in the last 15cm measured from the anal margin by means of rigid rectoscopy or magnetic resonance.5
Resection was considered curative when there was no invasion or when it was microscopic in both distal and circumferential margins (R0 and R1), in absence of metastasis.
The pathological tumor stage was classified with the fifth version of the TNM classification (American Joint Committee on Cancer stages I–IV, 5th Edition).6 Intraoperative perforation was defined as any defect of the rectal wall that provided contact of the rectal lumen with the surface. The CRM was considered invaded if neoplastic cells were found ≤1mm away in the pathologic study.
LR was defined as the reappearance of disease in the pelvis, including: anastomosis and perineal wound, regardless of whether the patient had distant metastasis. Isolated recurrence in the ovaries was considered metastasis.
As the hospital and patient data were anonymous, approval from the Ethics Committee of the participating hospitals was not considered necessary, although the project had been endorsed by these committees.
Statistical AnalysisCategorical variables were analyzed with the χ2-test and the comparison of the quantitative variables involved the Mann–Whitney U test. The results related with the accumulated incidence for LR, M and OS were presented as the total number of events (patients were considered at risk for presenting the events indicated until: death, loss to follow-up due to change of residence, or the end of follow-up after 5 years). The incidence of these events was estimated with the Kaplan–Meier method.
To determine the variation of the outcome variables LR, M and OS among the hospitals included, a multi-level analysis was created, constructed of 3 models: a model of fixed effect that included the set confounding variables, a complete model that included the set of confounding variables and the random hospital variable, and a null model that only included the random hospital variable. In the first, a Cox regression was used, while in the latter two a multilevel Cox regression model was used. All the variables were included in the univariate, multivariate and multilevel studies.
For each model, the Akaike information criterion (AIC)7 and the deviance test were calculated. In the multilevel models, we calculated the random variance (δ2) with confidence intervals, mean hazard ratio (MHR)8 and the hazard ratio between the worst and best, excluding 5% of the extreme centers. The MHR quantifies the variation between hospitals by comparing randomly selected pairs of patients with the same values as the confounding variables.9
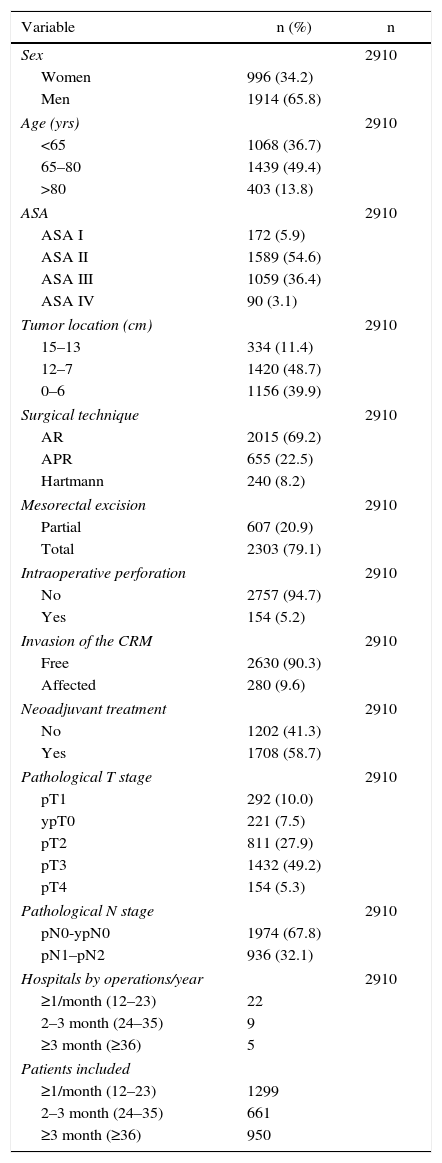
ResultsBetween March 2006 and March 2010, 3222 consecutive patients diagnosed with rectal cancer were treated with rectal resection in the first 36 hospitals that complied with the requirements of the Rectal Cancer Project of the AEC. In 2983 patients, the operation was considered curative; 2910 patients (97.6%) survived the operation and were included in the analysis of the oncologic results. The characteristics of this cohort of patients are shown in Table 1. In 2015 patients (69.2%), AR was used, 655 (22.5%) were treated with APR and 240 (8.2%) with a Hartmann procedure. Some type of complication was diagnosed in 1233 patients (42.4%); anastomotic dehiscence occurred in 183 patients (6.1%), and reoperation was necessary in 216 (7.4%) patients.
Description of the Sample Studied.
| Variable | n (%) | n |
|---|---|---|
| Sex | 2910 | |
| Women | 996 (34.2) | |
| Men | 1914 (65.8) | |
| Age (yrs) | 2910 | |
| <65 | 1068 (36.7) | |
| 65–80 | 1439 (49.4) | |
| >80 | 403 (13.8) | |
| ASA | 2910 | |
| ASA I | 172 (5.9) | |
| ASA II | 1589 (54.6) | |
| ASA III | 1059 (36.4) | |
| ASA IV | 90 (3.1) | |
| Tumor location (cm) | 2910 | |
| 15–13 | 334 (11.4) | |
| 12–7 | 1420 (48.7) | |
| 0–6 | 1156 (39.9) | |
| Surgical technique | 2910 | |
| AR | 2015 (69.2) | |
| APR | 655 (22.5) | |
| Hartmann | 240 (8.2) | |
| Mesorectal excision | 2910 | |
| Partial | 607 (20.9) | |
| Total | 2303 (79.1) | |
| Intraoperative perforation | 2910 | |
| No | 2757 (94.7) | |
| Yes | 154 (5.2) | |
| Invasion of the CRM | 2910 | |
| Free | 2630 (90.3) | |
| Affected | 280 (9.6) | |
| Neoadjuvant treatment | 2910 | |
| No | 1202 (41.3) | |
| Yes | 1708 (58.7) | |
| Pathological T stage | 2910 | |
| pT1 | 292 (10.0) | |
| ypT0 | 221 (7.5) | |
| pT2 | 811 (27.9) | |
| pT3 | 1432 (49.2) | |
| pT4 | 154 (5.3) | |
| Pathological N stage | 2910 | |
| pN0-ypN0 | 1974 (67.8) | |
| pN1–pN2 | 936 (32.1) | |
| Hospitals by operations/year | 2910 | |
| ≥1/month (12–23) | 22 | |
| 2–3 month (24–35) | 9 | |
| ≥3 month (≥36) | 5 | |
| Patients included | ||
| ≥1/month (12–23) | 1299 | |
| 2–3 month (24–35) | 661 | |
| ≥3 month (≥36) | 950 | |
AR: anterior resection of the rectum; APR: abdominoperineal resection; CRM: circumferential resection margin.
With a follow-up of at least five years, the accumulated incidence of LR was: 6.6 (95% CI 5.6–7.6), M: 20.3 (95% CI 18.7–21.8) and OS: 72.9 (95% CI 74.6–71.2). The rates of the oncologic results according to hospital volume (small, medium, large) were the following: LR 7.8, 6.1, 5.2%; M 21.8, 22.7, 17.7%; and OS 69.6, 73.7, 76.1%.
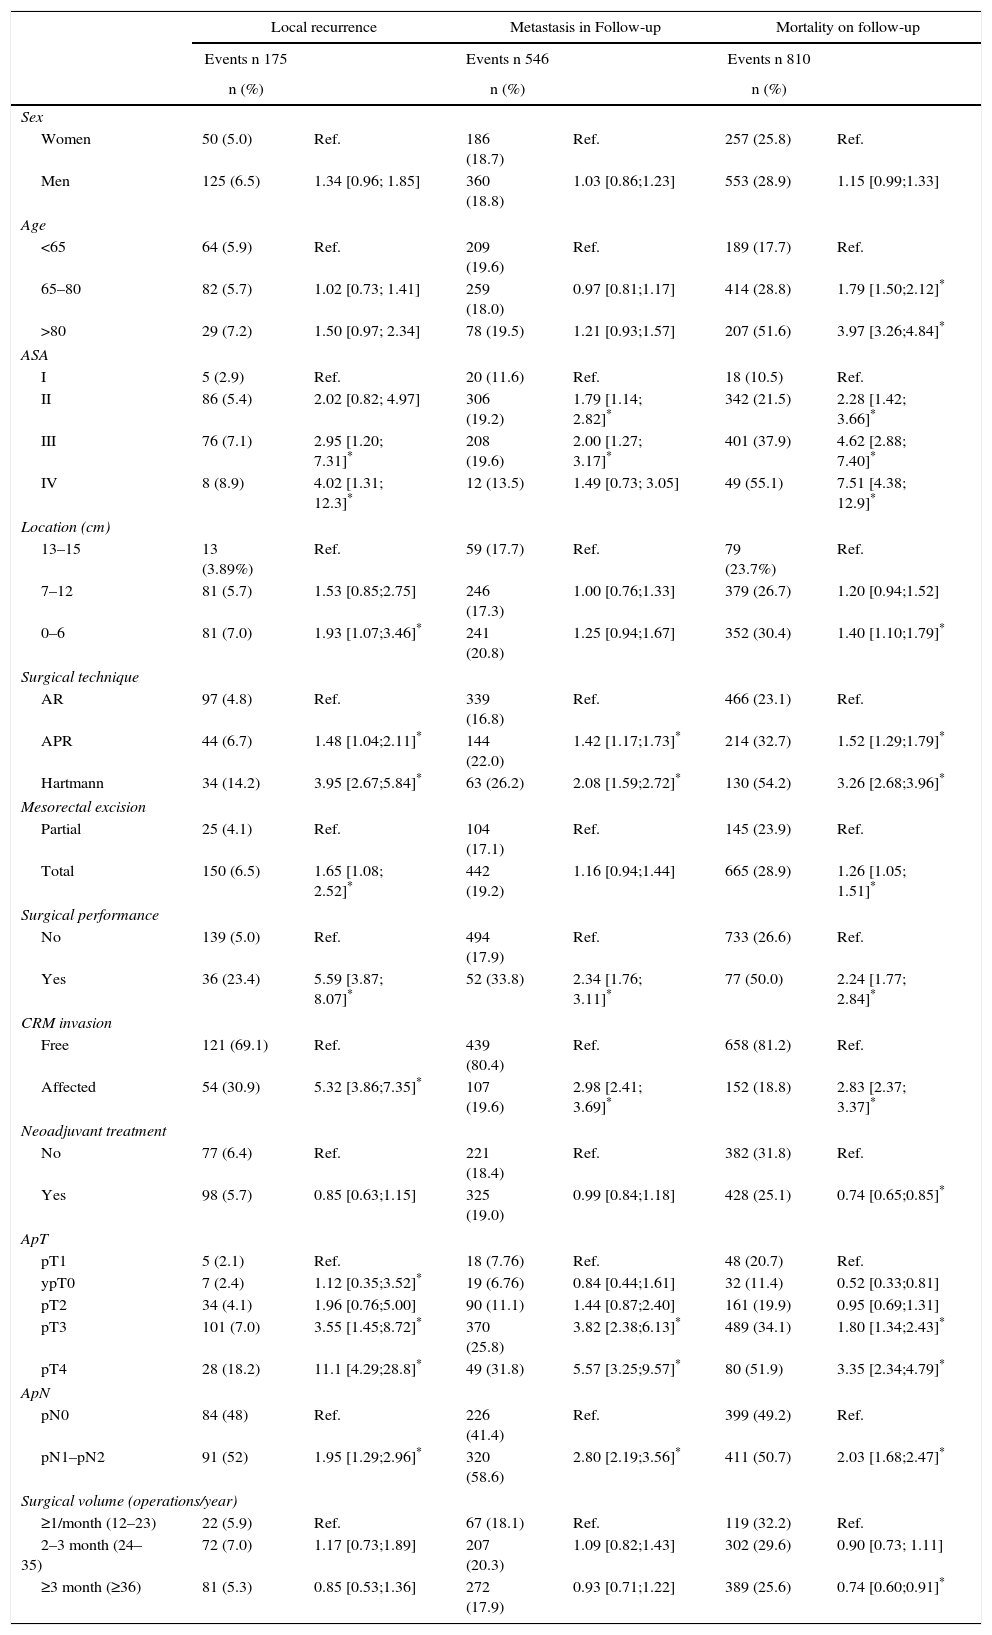
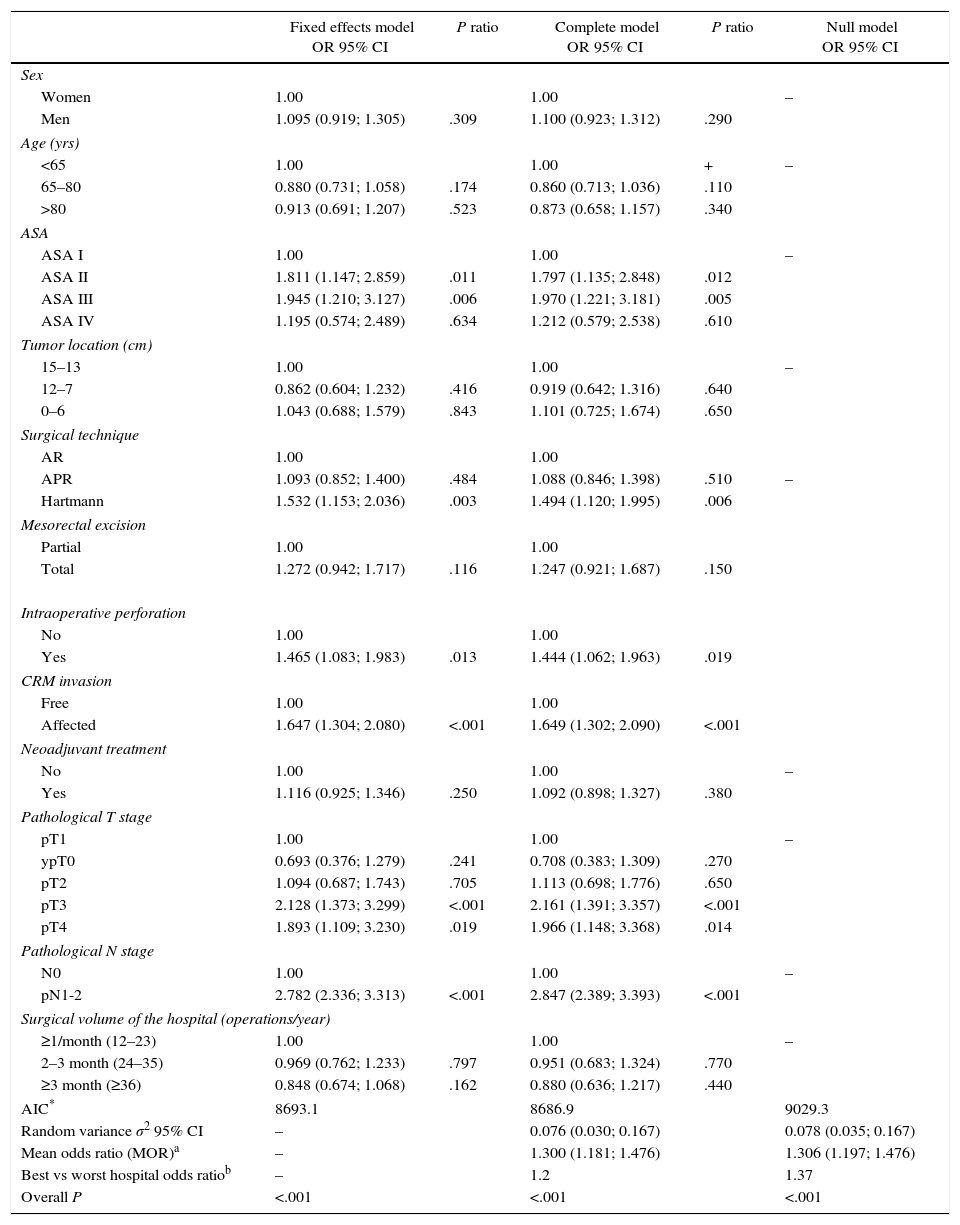
The results of the univariate analyses are shown in Table 2. The multivariate and multilevel analyses showed a significant effect of annual surgical volume in the OS rates between hospitals that operated on less than 36 patients and those that treated 36 or more (Table 3). None of the analyses showed evidence of the influence of surgical volume on LR (Table 4) or the appearance of M (Table 5). Furthermore, it was observed that LR varied among hospitals, regardless of the annual surgical volume (Fig. 1).
Result of the Univariate Analysis of the Population Sample Studied (n=2910).
| Local recurrence | Metastasis in Follow-up | Mortality on follow-up | ||||
|---|---|---|---|---|---|---|
| Events n 175 | Events n 546 | Events n 810 | ||||
| n (%) | n (%) | n (%) | ||||
| Sex | ||||||
| Women | 50 (5.0) | Ref. | 186 (18.7) | Ref. | 257 (25.8) | Ref. |
| Men | 125 (6.5) | 1.34 [0.96; 1.85] | 360 (18.8) | 1.03 [0.86;1.23] | 553 (28.9) | 1.15 [0.99;1.33] |
| Age | ||||||
| <65 | 64 (5.9) | Ref. | 209 (19.6) | Ref. | 189 (17.7) | Ref. |
| 65–80 | 82 (5.7) | 1.02 [0.73; 1.41] | 259 (18.0) | 0.97 [0.81;1.17] | 414 (28.8) | 1.79 [1.50;2.12]* |
| >80 | 29 (7.2) | 1.50 [0.97; 2.34] | 78 (19.5) | 1.21 [0.93;1.57] | 207 (51.6) | 3.97 [3.26;4.84]* |
| ASA | ||||||
| I | 5 (2.9) | Ref. | 20 (11.6) | Ref. | 18 (10.5) | Ref. |
| II | 86 (5.4) | 2.02 [0.82; 4.97] | 306 (19.2) | 1.79 [1.14; 2.82]* | 342 (21.5) | 2.28 [1.42; 3.66]* |
| III | 76 (7.1) | 2.95 [1.20; 7.31]* | 208 (19.6) | 2.00 [1.27; 3.17]* | 401 (37.9) | 4.62 [2.88; 7.40]* |
| IV | 8 (8.9) | 4.02 [1.31; 12.3]* | 12 (13.5) | 1.49 [0.73; 3.05] | 49 (55.1) | 7.51 [4.38; 12.9]* |
| Location (cm) | ||||||
| 13–15 | 13 (3.89%) | Ref. | 59 (17.7) | Ref. | 79 (23.7%) | Ref. |
| 7–12 | 81 (5.7) | 1.53 [0.85;2.75] | 246 (17.3) | 1.00 [0.76;1.33] | 379 (26.7) | 1.20 [0.94;1.52] |
| 0–6 | 81 (7.0) | 1.93 [1.07;3.46]* | 241 (20.8) | 1.25 [0.94;1.67] | 352 (30.4) | 1.40 [1.10;1.79]* |
| Surgical technique | ||||||
| AR | 97 (4.8) | Ref. | 339 (16.8) | Ref. | 466 (23.1) | Ref. |
| APR | 44 (6.7) | 1.48 [1.04;2.11]* | 144 (22.0) | 1.42 [1.17;1.73]* | 214 (32.7) | 1.52 [1.29;1.79]* |
| Hartmann | 34 (14.2) | 3.95 [2.67;5.84]* | 63 (26.2) | 2.08 [1.59;2.72]* | 130 (54.2) | 3.26 [2.68;3.96]* |
| Mesorectal excision | ||||||
| Partial | 25 (4.1) | Ref. | 104 (17.1) | Ref. | 145 (23.9) | Ref. |
| Total | 150 (6.5) | 1.65 [1.08; 2.52]* | 442 (19.2) | 1.16 [0.94;1.44] | 665 (28.9) | 1.26 [1.05; 1.51]* |
| Surgical performance | ||||||
| No | 139 (5.0) | Ref. | 494 (17.9) | Ref. | 733 (26.6) | Ref. |
| Yes | 36 (23.4) | 5.59 [3.87; 8.07]* | 52 (33.8) | 2.34 [1.76; 3.11]* | 77 (50.0) | 2.24 [1.77; 2.84]* |
| CRM invasion | ||||||
| Free | 121 (69.1) | Ref. | 439 (80.4) | Ref. | 658 (81.2) | Ref. |
| Affected | 54 (30.9) | 5.32 [3.86;7.35]* | 107 (19.6) | 2.98 [2.41; 3.69]* | 152 (18.8) | 2.83 [2.37; 3.37]* |
| Neoadjuvant treatment | ||||||
| No | 77 (6.4) | Ref. | 221 (18.4) | Ref. | 382 (31.8) | Ref. |
| Yes | 98 (5.7) | 0.85 [0.63;1.15] | 325 (19.0) | 0.99 [0.84;1.18] | 428 (25.1) | 0.74 [0.65;0.85]* |
| ApT | ||||||
| pT1 | 5 (2.1) | Ref. | 18 (7.76) | Ref. | 48 (20.7) | Ref. |
| ypT0 | 7 (2.4) | 1.12 [0.35;3.52]* | 19 (6.76) | 0.84 [0.44;1.61] | 32 (11.4) | 0.52 [0.33;0.81] |
| pT2 | 34 (4.1) | 1.96 [0.76;5.00] | 90 (11.1) | 1.44 [0.87;2.40] | 161 (19.9) | 0.95 [0.69;1.31] |
| pT3 | 101 (7.0) | 3.55 [1.45;8.72]* | 370 (25.8) | 3.82 [2.38;6.13]* | 489 (34.1) | 1.80 [1.34;2.43]* |
| pT4 | 28 (18.2) | 11.1 [4.29;28.8]* | 49 (31.8) | 5.57 [3.25;9.57]* | 80 (51.9) | 3.35 [2.34;4.79]* |
| ApN | ||||||
| pN0 | 84 (48) | Ref. | 226 (41.4) | Ref. | 399 (49.2) | Ref. |
| pN1–pN2 | 91 (52) | 1.95 [1.29;2.96]* | 320 (58.6) | 2.80 [2.19;3.56]* | 411 (50.7) | 2.03 [1.68;2.47]* |
| Surgical volume (operations/year) | ||||||
| ≥1/month (12–23) | 22 (5.9) | Ref. | 67 (18.1) | Ref. | 119 (32.2) | Ref. |
| 2–3 month (24–35) | 72 (7.0) | 1.17 [0.73;1.89] | 207 (20.3) | 1.09 [0.82;1.43] | 302 (29.6) | 0.90 [0.73; 1.11] |
| ≥3 month (≥36) | 81 (5.3) | 0.85 [0.53;1.36] | 272 (17.9) | 0.93 [0.71;1.22] | 389 (25.6) | 0.74 [0.60;0.91]* |
AR: anterior resection of the rectum; APR; abdominoperineal resection; CRM: circumferential resection margin.
Overall Survival; Results of the Analysis of the Three Models.
| Fixed effects model OR 95% CI | P ratio | Complete model OR 95% CI | P ratio | Null model OR 95% CI | |
|---|---|---|---|---|---|
| Sex | |||||
| Women | 1.00 | 1.00 | – | ||
| Men | 1.255 (1.080; 1.459) | .003 | 1.262 (1.084; 1.468) | .003 | |
| Age (yrs) | |||||
| <65 | 1.00 | 1.00 | – | ||
| 65–80 | 1.475 (1.232; 1.766) | <.001 | 1.465 (1.223; 1.756) | <.001 | |
| >80 | 2.565 (2.058; 3.196) | <.001 | 2.558 (2.048; 3.194) | <.001 | |
| ASA | |||||
| ASA I | 1.00 | 1.00 | – | ||
| ASA II | 1.850 (1.146; 2.988) | .012 | 1.846 (1.142; 2.984) | .012 | |
| ASA III | 2.863 (1.761; 4.655) | <.001 | 2.893 (1.777; 4.711) | <.001 | |
| ASA IV | 3.717 (2.122; 6.512) | <.001 | 3.766 (2.144; 6.615) | <.001 | |
| Tumor location (cm) | |||||
| 15–13 | 1.00 | 1.00 | – | ||
| 12–7 | 1.061 (0.775; 1.451) | .713 | 1.093 (0.797; 1.499) | .580 | |
| 0–6 | 1.199 (0.833; 1.726) | .328 | 1.220 (0.845; 1.763) | .290 | |
| Surgical technique | |||||
| AR | 1.00 | 1.00 | |||
| APR | 1.071 (0.864; 1.328) | .532 | 1.057 (0.851; 1.313) | .620 | – |
| Hartmann | 1.822 (1.476; 2.249) | <.001 | 1.818 (1.469; 2.250) | <.001 | |
| Mesorectal excision | |||||
| Partial | 1.00 | 1.00 | |||
| Total | 1.304 (1.011; 1.682) | .041 | 1.299 (1.005; 1.679) | .046 | |
| Intraoperative perforation | |||||
| No | 1.00 | 1.00 | |||
| Yes | 1.478 (1.152; 1.895) | .002 | 1.438 (1.119; 1.848) | .005 | |
| CRM invasion | |||||
| Free | 1.00 | 1.00 | |||
| Affected | 1.574 (1.285; 1.928) | <.001 | 1.583 (1.290; 1.943) | <.001 | |
| Neoadjuvant treatment | |||||
| No | 1.00 | 1.00 | – | ||
| Yes | 0.992 (0.849; 1.159) | .922 | 0.982 (0.835; 1.153) | .820 | |
| Pathological T stage | |||||
| pT1 | 1.00 | 1.00 | – | ||
| ypT0 | 0.621 (0.394; 0.979) | .040 | 0.616 (0.390; 0.972) | .037 | |
| pT2 | 0.862 (0.624; 1.192) | .370 | 0.854 (0.617; 1.182) | .340 | |
| pT3 | 1.242 (0.914; 1.688) | .166 | 1.229 (0.903; 1.673) | .190 | |
| pT4 | 1.638 (1.105; 2.430) | .014 | 1.662 (1.118; 2.470) | .012 | |
| Pathological N stage | |||||
| N0 | 1.00 | 1.00 | – | ||
| pN1-2 | 2.104 (1.813; 2.441) | <.001 | 2.120 (1.826; 2.461) | <.001 | |
| Surgical volume of the hospital (operations/year) | |||||
| ≥1/month (12–23) | 1.00 | 1.00 | – | ||
| 2–3 month (24–35) | 0.856 (0.691; 1.060) | .155 | 0.858 (0.653; 1.126) | .270 | |
| ≥3 month (≥36) | 0.711 (0.578; 0.875) | .001 | 0.727 (0.556; 0.951) | .020 | |
| AIC* | 11883.1 | 11886.2 | 12431 | ||
| Random variance σ2 95% CI | – | 0.031 (0.005; 0.091) | 0.044 (0.015; 0.101) | ||
| Mean odds ratio (MOR)a | – | 1.184 (1.071; 1.333) | 1.221 (1.125; 1.354) | ||
| Best vs worst hospital odds ratiob | – | 1.17 | 1.21 | ||
| Overall P | <.001 | <.001 | <.001 | ||
AR: anterior resection of the rectum; APR: abdominoperineal resection; CRM: circumferential resection margin.
Local Recurrence; Results From the Analysis of the Three Models.
| Fixed effects model OR 95% CI | P ratio | Complete model OR 95% CI | P ratio | Null model OR 95% CI | |
|---|---|---|---|---|---|
| Sex | |||||
| Women | 1.00 | 1.00 | – | ||
| Men | 1.496 (1.071; 2.089) | .018 | 1.495 (1.069; 2.091) | .019 | |
| Age (yrs) | |||||
| <65 | 1.00 | 1.00 | – | ||
| 65–80 | 0.848 (0.600; 1.198) | .350 | 0.847 (0.598; 1.200) | .350 | |
| >80 | 0.996 (0.613; 1.617) | .987 | 0.962 (0.591; 1.567) | .880 | |
| ASA | |||||
| ASA I | 1.00 | 1.00 | – | ||
| ASA II | 1.800 (0.723; 4.479) | .207 | 1.807 (0.724; 4.510) | .210 | |
| ASA III | 2.431 (0.955; 6.190) | .062 | 2.459 (0.962; 6.283) | .060 | |
| ASA IV | 2.707 (0.848; 8.634) | .093 | 2.735 (0.852; 8.776) | .091 | |
| Tumor location (cm) | |||||
| 15–13 | 1.00 | 1.00 | – | ||
| 12–7 | 1.262 (0.626; 2.543) | .515 | 1.325 (0.658; 2.668) | .430 | |
| 0–6 | 1.820 (0.839; 3.947) | .129 | 1.887 (0.869; 4.099) | .110 | |
| Surgical technique | |||||
| AR | 1.00 | 1.00 | |||
| APR | 0.734 (0.465; 1.156) | .182 | 0.740 (0.468; 1.173) | .200 | – |
| Hartmann | 2.140 (1.390; 3.294) | <.001 | 2.189 (1.415; 3.385) | <.001 | |
| Mesorectal excision | |||||
| Partial | 1.00 | 1.00 | |||
| Total | 1.601 (0.936; 2.739) | .086 | 1.634 (0.957; 2.789) | .072 | |
| Intraoperative perforation | |||||
| No | 1.00 | 1.00 | |||
| Yes | 2.799 (1.849; 4.237) | <.001 | 2.795 (1.836; 4.255) | <.001 | |
| CRM invasion | |||||
| Free | 1.00 | 1.00 | |||
| Affected | 2.733 (1.844; 4.052) | <.001 | 2.795 (1.878; 4.159) | <.001 | |
| Neoadjuvant treatment | |||||
| No | 1.00 | 1.00 | – | ||
| Yes | 0.969 (0.698; 1.346) | .852 | 0.891 (0.636; 1.250) | .500 | |
| Pathological T stage | |||||
| pT1 | 1.00 | 1.00 | – | ||
| ypT0 | 1.187 (0.372; 3.788) | .773 | 1.210 (0.378; 3.870) | .750 | |
| pT2 | 1.718 (0.670; 4.408) | .260 | 1.751 (0.682; 4.497) | .240 | |
| pT3 | 2.191 (0.876; 5.481) | .094 | 2.211 (0.882; 5.541) | .091 | |
| pT4 | 3.321 (1.197; 9.216) | .021 | 3.411 (1.225; 9.497) | .019 | |
| Pathological N stage | |||||
| N0 | 1.00 | 1.00 | – | ||
| pN1-2 | 1.875 (1.366; 2.574) | <.001 | 1.889 (1.374; 2.596) | <.001 | |
| Surgical volume of the hospital (operations/year) | |||||
| ≥1/month (12–23) | 1.00 | 1.00 | – | ||
| 2–3 month (24–35) | 1.044 (0.643; 1.693) | .863 | 1.098 (0.630; 1.916) | .740 | |
| ≥3 month (≥36) | 0.803 (0.498; 1.294) | .367 | 0.835 (0.480; 1.452) | .520 | |
| AIC* | 2573.3 | 2577 | 2723 | ||
| Random variance σ2 95% CI | – | 0.079 (0.000; 0.288) | 0.045 (0.000; 0.222) | ||
| Median odds ratio (MOR)a | – | 1.308 (1.010; 1.668) | 1.226 (1.010; 1.568) | ||
| Best vs worst hospital odds ratiob | – | 1.25 | 1.1 | ||
| Overall P | <.001 | <.001 | <.001 | ||
AR: anterior resection of the rectum; APR: abdominoperineal resection; CRM: circumferential resection margin.
Metastasis in Follow-up; Resulted From the Analysis of the Three Models.
| Fixed effects model OR 95% CI | P ratio | Complete model OR 95% CI | P ratio | Null model OR 95% CI | |
|---|---|---|---|---|---|
| Sex | |||||
| Women | 1.00 | 1.00 | – | ||
| Men | 1.095 (0.919; 1.305) | .309 | 1.100 (0.923; 1.312) | .290 | |
| Age (yrs) | |||||
| <65 | 1.00 | 1.00 | + | – | |
| 65–80 | 0.880 (0.731; 1.058) | .174 | 0.860 (0.713; 1.036) | .110 | |
| >80 | 0.913 (0.691; 1.207) | .523 | 0.873 (0.658; 1.157) | .340 | |
| ASA | |||||
| ASA I | 1.00 | 1.00 | – | ||
| ASA II | 1.811 (1.147; 2.859) | .011 | 1.797 (1.135; 2.848) | .012 | |
| ASA III | 1.945 (1.210; 3.127) | .006 | 1.970 (1.221; 3.181) | .005 | |
| ASA IV | 1.195 (0.574; 2.489) | .634 | 1.212 (0.579; 2.538) | .610 | |
| Tumor location (cm) | |||||
| 15–13 | 1.00 | 1.00 | – | ||
| 12–7 | 0.862 (0.604; 1.232) | .416 | 0.919 (0.642; 1.316) | .640 | |
| 0–6 | 1.043 (0.688; 1.579) | .843 | 1.101 (0.725; 1.674) | .650 | |
| Surgical technique | |||||
| AR | 1.00 | 1.00 | |||
| APR | 1.093 (0.852; 1.400) | .484 | 1.088 (0.846; 1.398) | .510 | – |
| Hartmann | 1.532 (1.153; 2.036) | .003 | 1.494 (1.120; 1.995) | .006 | |
| Mesorectal excision | |||||
| Partial | 1.00 | 1.00 | |||
| Total | 1.272 (0.942; 1.717) | .116 | 1.247 (0.921; 1.687) | .150 | |
| Intraoperative perforation | |||||
| No | 1.00 | 1.00 | |||
| Yes | 1.465 (1.083; 1.983) | .013 | 1.444 (1.062; 1.963) | .019 | |
| CRM invasion | |||||
| Free | 1.00 | 1.00 | |||
| Affected | 1.647 (1.304; 2.080) | <.001 | 1.649 (1.302; 2.090) | <.001 | |
| Neoadjuvant treatment | |||||
| No | 1.00 | 1.00 | – | ||
| Yes | 1.116 (0.925; 1.346) | .250 | 1.092 (0.898; 1.327) | .380 | |
| Pathological T stage | |||||
| pT1 | 1.00 | 1.00 | – | ||
| ypT0 | 0.693 (0.376; 1.279) | .241 | 0.708 (0.383; 1.309) | .270 | |
| pT2 | 1.094 (0.687; 1.743) | .705 | 1.113 (0.698; 1.776) | .650 | |
| pT3 | 2.128 (1.373; 3.299) | <.001 | 2.161 (1.391; 3.357) | <.001 | |
| pT4 | 1.893 (1.109; 3.230) | .019 | 1.966 (1.148; 3.368) | .014 | |
| Pathological N stage | |||||
| N0 | 1.00 | 1.00 | – | ||
| pN1-2 | 2.782 (2.336; 3.313) | <.001 | 2.847 (2.389; 3.393) | <.001 | |
| Surgical volume of the hospital (operations/year) | |||||
| ≥1/month (12–23) | 1.00 | 1.00 | – | ||
| 2–3 month (24–35) | 0.969 (0.762; 1.233) | .797 | 0.951 (0.683; 1.324) | .770 | |
| ≥3 month (≥36) | 0.848 (0.674; 1.068) | .162 | 0.880 (0.636; 1.217) | .440 | |
| AIC* | 8693.1 | 8686.9 | 9029.3 | ||
| Random variance σ2 95% CI | – | 0.076 (0.030; 0.167) | 0.078 (0.035; 0.167) | ||
| Mean odds ratio (MOR)a | – | 1.300 (1.181; 1.476) | 1.306 (1.197; 1.476) | ||
| Best vs worst hospital odds ratiob | – | 1.2 | 1.37 | ||
| Overall P | <.001 | <.001 | <.001 | ||
AR: anterior resection of the rectum; APR: abdominoperineal resection; CRM: circumferential resection margin.

Risk of local recurrence for each of the hospitals. Each point is a hospital according to its caseload as mean number of patients treated surgically per year and the value in percentage obtained with the Kaplan–Meier. The line is a local regression to outline the trend of the correlation between the response variable and the surgical volume. The shaded area represents the 95% CI.
Invasion of the CRM, intraoperative perforation, Hartmann procedure, stage pT4 and the presence of lymph metastases (pN1, pN2) were related with all the outcome variables (Tables 3–5). Male sex was associated with OS (Table 3) and LR (Table 4). The ASA grade correlated with OS and the appearance of M (Tables 3 and 5). Lastly, age was related with OS (Table 3) and stage pT3 with the appearance of M (Table 5).
The multilevel analysis showed a significant variation among the hospitals in the rates of OS (MHR 1.184 [95% CI 1.071; 1.333]), LR (MHR 1.308 [95% CI 1.010; 1.668]), and metastasis (MHR 1.300 [95% CI 1.181; 1.476]) (Tables 3, 4 and 5). The variance (δ2) among the participating hospitals in the logistic model was: OS 0.031 (95% CI 0.005; 0.091) (Fig. 2), LR 0.079 (95% CI 0.000; 0.288) (Fig. 3), and M: 0.065 (95% CI 0.020; 0.152) (Fig. 4).

Differences for overall survival at the hospitals, obtained with a multilevel logistic regression, considering the hospital variable as a randomized effect to correct for the non-independence of the data. The hospitals are represented on the vertical axis with their code number in the project. The HR value is demonstrated for each hospital. The hospitals are in order from lower to higher value of the constant, and the positive values of the constant indicate poorer results.

Differences for local recurrence at the hospitals, obtained by multilevel logistic regression, considering the hospital variable as a randomized effect to correct due to the non-independence of the data. The hospitals are represented in the vertical axis with their code number for the project. The HR value is shown for each hospital. The hospitals are in order from lower to higher value of the constant, and the positive values of the constant indicated worse results.

Differences of metastasis in the hospitals, obtaining a multi-level logistic regression, considering the hospital variable a randomized effect to correct due to the non-independence of the data. The hospitals are represented on the vertical axis with their code numbers in the project. The HR value is shown for each hospital. The hospitals are organized from lower to higher value of the constant, and the positive values of the constant indicate poorer results.
The results of this study indicate that, in the AEC Rectal Cancer Project, the general survival rates were higher in the hospitals that operated on 36 or more patients per year, and that surgical volume did not influence local recurrence rates.
The greatest weakness of this study is the voluntary nature of the data inclusion in the AEC Rectal Cancer Project, especially when compared with registries from Scandinavian countries,10–12 where including data in the registry is mandatory. However, as has been indicated in greater detail,4 several initiatives have been taken to avoid voluntary or involuntary biases of inclusion and information. Unfortunately, due to the anonymous character of the data and the lack of other sources to confirm the information that our country lacks, the data of this study indicate the minimum rates of local recurrence, metastasis and general survival.
The LR rate observed five years after the start of this project was 6.6%, which is similar to that observed in Norway10 (8%) in the analysis of the period 2004–2006 and that reported by the Swedish registry11 (7.2%) for the period 2001–2006. In the Danish registry, this outcome indicator was not evaluated.12 The OS rate in this project (72.3%) was situated between reports from the registries of Norway10 (76%) and Sweden11 (75.8%), and Denmark12 (68%).
Nonetheless, these results have been reached with different rates of use of neoadjuvant therapies: 32% en Norway,10 59% in Spain4 and 61% in Sweden.11 In addition, while in Sweden11 the treatment in this period was basically short-cycle radiotherapy (57% short-cycle radiotherapy and 4% radiochemotherapy), in Spain4 and Norway10 it was chemoradiotherapy.
Furthermore, it should be mentioned that the LR rates in this project have improved over time since its initiation; in the period 2006–2007, two years after the start of the project, the rate was 8%. This fact was also observed in Norway10 and in Sweden,11 countries in which the rates in patients operated on from 2007 to 2012 have decreased to rates of 4% and 5%, respectively. This seems to indicate that the fact that a hospital concentrates on the treatment of this disease by auditing results and providing continuous training of the multidisciplinary team leads to progressively improved outcomes.
In the United States, the Consortium for Optimizing the Treatment of Rectal Cancer (the OSTRiCh Consortium) has recently published the results of an audit of 16619 patients, which has demonstrated that the CRM was invaded in 2859 (17.2%).13 This lead to an Editorial article about the need to modify healthcare in that country.14 Thus, the OSTRiCh consortium,15 comprised of several professional associations (American College of Pathologists, American College of Surgeons American College of Radiology, Society for Surgery of the Alimentary Tract, Society for Surgical Oncology, Society of American Gastrointestinal and Endoscopic Surgeons), has proposed several initiatives, which are similar to those of European projects, in order to improve the quality of rectal cancer surgery through training and research.
As for the influence of annual surgical volume on the oncological outcomes of these operations, the data of this study differ from observations of the Norwegian ColoRectal Cancer Project2 and the Swedish Rectal Cancer Registry.3 In both, it was observed that annual surgical volumes influenced LR; additionally, the surgical volume of the Swedish registry did not influence OS. Nonetheless, the comparison of the results of this study with the population-based registries of Scandinavia has the limitation that, when the AEC rectal cancer project was initiated, hospitals with annual surgical volumes of less than 12 patients per year were excluded from the study. This decision was made because the Norwegian ColoRectal Cancer Project2 showed evidence that the LR rate of the hospitals that performed less than 10 resections per year doubled those of hospitals that conducted 30 or more (17 and 9.6%, respectively). Moreover, the Stockholm TME Project16 observed that surgeons who performed less than 12 resections per year had LR rates that more than doubled surgeons who did more than 12 (10 and 4%, respectively). Another limitation for comparing the results, especially concerning survival in Sweden, is that the intervals of patients treated annually used to make the comparisons are different in the three registries: in Sweden3 <11, 11–25, >25; in Norway2 <10, 10–19, 20–29, ≥30; and in this project 12–23, 24–35, ≥36.
This study shows that the greater the frequency that rectal cancer surgery is performed at a hospital, the better the oncological outcomes. However, it also indicates that volume itself is not the explanation since in this project there are hospitals with small volumes and better results than hospitals with moderate or large volumes. Therefore, surgical volume is an indicator of quality that is easy to identify, yet imperfect as it alone does not guarantee the outcome.
In conclusion, in the multidisciplinary groups selected and included in the AEC project, which includes training in total mesorectal excision and feedback of the results, overall survival is higher in hospitals with larger surgical volumes and the inter-hospital variability of local recurrence is not explained by surgical volume.
FundingThis project has been financed with the following research funding: FIS number PI11/00010 and the Healthcare Council of Navarra 20/11.
Conflict of InterestsThe authors have no conflict of interests to declare.
Virgen de la Arrixaca (Juan Luján), Bellvitge (Doménico Fraccalvieri, Sebastiano Biondo), Complejo Hospitalario de Navarra (Miguel Á. Ciga), Clínico de Valencia (Alejandro Espí), Josep Trueta (Antonio Codina, Francesc Olivet), Sagunto (María D. Ruiz), Vall de Hebrón (Eloy Espin, F. Vallribera), La Fe (Pablo García Granero), Complejo Hospitalario Ourense (Alberto Parajo), Germans Trias i Pujol (Ignasi Camps, Marta Piñol), Lluis Alcanyis (Vicent Viciano), Complejo Asistencial Burgos (Evelio Alonso), del Mar (Miguel Pera), Complejo Asistencial Salamanca (Jacinto García), Gregorio Marañón (Marcos Rodríguez), Torrecárdenas (Ángel Reina), General de Valencia (Verónica Gumbau, Isabel Grifo), Txagorritxu (José Errasti), Donostia (José A. Múgica), Reina Sofía (José Gómez), Arnau de Vilanova de Valencia (Natalia Uribe), General de Jerez (Juan de Dios Franco), Arnau de Vilanova de Lleida (José Enrique Sierra), Santa Creu i Sant Pau (Pilar Hernández, Jesús Bollo, Carmen Martínez), Clínico de Santiago de Compostela (Jesús Paredes), Universitario de Jaén (Gabriel Martínez, Javier Gutiérrez), Clínico San Carlos (Mauricio García), Cabueñes (Guillermo Carreño), General de Albacete (Jesús Cifuentes), Miguel Servet (José Monzón), Xeral de Lugo (Olga Maseda), Clínico y Provincial de Barcelona (Luis Flores), Virgen de las Nieves (Inmaculada Segura, Pablo Palma), Nuestra Señora de la Candelaria (José G. Díaz), Clínico Universitario San Cecilio (Francisco Pérez, Benito Mirón), Xeral – Cies de Vigo (Nieves Cáceres).
Please cite this article as: Ortiz H, Codina A, Ciga MÁ, Biondo S, Enríquez-Navascués JM, Espín E, et al. Influencia del volumen quirúrgico en los resultados oncológicos después de estandarizar la cirugía en el Proyecto Español del Cáncer de Recto. Cir Esp. 2016;94:442–452.
