Introduction
The Spanish National Health System is designed from the passing of the General Health Law in 1986, which defined a decentralised model based on PHC (PHC). On this basis, the State transferred the regulation, management, and service provision responsibilities to the autonomous community (ACs) governments.
The development of PHC has been slow, irregular and with a significant lack of resources, due to the budget shortages (around 14% of the total health budget), the excessive patient quotas assigned to each doctor, limited access to diagnostic and therapeutic resources, and lack of communication at specialist level and external support or delay in professional advancement as a basic incentive. Thus we are even further away from achieving the objectives of transforming PHC into the foundation that supports the whole system.1,2
This situation, as well as hindering the carrying out of its own important functions, has caused problems in how the rest of the health care system operates. The second level (hospital) has had to take in patients and illnesses that could be resolved in PHC, which causes problems in access to health care, increases in waiting lists, congestion in hospital emergency departments and a deterioration in health care quality and patient comfort.
Although there has been significant advances and improvements in PHC, such as working in a team, development of health plans and programs, the creation of family and community medicine, the incorporation of teaching and research or quality plans centred on the performance of the list of services provided or activities linked to working with the community, are developed, but not to the same extent or homogeneity in the different ACs.
The pace of taking on the health care responsibilities has differed from one AC to another, with more than 10 years difference between the first ones (Catalonia and the Basque Country) and the latest ones. The pace of opening health centres has also varied, although the care structure and the list of services are provided by the majority of health centres in all the ACs. Since the transfers were finalised in 2001, the ACs have full regulatory powers to plan, organise and manage health care resources. The sociodemographic characteristics, the allotted resources, financial capability or ideology (liberal, social democrat, etc) of the different regional governments has led to a widening of the differences in certain health services of each AC, particularly in PHC.3,4
Taking into account that the new PHC model has been universalised, which covers almost all the Spanish population, and that 6 years have gone by since the completion of the transfer of health care responsibilities to all ACs, and since the approval of the new funding model, the objective of this study is to carry out an evaluation of the current situation in PHC, from the analysis of the emerged differences in PHC in the different Regional Government Health Services.
Methods
A cross-sectional ecological study was performed, in which the analysis unit is the AC. The differences in some of the principal indicators that characterise PHC services in the different ACs were analysed, taking into account political ideology (progressive or conservative) of the party in government, with the aim of assessing the influence of this ideology on the development of PHC. Progressive governments have been considered as those in which at least one of the governing political parties has been considered Left-wing in the year 2005. According to this criterion, Andalusia, Aragon, Asturias, Cantabria, Castile-La Mancha, Catalonia, Extremadura, and the Basque Country have been considered as progressive ACs. Conservative governments have been considered as those in which no Left-wing party forms part of the government. Using this criterion, those ACs considered as conservative are, the Balearic Islands, Canary Islands, Castile and Leon, Community of Valencia, Galicia, Madrid, Murcia, Navarre, and La Rioja.
The indicators selected were the following:
1. Service provision at this health care level and the elements that make up this service are documented (list of services).
2. Resolving ability, directly related with the possibility of using diagnostic tests and procedures (strip tests, ECG, ultrasound-Doppler, blood pressure monitoring, spirometers); with the provision of therapeutic procedures (drug administration, aspirations, minor surgery, cryotherapy, physiotherapy, health education, cardiopulmonary resuscitation, oral health); with access to second level diagnostic tests (simple radiography and with contrasts, CT, ultrasound, MR laboratory tests, histopathology, hearing tests, colonoscopy or effort tests).
3. Accessibility and possibility of a good doctor-patient relationship (time available for consultation), associated to the number of patients per family doctor, paediatrician or nursing staff.
4. Efficiency and effectiveness, evaluated from the adult vaccination rates, drug spending, and growth of this.
5. Commitment by the administration with the PHC in spending destined for the latter.
6. Patient user perceived quality, using the percentage of people who choose public health to see a family doctor or paediatrician, who believe that the care has been good, or who consider that the care has improved in the last few years.
Variables Analysed
The variables constructed to describe the aforementioned indicators were the following:
1. Services offered (percentage of centres that provide a list of services).
2. Diagnostic procedures offered (percentage of centres with access to all of them).
3. Therapeutic procedures offered (percentage of centres that provide them).
4. Access to second level diagnostic tests (percentage of centres that have access to the tests listed among the indicators).
5. Inhabitants over 14 years old per general medicine doctor.
6. Inhabitants less than 14 years old per paediatrician.
7. Inhabitants per nursing professional.
8. Percentage of doctors with more than 1500 assigned patients.
9. Spending on PHC per person covered (euros per inhabitant per year).
10. Percentage of people who prefer to go to public health to be seen by a doctor in general medicine or a paediatrician.
11. Percentage of people who consider that the care received in PHC has been good or very good.
12. Percentage of people who believe that primary care has improved over the last few years.
13. Percentage of adults over 65 years vaccinated against the flu.
14. Drug spending per capita in 2006 (€/inhabitant).
15. Increase in drug spending in the year 2006 compared to that in 2005 (%).
Information Sources
The data have been extracted from the Barómetro Sanitario (Health Barometer) 2006 published by the Ministry of Health and Consumer Affairs and the National Health System Health Information System 2005.5
Statistical Analysis
A descriptive analysis was performed on the chosen indicators. The variation between variables was analysed using correlation tests.
The mean values of the variables, according to conservative or progressive ideology were compared using the Mann-Whitney U non-parametric test. The percentage differences between them are also expressed. For information purposes, the ACs are classified by scoring the results of each variable by quartiles; thus, they scored from 1 to 4, if the variables 1, 2, 3, 4, 9, 10, 11, 12, and 13 were situated in the quartiles 1 to 4 and were given a score of 1 to 4, if variables 5, 6, 7, 8, 14, and 15 were situated in the quartiles 1 to 4.
Results
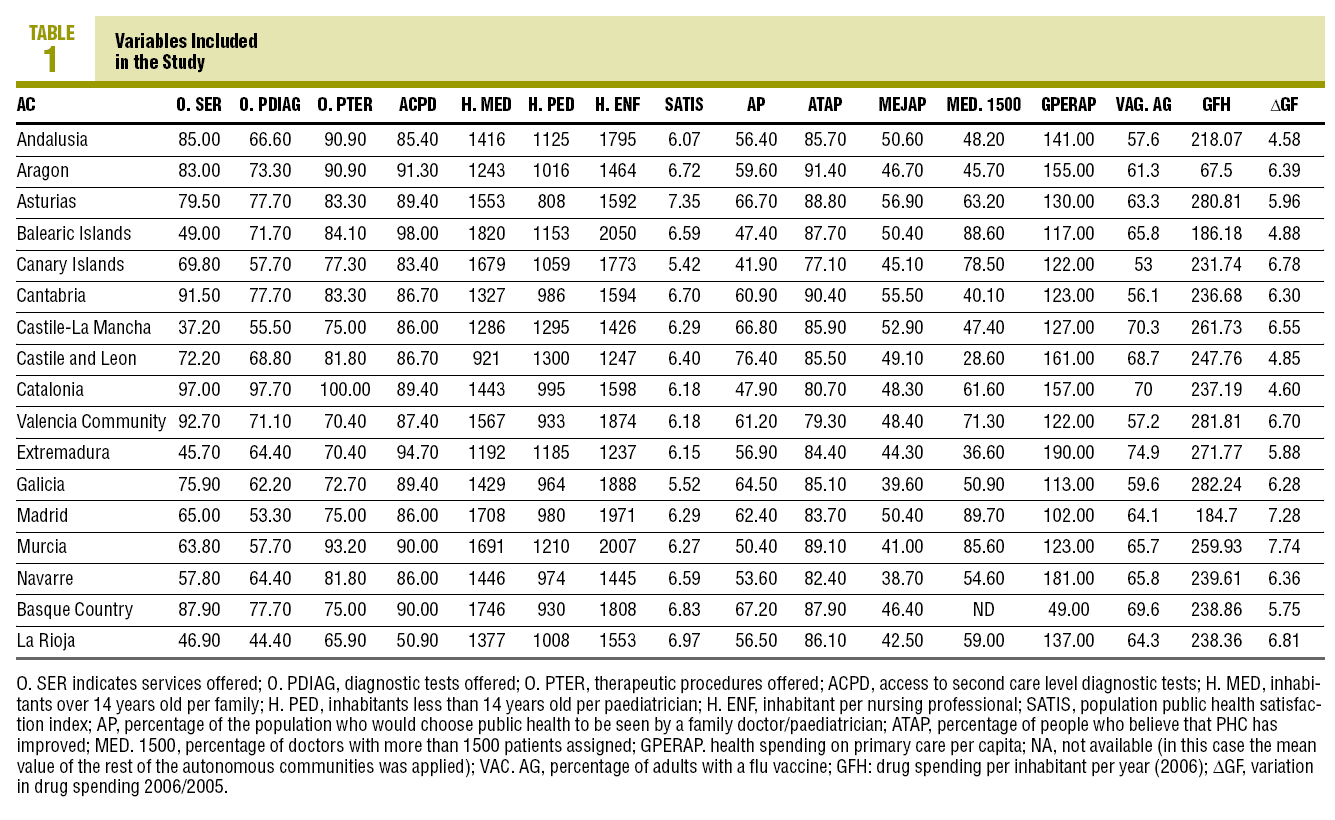
The data compared in this study are shown in Table 1. Of the centres that offer the list of services mentioned, the differences vary between 37.2% and 97% of centres (mean, 70.58%). Access to diagnostic and therapeutic procedures in health centres as regards diagnostic tests vary between 44.4% and 97.7% (mean, 67.17%); for therapeutic procedures the differences vary between 65.9% and 100% (mean, 80.64%), and as regards access to second level diagnostic tests the difference was between 50.9% and 98% (mean, 86.51%). The number of people over 14 years per doctor varies between 921 and 1820 (mean, 1461.41 persons); children less than 14 years old per paediatrician vary between 808 and 1300 children (mean, 1054.17), and the total number of people of all ages per nurse varies between 1237 and 2050 (mean, 1666).
Spending per inhabitant dedicated to PHC varies between e102 and e190 per inhabitant, per year (mean, €138.23).
The perceived quality (opinion of patients on the operation of PHC) is expressed as the percentage of the population who preferred the public health to consult a general medicine or paediatric doctor, which varies between 41.9% and 76.4% (mean, 58.62%), in the percentage of people who expressed an opinion that the care received in the general medicine consultation was good or very good varied between 77.1% and 91.4% (mean, 85.36%) and in the percentage of people who believe that PHC has improved in the last few years was between 38.7% and 56.9% (mean, 47.45%).
The effectiveness and efficiency of the health centres in this study are expressed as the number of adults over 65 years who were given a flu vaccine, which varies between 53% and 74.9% (mean, 63.95%), in drug spending per capita in 2006, which was between e184.7 and e282.4/inhabitant/year (mean, €244.99), and growth in drug spending in 2006 compared to 2005, varied between 4.58% and 7.74% (mean, 6.09%).
A negative correlation was found between those who preferred to go to a doctor in the public sector and with the percentage of doctors with more than 1500 assigned patients: r=0.557 (P=.025), and a positive correlation between the user satisfaction with the public health system and the percentage of people who said that the care received by the general medicine doctor or paediatrician was good or very good: r=0.622 (P=.008).
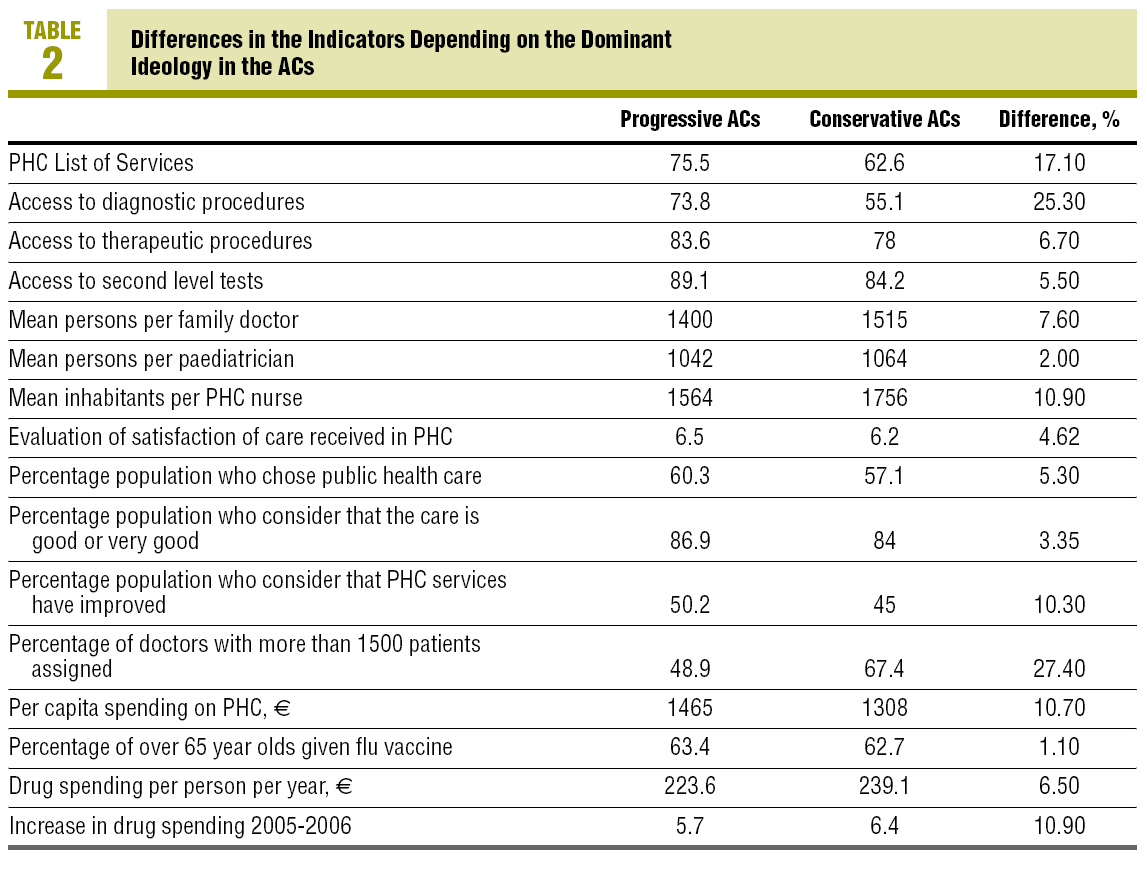
In all the indicators, the progressive ACs have obtained a better score than the conservatives (Table 2).
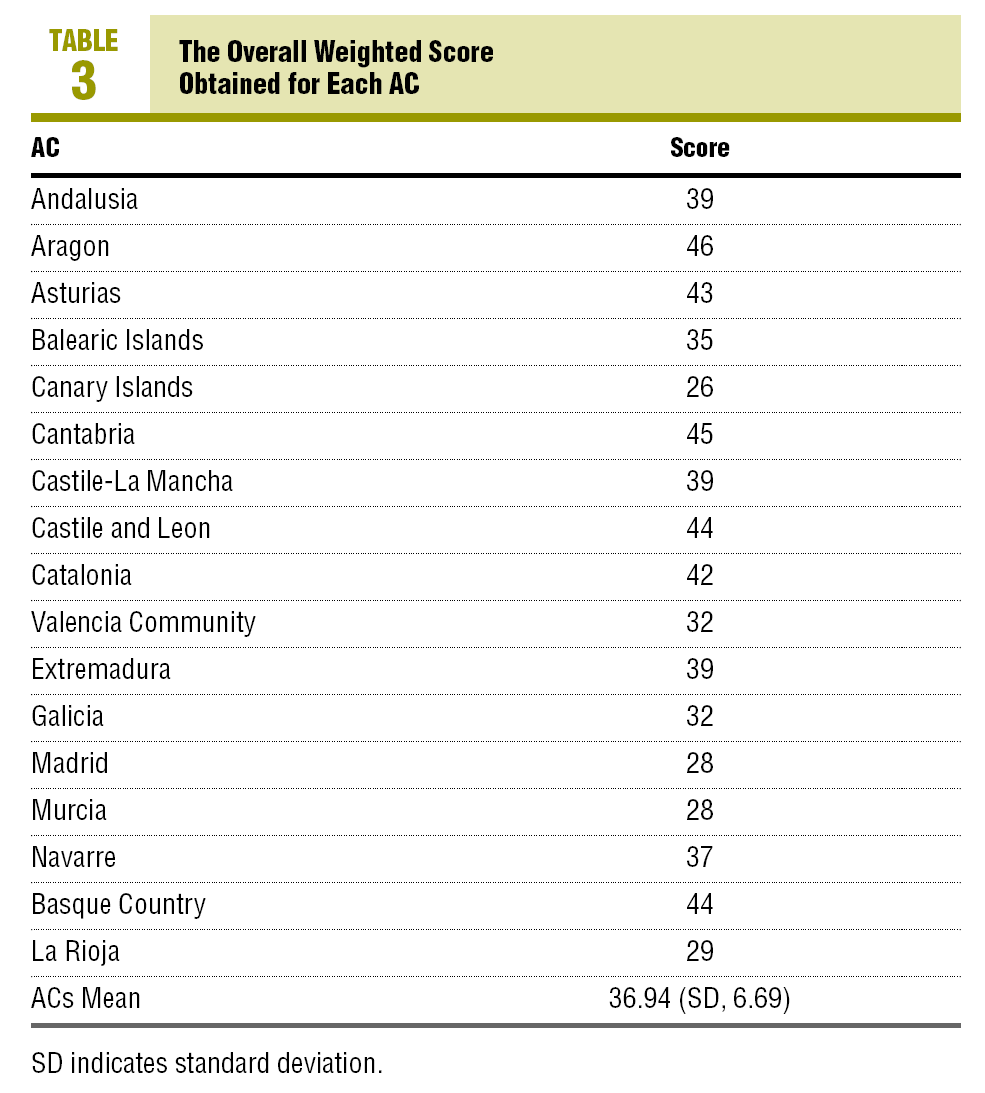
The main differences are seen in the percentage of excessive quotas (more than 1550 inhabitants per family doctor, with a 27.4% difference, almost statistically significant; P=.055); in the limitation of access to diagnostic tests from PHC services (25.3%; P=.027), and in the services offered by PHC with 17.1%. In a second group of less significant differences are found; the number of nurses per inhabitant (10.9%), increase in drug spending (10.9%; P=.074), spending per capita on PHC (10.3%; P=.074) and the percentage of people who believed that PHC had improved. Using weighting by quartiles of the variables analysed, the differences in scores obtained by the ACs varied between a maximum of 46 (Aragon) and a minimum of 26 (Canary Islands), with an ACs mean of 39.94 (Table 3). With these criteria, the evaluation of ACs according to their PHC would be the following:
An excellent PHC (>percentile 75 =>43): above the 75 percentile, which corresponds to a score of greater than 43, is found in Aragon (46), Cantabria (45), Castile and Leon, Basque Country (44), and Asturias (43); an acceptable PHC (percentiles 50-75 =39-43): a percentile between 50 and 75 and a score between 39 and 43, which is found in Catalonia 42), and Andalusia, Castile-La Mancha and Extremadura (39); a fair PHC (percentiles 25-50 =30.5-39): percentile between 25 and 50 and a score between 30.5 and 39, with Navarre (37), Balearic Islands (35), Galicia, and the Community of Valencia (32), and PHC with serious deficiencies ( Discussion As regards the list of services, although the mean level of services offered in them may be considered acceptable (70.58), there are significant differences between ACs with less services in these lists (Castile-La Mancha, 37.2; La Rioja, 46.9; Balearic Islands, 49) compared to those who do more (Catalonia, 97; Community of Valencia, 92.7; Cantabria, 91.5; Basque Country, 87.9, or Andalusia, 85). On the access to diagnostic tests from this health care level, very significant differences are clearly seen with ACs where there are great limitations (La Rioja, 44.4; Madrid, 53.3; or Castile-La Mancha, 55.5), compared to others in which there are few limitations (Catalonia, 97.7, and the Basque Country, Cantabria and Asturias, all with 77.7). The overall mean of patients per family doctor is below 1500 (1461.41 people) and seems acceptable, since it is not far off the 1250 recommended6; however, some ACs are significantly further away from this mean, which can cause problems of excessive medical quotas (Balearic Islands, 1820; Basque Country, 1746; Madrid, 1708; or Canary Islands, 1679). Patient satisfaction with the health care received in PHC services is high (the mean of patients who consider the care received to be good or very good is 85.36%) and those who prefer public PHC services is above the pass mark (58.62%). However, the number of people who considered that PHC has improved over the last few years, did not reach the halfway mark (mean, 47.5%), the ACs with the lowest scores being Navarre with 38.7%, Galicia with 39.6%, and Madrid with 41%, compared to Asturias with 56.9% or Cantabria with 55.5%. PHC spending per person per year is low, with a mean of e133.23 (13.9% of the total in 2003), although there are significant differences: Madrid, €102; Galicia, €113; Balearic Islands, €117; Canary Islands, €122; or Murcia 123, compared to Extremadura, €190; Navarre, €181; Castile and Leon, €161; Catalonia, €157; or Aragon, €155. Flu vaccine cover in adults is relatively low, with 63.95%, with no large variations between ACs. The resolution capacity of PHC in the conservative ACs may be lower compared to the progressive ones, due to financial limitations, the services on offer, the lower possibility of using diagnostic technologies and the higher patient quotas, which limit consultation times, and as a result, poorer results in drug spending and the improvement perception by the users and the general population. It seems, therefore, that there is indeed a negative influence by conservative ideology, a finding that coincides with higher wealth of some of them, in those which higher hospital spending is seen to the detriment of PHC spending.4 As regards the relative position of each AC, the majority of those considered conservative obtained a very deficient or fair score in the development of PHC. The minimum score that an AC can obtain is 15 (all the variables with a score of 1), therefore if a wider scale was used it could have shown even more pronounced differences. Looking at the limitations of this study, the data have been obtained from official publications, although this does not mean they are more correct. They do not reflect trends or analyse time series, and, therefore, they do not detect the effect of the different paces at which the ACs are assuming responsibility, or the opening of centres, or the stability in a government with the same political party. Some of the weighted comparisons are based on interval variables, therefore it cannot be interpreted that one AC has "a twice as good PHC" than another, although the score may almost indicate this (Table 3). Although the comparison criteria that we used has been made from weighting that may be considered "soft" from a statistical point of view, however they are useful to point out the rise in inequalities and the financial and redistribution deficiencies between ACs, aspects highlighted in other studies,7,8 and to stimulate researchers to look for other solid indicators and other comparison arguments sensitive to social and health care changes. What Is Known About the Subject • The bulk of public health spending has been the responsibility of the autonomous communities (ACs) for 6 years. What This Study Contributes • The capacity to resolve illnesses by the PHC services in the conservative ACs may be lower compared to progressive ones, due to funding limitations, services offered, the possibility of using diagnostic technologies and in a greater excess in patient quotas. Spanish version available Correspondence: Dr. L. Palomo. Manuscript received June 25, 2007.
• Besides differences in income and public health spending, decisions on public health policies can decide the flow of resources that primary health care (PHC) receives.
• As regards the relative position of each AC, the majority of those considered conservative obtain a very deficient or fair in the functioning of PHC.
www.elsevier.es/214.530
A commentary follow this article (page 282)
Unidad de Docencia e Investigación.
Gerencia del Área de Salud.
San Pedro de Alcántara, 3.
10001 Cáceres. España.
E-mail: luispalomo@wanadoo.es
Manuscript accepted for publication December 12, 2007.


