


Non-alcoholic fatty liver disease (NAFLD) encompasses a spectrum of liver abnormalities including steatosis, steatohepatitis, fibrosis, and cirrhosis. Liver biopsy remains the gold standard method to determine the disease stage in NAFLD but is an invasive and risky procedure. Studies have previously reported that changes in intrahepatic fatty acids (FA) composition are related to the progression of NAFLD, mainly in its early stages. The aim of this study was to characterize the liver FA composition in mice fed a Choline-deficient L-amino-defined (CDAA) diet at different stages of NAFLD using magnetic resonance spectroscopy (MRS).
MethodsWe used in-vivo MRS to perform a longitudinal characterization of hepatic FA changes in NAFLD mice for 10 weeks. We validated our findings with ex-vivo MRS, gas chromatography-mass spectrometry and histology.
ResultsIn-vivo and ex-vivo results showed that livers from CDAA-fed mice exhibit a significant increase in liver FA content as well as a change in FA composition compared with control mice. After 4 weeks of CDAA diet, a decrease in polyunsaturated and an increase in monounsaturated FA were observed. These changes were associated with the appearance of early stages of steatohepatitis, confirmed by histology (NAFLD Activity Score (NAS) = 4.5). After 10 weeks of CDAA-diet, the liver FA composition remained stable while the NAS increased further to 6 showing a combination of early and late stages of steatohepatitis.
ConclusionOur results suggest that monitoring lipid composition in addition to total water/fat with MRS may yield additional insights that can be translated for non-invasive stratification of high-risk NAFLD patients.
Non-alcoholic fatty liver disease (NAFLD), or its recently proposed denomination, metabolic dysfunction-associated fatty liver disease (MAFLD), is an umbrella term encompassing a group of liver disorders including isolated steatosis, steatohepatitis (NASH), liver fibrosis and cirrhosis [1]. The current gold standard used to confirm and stage NAFLD is liver biopsy, which is an invasive technique and may not be representative of the whole liver parenchyma as well as implies exposing patients to a risky procedure [2,3]. Non-invasive diagnosis of NAFLD is usually based on an estimation of the total amount of hepatic fat infiltration, but does not show a good correlation with clinical progression [4]. However, total fat accumulation does not consider possible differences in lipid or fatty acid (FA) composition which has been proposed as an alternative method to discriminate this group of diseases [5–7]. Understanding the evolution of intrahepatic FA composition during disease progression would aid stratification, prognosis, and evaluation of treatment response, and lead to a better understanding of the prognosis of this disease.
FA composition can be measured using ex-vivo Magnetic Resonance Spectroscopy (MRS) or mass spectrometry-based approaches of extracted tissue samples, or non-invasively using in-vivo MRS techniques [8]. Ex-vivo MRS provides metabolic information with higher spectral resolution and sensitivity compared to in-vivo MRS [9]. It allows a comparison with other analytical methods such as gas chromatography-mass spectrometry (GC–MS), the gold standard for quantifying FA composition, and histology, the gold standard to classify the stage of NAFLD disease. On the other hand, in-vivo MRS is commonly used to assess metabolic information in clinical or preclinical studies and represents a significant advantage since it allows longitudinal assessment of the same subject during the disease’s progression/regression.
There are several murine models to study NAFLD, including dietary and genetically altered models [10]. Some dietary models mimic fast food feeding to induce metabolic disorders and increase fat accumulation in the liver. A drawback of these models is that animals take a long time to develop the disease, and most of them fail to develop fibrosis, which is a crucial step in the clinical progression from NASH to cirrhosis. In previous work [7], we studied the progression of NAFLD from steatosis to early-stage steatohepatitis in mice fed a Western diet for 24 weeks. Using ex-vivo MRS in liver samples we found a decrease in polyunsaturated fatty acids (PUFA) and an increase of monounsaturated fatty acids (MUFA) during disease progression. Reduction in PUFA was associated with a rise in liver inflammation [11]. Additionally, using the ex-vivo MRS data, the stage of disease was accurately classified into three categories using principal component analysis (PCA): normal, steatosis, and NASH [7]. However, a limitation of this study was that it only included ex-vivo samples corresponding to early stages of NASH.
The choline-deficient, l-amino acid-defined (CDAA) [12] is a widely used dietary intervention in mice that develops liver inflammation as early as three weeks and later fibrosis [13]. Long-term CDAA exposure is characterized by the induction of progressively severe steatohepatitis and fibrosis, allowing the longitudinal evaluation at different time points during NASH progression [14]. In the present work we therefore aimed to compare the liver FA composition in a CDAA dietary NAFLD model during disease progression. The present study included both ex-vivo and in-vivo analysis and include more advanced stage of NASH to perform a complete characterization of the intra-hepatocyte lipid changes during disease development. These techniques have not previously been performed together for this purpose and could provide new insights into NAFLD progression and a potential non-invasive technique for its early diagnosis.
2MethodsEx-vivo experiments were carried out at Pontificia Universidad Católica de Chile, Santiago, Chile. All experiments were approved by the Scientific Ethics Committee for the care of animals and the environment (Comité de Ética y Bienestar Animal, Escuela de Medicina, Pontificia Universidad Católica de Chile [CEBA] resolution #14-048). In-vivo experiments were performed at King’s College London, London, UK. All procedures used in this study were performed in accordance with the guidelines of the UK Home Office.
2.1Animal dietBefore all experimental procedures, mice were numbered, weighed, and randomized. For the in-vivo study, mice (C57BL/6, adult, male, n = 4) were fed with a CDAA diet for ten weeks, with images/single voxel spectroscopy acquired longitudinally at 4, 6, 8, and 10 weeks. Control mice (C57BL/6, adult, male, n = 4) were fed with a Chow diet. For the ex-vivo study, mice (C57BL/6, adult, male, n = 6) were fed with a CDAA diet (#518753, Dyets Inc. Bethlehem, PA) for four weeks and a separate cohort for ten weeks (n = 6). Control mice (C57BL/6, adult, male, n = 6) were fed with a Chow diet (500l*, Labdiet, Missouri, USA).
2.2In-vivo study2.2.1Magnetic resonance spectroscopy (MRS)In-vivo liver MRS was obtained in a 9.4 T vertical magnet (Bruker UltraShield 400WB Plus) with a surface coil (Bruker BioSpin MRI GmbH). Mouse anesthesia was induced with 5% and maintained with 1–2% isoflurane mixed in medical oxygen, and temperature was monitored and maintained at 37 °C. Fast low angle shot (FLASH) localizer image was performed with B0 shimming, followed by a fast imaging with steady state precession (FISP) localizer. After that, a single voxel spectrum was acquired using a stimulated echo acquisition mode (STEAM) with and without water suppression. Water suppression employed variable pulse powers and optimized relaxation delays (VAPOR). A minimum of 2 voxels were selected for each mouse, and for each voxel, localized B0 shimming was performed. The acquisition parameters for the STEAM were TR/TM/TE = 2500/10/3 ms, BW = 5500 Hz, Nº points = 2048, NSA = 32, Voxel = 2 × 2 × 2 mm2, total scan time = 80 s. After the study, mice were euthanized by an overdose of anesthesia.
Spectra were fitted with the Advanced Method for Accurate, Robust and Efficient Spectral fitting (AMARES) in the jMRUI software package [15,16]. The FA correspond to the following metabolites peaks: terminal methyl protons (approximately at 0.9 ppm); bulk methylene protons (approximately at 1.3 ppm); β-methylene protons (approximately at 1.6 ppm); allylic protons (approximately at 2.0 ppm) α-methylene protons (approximately at 2.2 ppm); diallylic protons (approximately at 2.8 ppm) and olefinic internal protons (approximately at 5.3 ppm).
Total percentage of fat in the liver was calculated as L/(L + W) * 100%, where W represents the amplitude of the water signal and L the total amplitude of all lipid signals.
2.3Ex-vivo studyAt the end of the diet intervention, mice were anesthetized with ketamine/xylazine, and the livers were harvested [17]. A portion of the liver was used for histology. The remaining liver was divided into two portions for intrahepatic lipid extraction that were independently analysed using MRS at 9.4 T and by GC–MS.
2.3.1Fatty acids methyl esters extractionIntracellular FA were extracted using a protocol adapted from Folch et al. [18], followed by esterification to obtain more stable fatty acid methyl esters (FAME) [19]. Briefly, the liver was weighed and homogenized for 5 min at 0 °C using 2:1 chloroform to methanol (5 mL for each gram of tissue), sodium chloride saturated solution (0.625 mL for each gram of tissue), acetic acid (0.0625 mL for each gram of tissue) and 0.25 mg nonadecanoic acid (as standard), then the organic phase was extracted. The solvent was evaporated by blowing nitrogen gas. Once completely dry, the final mass of FAME extracted from the initial liver mass is obtained.
The esterification process was carried out by adding 1 mL of 10% acetyl chloride in anhydrous methanol, and 0.5 mL of dry toluene as a solvent and brought up to 55 °C overnight. Each sample was neutralized with approximately 7 mL of 6% sodium bicarbonate saturated solution. 2 mL of n-hexane was added for the final extraction of the FAME, to which, after a centrifugation process to remove residual water, the solvent was evaporated with nitrogen gas and the final methyl esters mass was obtained. Around 300 mg of liver tissue have been used and this quantity was sufficient to obtain 5 mg of FAME, which is the minimum amount of sample needed to perform a MRS (400 MHz) with good signal-to-noise ratio (SNR) in an acceptable time, while only 2 mg of FAME is required for GC–MS.
2.3.2Liver histologyLiver sections were fixed in 10% formalin for at least 24 h at room temperature, embedded in paraffin, and 5 μm sections were stained with hematoxylin/eosin to evaluate cellular morphology, inflammatory foci, and hepatocellular ballooning. Liver steatosis was directly assessed by with Oil-red-o staining (Abcam, USA). Likewise, liver fibrosis was assessed using Picrosirius Red staining and quantified by digital image analysis (ImageJ, NIH, US) as previously described [17]. Whole slide imaging was performed using an Aperio Digital Pathology Slide Scanner (Leica Biosystems), allowing the assessment of the entire left lateral lobe, performed by a blinded pathologist who evaluated each sample by using the NAFLD Activity Score (NAS) proposed by Kleiner et al. [20]. A NAS score less than 3 corresponds to an absence of NASH, while a score higher than 4 indicates the presence of NASH. A NAS score between 3 and 4 is indeterminate [20].
2.3.3GC–MS and MRSFAME were analyzed using GC–MS (PerkinElmer, Clarus 680) equipped with HP-Innowax capillary column (length 25 m, internal diameter 0.2 mm, film 0.2 mm). FAME were identified by comparing retention times to known standard and by matching with the mass spectra from NIST library (National Institute of Standards and Technology, USA). FA composition was defined as the percentage of individual FA with respect to its total. 1H MRS spectra of FAME sample were obtained using a Bruker Avance spectrometer operating at 9.4 T with the acquisition protocol Zg30 (30 degrees excitation pulse). Further details of the methodology for analyzing FA with GC–MS and MRS can be found in [7].
2.4Statistical analysisAll statistical analyses were performed using Prism 6 (GraphPad Software Inc, La Jolla, CA). A Shapiro–Wilk test was performed to confirm the normality of the data. All graphs were plotted as mean and standard deviation (SD). To compare among three or more groups, the ANOVA test was performed followed by a Bonferroni post-hoc test.
3Results3.1In-vivo studyFig. 1 shows a representative image of the two voxels used for the MRS in-vivo acquisition that were localized to avoid any major vessels. Excellent agreement was found in the lipid content measured in both acquired voxels. The difference in lipid content between the voxels was, on average, 4.4%, varying from 0.05% to 13.49% (data not shown). The r-square was 0.9 representing a good correlation and the coefficient of variation (CV) was 11%.
 positioned in the liver and the correlation of lipid content measured in 2 independent voxels. The average difference between two voxels was 4.40%, varying from 0.05% to 13.49%.")
Fig. 2a shows the liver lipid content (average voxels value). Lipid content increased from 1.1 ± 0.2% (Control group) to 35.0 ± 4.3% (8 weeks of CDAA diet), p < 0.05, and then remained almost constant from 8 weeks to 10 weeks-diet (34.0 ± 4.8, p > 0.05), although three mice evidenced a decreasing trend in the quantity of fat at later points, possibly due to fibrosis.
 the lipid content shown for each mouse individually, the numbers on the bottom of the bars are the average value. Lipid content was calculated as L/(L + W) * 100%, where W represents the amplitude of the water signal and L the total amplitude of the lipid signals. (b–e) Metabolites measured from in-vivo MRS. *p < 0.05, **p < 0.01, ***p < 0.001 (significant differences between groups).")
In-vivo results: (a) the lipid content shown for each mouse individually, the numbers on the bottom of the bars are the average value. Lipid content was calculated as L/(L + W) * 100%, where W represents the amplitude of the water signal and L the total amplitude of the lipid signals. (b–e) Metabolites measured from in-vivo MRS. *p < 0.05, **p < 0.01, ***p < 0.001 (significant differences between groups).
From in-vivo MRS spectra, we found seven peaks, corresponding to lipids and FA. Three of them are similar in all fatty acids (terminal methyl, β-methylene and α-methylene) therefore, showed no significant differences between groups (not shown), while the other four peaks showed significant differences between the control group and CDAA-diet groups (Fig. 2b–e). The Bulk Methylene (1.3 ppm) and the Allylic (2.0 ppm) peaks increased during the diet intervention, while the diallylic peak (2.8 ppm) and the olefinic peak (5.3 ppm) decreased during the period. The changes were observed mainly at the beginning of the CDAA diet intervention (4 weeks-diet) and only diallylic peak showed a small, but significant, difference between 4 weeks and 8 weeks, and between 4 and 10 weeks of CDAA diet intervention. The other peaks showed no significative differences between 4 until 10 weeks.
3.2Ex-vivo studyIn order to validate the in-vivo results we performed ex-vivo studies. We observed that the mouse liver weight increased significantly during the first 4 weeks of CDAA diet intervention, and then remained almost constant beyond this timepoint (Fig. 3a). However, the total liver FAME content (mass of FAME/total liver sample, %) increases continuously during the whole period of diet intervention (Fig. 3b)
 Mouse liver weight; (b) percentage of FAME in the liver; (c) Liver size of control (left hand panel) with 4 weeks (middle panel) and 10 weeks (right hand panel) CDAA diet and (d) the corresponding liver histology sections using hematoxylin/eosin, where macrovesicular steatosis, ballooning and inflammation can be visualized; (e) Boxplot showing histopathological-data analysis by using the NAFLD Activity Score (NAS) value for each group. *p < 0.05, **p < 0.01, ***p < 0.001 (significant differences between groups), ns means no significant difference.")
Ex-vivo results: (a) Mouse liver weight; (b) percentage of FAME in the liver; (c) Liver size of control (left hand panel) with 4 weeks (middle panel) and 10 weeks (right hand panel) CDAA diet and (d) the corresponding liver histology sections using hematoxylin/eosin, where macrovesicular steatosis, ballooning and inflammation can be visualized; (e) Boxplot showing histopathological-data analysis by using the NAFLD Activity Score (NAS) value for each group. *p < 0.05, **p < 0.01, ***p < 0.001 (significant differences between groups), ns means no significant difference.
Livers also increased in size during CDAA diet intervention (Fig. 3c) and hematoxylin/eosin histological sections showed macrovesicular steatosis, ballooning, and inflammation after 4 and 10 weeks of CDAA feeding (Fig. 3d). Fig. 3e shows the NAS score: From week 4 of diet intervention, livers already showed an average NAS score of 4, indicating a mix between early stages of NASH and late stages of simple steatosis.
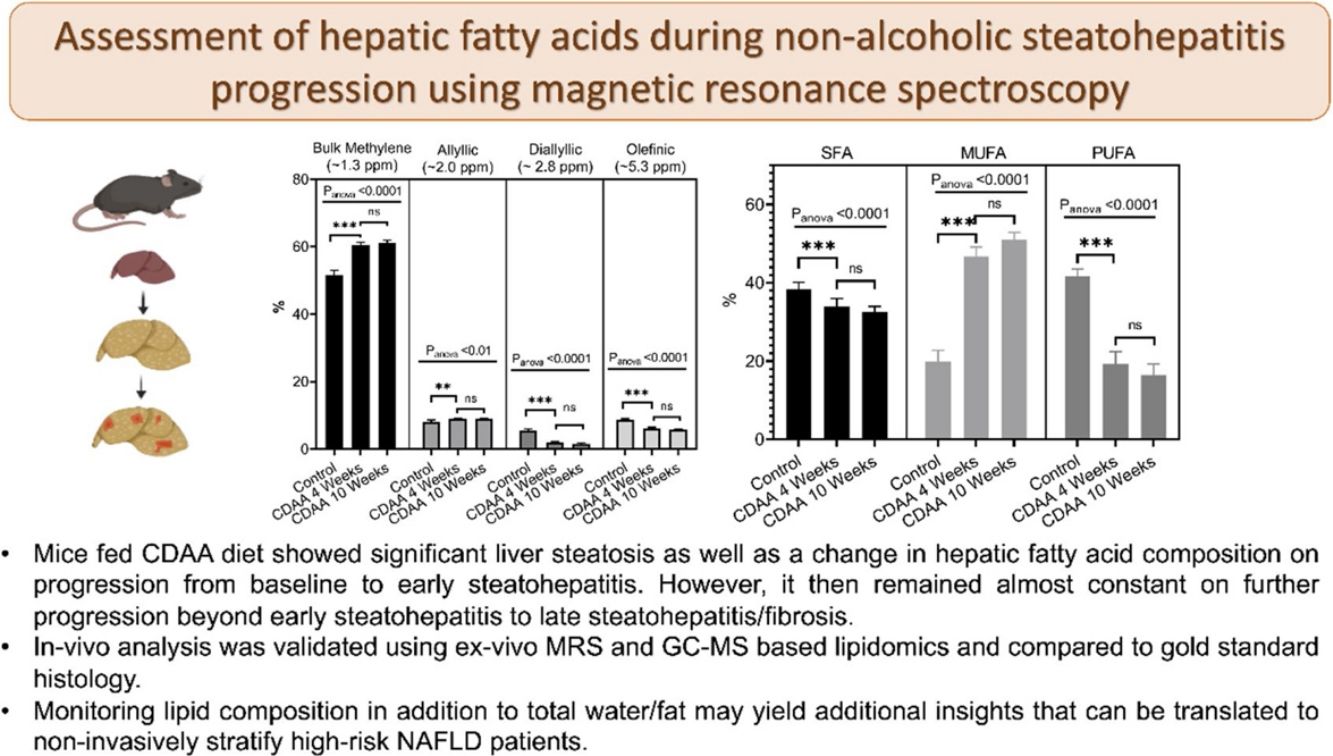
From the MRS spectra, we found seven peaks correspondent to lipids; three of them were similar in all groups (terminal methyl, β-methylene and α-methylene) and no significant differences were observed (not shown). The other four peaks showed significant differences between the control group and the 4 and 10 weeks CDAA diet groups. However, no significant differences were found between mice fed CDAA diet at 4 and 10 weeks (Fig. 4a).
 MRS spectrum analysis: percentage of metabolites measured with MRS (mean ± SD). (b) GC–MS results: The relative contribution of each group of fatty acids: Saturated fatty acids (SFA), monounsaturated fatty acids (MUFA) and polyunsaturated fatty acids (PUFA) for mice fed with CDAA diet. *p < 0.05, **p < 0.01, ***p < 0.001 (significant differences between groups), ns means no significant difference. GC–MS: Gas Chromatography with Mass Spectrometer. SD: Standard deviation, MRS: Magnetic Resonance Spectroscopy.")
Ex-vivo results: (a) MRS spectrum analysis: percentage of metabolites measured with MRS (mean ± SD). (b) GC–MS results: The relative contribution of each group of fatty acids: Saturated fatty acids (SFA), monounsaturated fatty acids (MUFA) and polyunsaturated fatty acids (PUFA) for mice fed with CDAA diet. *p < 0.05, **p < 0.01, ***p < 0.001 (significant differences between groups), ns means no significant difference. GC–MS: Gas Chromatography with Mass Spectrometer. SD: Standard deviation, MRS: Magnetic Resonance Spectroscopy.
The results from GC–MS showed that the SFA, MUFA and PUFA composition of the lipid FA evidenced the same tendency as the MRS analysis, with significant differences between the control group and the 4 and 10 weeks of CDAA diet groups, but no significant differences between 4 and 10 weeks diet groups (Fig. 4b).
4DiscussionTotal amount of fat in the liver estimated by MRS has been used as a key non-invasive biomarker for liver steatosis diagnosis. This method is based in the separation of the water and fat signal. Even though this method is very reliable in this estimation, this approach does not discriminate between different types of fatty acids storage inside the hepatocytes. Previous studies have suggested that the fatty liver composition and its change over time could be related with the stage of progression of NAFLD [5,6]. Previous studies using liver samples in mice [21] and humans [5] have demonstrated changes in the type of fatty acids stored in the liver during NAFLD progression. Previous studies performed by our group have demonstrated that changes in liver FA composition could be inferred using non-invasive MRS which could be used as a biomarker of NAFLD progression/regression. However, most of those studies has been done during the early stages of diseases progression from simple steatosis until early stages of NASH. In the present study, we extended the previous results and analyzed the liver FA composition in a CDAA dietary NAFLD model during disease progression using MRS with the aim to understand more advanced stages of NASH and detect changes with a non-invasive method. The lipid profile was followed longitudinally in-vivo using MRS at 9.4 T and was validated with ex-vivo analysis using a combination of MRS at 9.4 T, GC–MS, and histology.
Mice fed with CDAA diet already showed signs of NASH at 4 weeks, as demonstrated by histology (NAS score >4). At this early disease stage, we observed significant changes in intrahepatic FA composition in CDAA diet-fed mice compared to control animals. These changes consisted mainly in a decrease in PUFA and an increase in MUFA as measured by MRS and GC–MS. Ex-vivo MRS analysis displayed seven peaks related to FA. The bulk methylene (1.3 ppm) and allylic (2.0 ppm) peaks increased at 4 weeks CDAA diet while the diallylic (2.8 ppm) and olefinic (5.3 ppm) peaks decreased, with respect to the control group. These results are in good agreement with our previous work where we found a similar trend in those peaks with disease progression following Western diet [7]. The olefinic (5.3 ppm), allylic (2.0 ppm) and bulk methylene (1.3 ppm) peaks are related to changes in PUFA and MUFA, corresponding to FA with double bonds. The diallylic peak, corresponds only to FA with two or more double bonds. The decrease in PUFA observed by MRS agreed with results obtained by GC–MS. Decreased PUFA is of interest since the arachidonic (C20:4), eicosapentaenoic acid (C20:5) and docosahexaenoic acids (C22:6) are known precursors for a variety of anti- and pro- inflammatory mediators [11,22].
Interestingly, from week 4 to 10 of CDAA diet intervention, the percentage of all lipid metabolites (found by MRS) did not change and neither the PUFA, MUFA, and SFA according to GC–MS analysis. The data obtained by MRS and GC–MS were in good agreement. Histology showed that the liver with 4 week-diet showed features of late-stage steatosis, early-stage NASH while all mice exhibited NASH following 10 week-diet.
In contrast, in our previous work [7] feeding Western diet, we only analyzed mice with steatosis and early stages of NASH and the data showed a consistent decrease in PUFA and increased in MUFA during the whole period of diet intervention. This result is interesting, since liver FA composition has shown a clear correlation with NAFLD progression until NASH stage; however, as shown in the present study, during the progression of NASH the results suggest that the FA composition reaches a plateau and does not show further changes.
The main reason why FA composition does not change during the later progression of NASH stages is unclear, however, decrease in PUFA has been reported to be related to the progression of liver damage [5,23]. Because PUFA play a role in lipogenesis and oxidative stress [23], the hypothesis is that in the development of NASH the FA increase in the liver, in turn the PUFA decrease to a certain limit, after that the accumulation of fat ceases while the liver continues to progress into an inflammatory state leading to tissue fibrosis. Of note, hepatic fat content may even decrease with disease progression, which clinically has been described as burned-out NASH and may relate to down-regulation of SREBP-1c and lipogenic enzymes [24]. A variety of independent processes promote tissue inflammation and break the delicate balance of anti- and pro- inflammatory processes [25]. For example, FA saturate the system and promote lipotoxicity in hepatocytes and resident macrophages, leading to liver injury, inflammation and cell death by various mechanisms [26]. Thus, liver injury may limit further increase FA in NASH to induce cytotoxicity, as we see in our animal model. On the other hand, PUFA are involved in anti-inflammatory processes; in NASH they decrease and are no longer able to counteract systemic and hepatic inflammation [27]. In this scenario, the anti-inflammatory and pro-inflammatory balance in the liver is lost with NASH, and the disease progresses without presenting substantial changes in the different hepatic lipids once the inflammation has been established.
The metabolites found by in-vivo MRS exhibited the same behavior as those found by ex-vivo MRS. In-vivo lipid content was analyzed in two different voxels showing a CV of 11%, which is in accordance with values found by Sedivy et al. [28] and Szczpeniak et al. [29] in humans, 14% and 11%, respectively. Previous work [30] comparing in-vivo and ex-vivo MRS in brain metabolites has shown some variance between metabolites in-vivo and ex-vivo. In the present study ex-vivo results are broadly in agreement and help to explain and contextualize the results obtained in-vivo. The excellent concordance between the in-vivo and ex-vivo MRS results open an opportunity to transfer those results to clinical applications, however they now need to be validated in clinical MR system which usually use lower magnetic fields than the one used in this work. Recent studies have been performed with 7 T MRS showing enough resolution to detect those peaks in human liver [31] and in parallel to that, some studies are being performed to obtain a better resolution of the clinical available equipment (3 T and 1.5 T) with the help of deep learning [32].
In conclusion, our results showed a significant change in the liver FA composition from control mice to mice with steatosis and early stages of NASH, these changes consisted mainly in a decrease in PUFA and an increase in MUFA concentration. However, after this initial stage of fast changes in liver lipids composition, the liver FA composition remained almost constant during the progression of NASH from low to severe inflammation. Even though MRS can only provide information on the lipid composition of the tissue, it is interesting that our results showed that changes in the composition of liver fatty acids can be correlated with the progression of the NAFLD disease and indirectly evaluate the progression from simple steatosis to NASH, but MRS could have a minor role in the evaluation of NASH progression, since MRS does not detect fibrosis directly.
Based in this study, we suggest that monitoring lipid composition with MRS in addition to water/fat content could help to better understand and diagnose the NAFLD disease and it could be transferred to clinics in a near future to non-invasively follow-up high-risk NAFLD patients.AbbreviationsNAFLD non-alcoholic fatty liver disease non-alcoholic steatohepatitis fatty acids magnetic resonance spectroscopy gas chromatography with mass spectrometry choline-deficient, lamino acid-defined methionine and choline-deficient polyunsaturated fatty acids monounsaturated fatty acids principal component analysis fatty acids methyl esters signalto-noise ratio NAFLD activity score tetramethylsilane stimulated echo acquisition mode variable pulse powers and optimized relaxation delays fast low angle shot fast imaging with steady state precession main magnetic field standard deviation coefficient of variation saturated fatty acids
This work was partially funded by ANID – Millennium Science Initiative Program – NCN17_129. FONDECYT1180525, 11171001, 1211879, 1191145 to MEA, DC, DC and MA, respectively. CONICYT-PCHA/Doctorado Nacional /2016-21160835. This work was also funded, in part, by grants the Comisión Nacional de Investigación, Ciencia y Tecnología (CONICYT, AFB170005, CARE Chile UC). The Centre of Excellence in Medical Engineering funded by the Wellcome Trust and EPSRC (203148/Z/16/Z). MA is part of the European-Latin American ESCALON consortium funded by the European Union's Horizon 2020 Research and Innovation Program under grant agreement no. 825510.
FZ is grateful to FONDEQUIP EQM120021 and EQM150020 from Pontificia Universidad Católica de Chile. FS-R, AX, and FZ thank ChemAxon for MarvinSketch software for chemical drawing, displaying, and characterizing chemical structures, substructures, and reactions, Marvin 18.27.0 (https://www.chemaxon.com); Instant JChem was used for structure database management, search, and prediction, Instant JChem 18.26.0, ChemAxon (http://www.chemaxon.com). Abstract figure created with BioRender.com.


