


Frailty is characterized by a poor restoration of homeostasis after a stressor event. Although it is not usually diagnosed, it has been associated with decreased survival in cirrhotic patients. We aimed to evaluate the impact of frailty and decreased gait speed over survival in cirrhotic patients at long-term follow-up.
Materials and methodsWe included stable cirrhotic patients Child–Pugh B-C or MELD ≥12, ≥50 years old. We performed a clinical evaluation, anthropometry, and laboratory tests. Frailty was diagnosed using Fried Frailty Index. We evaluated survival at a 4-year follow-up.
ResultsWe included 126 patients; mean age 64±8.3 years, median MELD-Na 15[12–17], median follow-up was 881 [349–1277] days. The main etiology was MAFLD (31.4%). Frailty was diagnosed in 65.1% of patients. There were no significant differences in baseline characteristics per frailty condition. Mortality was higher in frail patients than non-frail patients (68.2% versus 20.6% at 48 months, respectively; p-value <0.001). The mean gait speed in frail and non-frail patients was 0.86±0.3m/s and 1.16±0.2m/s, respectively (p-value <0.001). Interestingly, 26.9% of patients presented a reduced gait speed (≤0.8m/s). Patients with decreased gait speed also had higher mortality than patients with normal gait speed (79.9% versus 40.8%, respectively; p-value <0.001). A multivariate-adjusted model showed that decreased gait speed (HR=3.27, 95%CI:1.74–6.14; p<0.001) and frailty (HR=4.24, 95%CI:1.89–9.51; p<0.001) were associated with mortality.
ConclusionsFrailty is independently associated with decreased survival at long-term follow-up. Reduced gait speed is strongly associated with mortality and could be a surrogate marker of frailty in clinical practice.
Alcohol-related Liver Disease
confidence interval
cumulative incidence functions
Fried Frailty Phenotype
5-question Geriatric Depression Scale questionnaire
Hazard ratio
Hepatitis C virus
interquartile range
liver transplantation
model of end-stage liver disease
model of end-stage liver disease – sodium
metabolic dysfunction-associated fatty liver disease
nonalcoholic fatty liver disease
standard deviation
Chronic liver disease has been associated with increased mortality risk, reduced quality of life, increased disability, a significant economic impact, and a higher risk of being unemployed [1,2].
Frailty is a complex clinical construct that includes reduced physiological reserve and functional decline. It was initially described in geriatric patients, although its significance has been recognized in many conditions, including cancer, cardiovascular disease, and is commonly diagnosed in patients with cirrhosis [3]. Frailty prevalence ranges from 17% to 43% in patients with cirrhosis and is related to a higher risk of hepatic decompensation, hospitalization, transplant delisting, and post-transplant complications [4–6].
Although frailty has been considered equivalent to disability, comorbidity, sarcopenia, and or malnutrition, it remains a distinct entity and includes neurologic, immune and endocrine disturbances, skeletal muscle, and gut microbiome changes [7]. Thus, an overlap among these different conditions can be observed between sarcopenia and frailty [3].
A consensus about frailty definition must be established to replace clinical judgment and allow a standard definition to improve clinical decision making and research generation. Several tools have been developed commonly based on physical strength, balance, self-reported fatigue, and functional ability. Its characteristics are heterogeneous, and the results obtained are not always consistent when they are compared. Choosing one of them must consider the capacity to perform the test in the available amount of time, complexity, accumulated experience and prognostic meaning (falls, disability, hospitalization or death) [8–10]. Thus, a global standard instrument is lacking [11]. We decided to employ Fried Frailty Phenotype (FFP) as a marker of frailty because it has been widely used, has been validated for adverse outcomes in cirrhosis, is relatively simple to employ, does not require too much effort to be properly trained, does not require a significant amount of time to be performed (15–20min), is easy to reproduce, we have significant experience performing it, and it evaluates areas that are not included in other tests as Liver Frailty Index. On the other hand, it contains objective measures that improve its reliability [12,13].
While most studies have shown an association between frailty (evaluated by different tests) and adverse outcomes, most of them have had an observation period between 6 to 12 months. Thus, the impact of frailty over mortality in a longer period of observation has not been widely assessed. The aim of this study is to evaluate the impact of Fried Frailty Phenotype in long-term survival (three or more years) in a cohort of cirrhotic patients.
2Material and methods2.1Study design and participantsSince April 2016 to July 2018, we prospectively enrolled cirrhotic patients with a MELD score ≥12 and/or Child–Pugh score ≥8 in three centers (Hospital Clínico de la Pontificia Universidad Católica de Chile, Hospital del Salvador de Santiago, and Hospital Sótero del Río).
The inclusion criteria were: 1. ≥50 years, 2. Cirrhosis diagnosed by imaging methods, liver elastography or histology, and 3. Ability to provide informed consent. The exclusion criteria applied were: 1. Liver transplantation, 2. Hepatocellular carcinoma beyond Milan criteria, 3. End-stage renal disease, 4. Inability to follow instructions, 5. Inability to walk without assistance, 6. Hospital admission in the previous month. This study was approved by the Ethics Committee of the School of Medicine, Pontificia Universidad Católica de Chile.
2.1.1Clinical and frailty assessmentWe performed an initial clinical evaluation, including clinical interview, physical examination, anthropometry, liver chemistry, calculation of Child–Pugh Turcotte, MELD, and MELD-Na scores and determination of the presence of hepatic encephalopathy, ascites and gastro-esophageal varices.
The diagnosis of frailty was made employing FFP [8], which includes the following variables: 1. Weight loss (>5% weight loss in the last year), 2. fatigue (positive response to questions related to the effort required to carry out an activity), 3. muscle weakness (decreased grip strength, measured with a dynamometer), 4. gait speed (time used to travel 4 meters in a straight line), 5. decrease in physical activity (self-report is accepted as valid). Frailty was diagnosed when ≥3 criteria were present [14].
Concerning the measurement of the variables that defined frailty, the grip strength was evaluated employing a dynamometer in the dominant hand, choosing the best result of 3 attempts. Individuals were classified as low muscle strength when they have less than 27kg/m2 in men and less than 15kg/m2 in women. Those cut-offs are validated in the Chilean population [15]. To evaluate gait speed, the patient was asked to walk in a straight line six meters. Time elapsed was measured excluding the first and last meter to avoid variability attributable to acceleration and deceleration. Velocities ≤0.8 meters/second were considered abnormal [16]. We also evaluated body composition with bioimpedance analysis (OMRON, HBF-510LA model).
We also employed the FRAIL screening questionnaire [17] which includes 5-question with dichotomous answers (yes/no) that evaluates: Fatigue (do you feel fatigued?), resistance (can you climb one-floor using stairs?), aerobic (can you walk one block without stopping?), morbidity (do you have more than five illnesses?), weight loss (have you lost ≥5% of your weight in the last six months?). If the patient answered “Yes” to ≥3 questions, it was considered frail.
We performed the 5-question Geriatric Depression Scale questionnaire (GDS-5) to screen depression, validated in the Chilean population [18]. A point was assigned for each affirmative answer in each of the following five questions: 1. Are you basically satisfied with your life? 2. Are you frequently bored? 3. Do you often feel useless? 4. Do you prefer to stay home rather than go out and do new things? 5. Do you often feel helpless or worthless? Two or more points were considered positive screening for depression.
2.2Statistical analysisThe primary outcome of this study was mortality at 12, 24, and 48 months. Patients who were transplanted during the follow-up were censored in the survival curve. Patients were followed up until May 30th, 2020.
Continuous data were described using mean and standard deviation (SD) or median and interquartile ranges [IQR] for those variables without normal distribution. Normal distribution was evaluated employing the Kolmogorov-Smirnov test. Nominal data were described using percentages. Differences in continuous variables were tested using the T-student test or U-Mann Whitney test if the variable had no normal distribution. Categorical variables were tested using a chi-square test.
The cause-specific hazard and the cumulative incidence functions were estimated through competing survival models. The primary event of interest was mortality, and the competing event corresponds to liver transplantation. We estimated cumulative incidence functions (CIFs) for each competing cause with the “stcompet” command [19]. A Kaplan–Meier curve was depicted to show overall attrition separating their CIFs by the type of event (death or liver transplant). The “stcompadj” command was used when estimating the cumulative incidence curves for the primary and competing events from Cox regression models [20]. The cumulative incidence curves were plotted for the mortality and the liver transplant events according to frailty and gait speed. Multivariate models for cause-specific hazards were built through simultaneous competing-risks regressions. Statistical modeling of the covariate effects on the cumulative incidence function of mortality and liver transplant was performed. Hazard ratio (HR) and 95% confidence interval (CI) were used to report these results.
Statistical analysis was performed with IBM SPSS software version 22.0 (Armonk, NY: IBM Corp.) and STATA software version 16.0 (College Station, TX: StataCorp LP). A p-value of <0.05 was considered statistically significant.
3Results3.1Baseline characteristics of the cohortWe screened 169 patients. Fifteen of them were unwilling to sign an informed consent, and 11 patients repeatedly fail to attend the initial evaluation. Others were not included because exclusion criteria were detected. Fig. 1 shows the flowchart of the patients finally included in our cohort. Thus, 126 patients were included in a period between April 2016 and July 2018. The mean age was 64±8.3 years, and 47.6% were women. Mean body mass index was 29.4±4.8kg/m2. Thirty-six percent had MAFLD as a primary etiology, 31.4% had Alcohol-related Liver Disease (ALD), and 10.2% had chronic Hepatitis C virus (HCV). None of these patients received direct-acting antivirals or any other antiviral treatment before or after the initial evaluation. The frequency of hypertension, diabetes, and heart failure were 36.4%, 48.7%, and 8.5%, respectively. Median MELD-Na was 15 [12–17], and 63.7% were categorized as Child–Pugh B. A total of 22 (17.5%) patients were listed for liver transplantation (LT). Based on patients’ records those with hepatic encephalopathy had had only mild manifestations (West Haven criteria grade 1 or 2) before baseline evaluation. The grade of hepatic encephalopathy at the initial evaluation is detailed in Table 1. According to enlistment status, there were no significant differences in twelve-month survival (84.6% in listed patients and 81.3% in non-listed patients; p=0.629). The median follow-up was 881 [349–1277] days. Table 1 summarizes the baseline characteristics of our cohort.

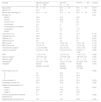
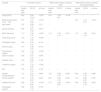
Baseline characteristics of patients per frailty condition.
| Variable | Global population (N=126) | Non-frail (N=44) | Frail (N=82) | p Value |
|---|---|---|---|---|
| Age (years)* | 64±8.3 | 63.3±7.4 | 66.1±8.6 | 0.077 |
| Women (%) | 47.6 | 37.2 | 53.7 | 0.080 |
| Body mass index (kg/m2)* | 29.4±4.8 | 30.1±4.5 | 28.7±4.9 | 0.137 |
| Etiology (%) | 0.08 | |||
| MAFLD | 35.6 | 47.6 | 29.3 | |
| Alcohol | 31.4 | 28.6 | 32 | |
| Chronic HCV | 10.2 | 11.9 | 9.3 | |
| Autoimmune | 3.4 | 0 | 5.3 | |
| Primary Biliary Cholangitis | 2.5 | 0 | 4 | |
| Cryptogenic | 12.7 | 4.8 | 17.3 | |
| Others | 4.2 | 7.1 | 2.7 | |
| Listed for LT (%) | 17.5 | 25 | 13.4 | 0.118 |
| Hypertension (%) | 36.4 | 31 | 40 | 0.330 |
| Diabetes (%) | 48.8 | 50 | 48.7 | 0.891 |
| Heart failure (%) | 8.5 | 2.4 | 12 | 0.074 |
| MELD score† | 13 [11–16] | 13 [12–16] | 13 [11–16] | 0.715 |
| MELD-Na score† | 15 [12–17] | 14 [12–16] | 15 [12–18] | 0.124 |
| Total bilirubin (mg/dL)† | 2.1 [1.36–3.28] | 2.2 [1.6–3.3] | 2.0 [1.2–3.2] | 0.342 |
| Creatinine (md/dL)† | 0.87 [0.71–1.09] | 0.81 [0.70–0.97] | 0.84 [0.71–1.09] | 0.069 |
| INR† | 1.4 [1.2–1.6] | 1.4 [1.2–1.6] | 1.4 [1.3–1.7] | 0.589 |
| Sodium (mEq/L)† | 139 [136–142] | 141 [139–143] | 138 [134–141] | 0.005 |
| Albumin (g/dL)* | 3.4±0.6 | 3.5±0.7 | 3.3±0.6 | 0.101 |
| Hemoglobin† | 12.2 [10.1–13.4] | 13.2 [11.8–14.5] | 12.0 [9.9–12.9] | 0.001 |
| Platelets† | 88,000 | 83,000 | 96,500 | 0.756 |
| [63,000–124,000] | [55,000–136,000] | [72,000–127,000] | ||
| Child–Pugh score (%) | 0.300 | |||
| A | 19 | 28.2 | 15.1 | |
| B | 63.7 | 61.5 | 65.8 | |
| C | 17.3 | 10.3 | 19.1 | |
| Clinical ascites (%) | 45.3 | 26.8 | 55.3 | 0.003 |
| Esophageal varices (%) | 59.5 | 46.3 | 66.7 | 0.036 |
| Hepatic encephalopathy (%)** | ||||
| Absent | 51.2 | 51.2 | 50 | 0.627 |
| Grade 1 | 44.9 | 14.6 | 9.2 | |
| Grade 2 | 5.1 | 34.1 | 40.8 | |
| Previous spontaneous bacterial peritonitis (%) | 5.2 | 2.4 | 6.9 | 0.293 |
| Hepatocellular carcinoma (%) | 19.1 | 14.3 | 20.8 | 0.384 |
Abbreviations: MAFLD: metabolic (dysfunction) associated fatty liver disease; HCV: Hepatitis C virus; LT: Liver transplantation; MELD: Model for End-Stage Liver Disease; INR: International Normalized Ratio.
At the end of follow-up, the overall survival was 51.6%, and 16 patients (12.7%) underwent deceased donor liver transplantation. The leading causes of death were infections in 19.7%, gastrointestinal bleeding 16.4%, cryptogenic acute on chronic liver failure 8.2%, cardiovascular diseases 8.2%, renal failure 4.9%, stroke 4.9%, and others 26.2%.
3.2Frailty assessment of the cohortEighty-two (65.1%) patients were classified as frail based on FFP. There were no differences in age, gender, body mass index, and comorbidities between frail and non-frail patients (Table 1). There was a higher prevalence of MAFLD in non-frail than frail patients (47.6% versus 29.3%, respectively; p=0.048). The prevalence of frailty was higher in the group of Child–Pugh B-C patients versus Child–Pugh A patients (68.9% versus 50% respectively, p≤0.001). Comparing frail and non-frail patients, we observed differences in plasma sodium levels (138 [134–141] versus 141 [139–143] mEq/L, p=0.005), frequency of clinical ascites (55.3% versus 26.8%, p=0.003), and frequency of large esophageal varices (66.7% versus 46.3%, p=0.03). Hemoglobin concentration was lower in frail patients (12.0 [9.9–12.9] versus 13.2 [11.8–14.5], p≤0.001). Table 2 shows the frequency of each component of FFP found altered in the total population and in those of the frail and non-frail groups.
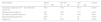
Components of the Fried Frailty Phenotype and the frequencies for each criterion, per frailty condition.
| Abnormalities | Global (N=126) | Non-frail (N=44) | Frail (N=82) | p Value |
|---|---|---|---|---|
| Involuntary weight loss ≥10lbs in the last 6 months (%) | 54.8 | 16.3 | 75.3 | <0.001 |
| Reduced grip strength (%) | 62.1 | 32.6 | 77.8 | <0.001 |
| Decrease in physical activity (%) | 32.3 | 27.9 | 34.6 | 0.450 |
| Reduced walking speed (%) | 26.9 | 0 | 42 | <0.001 |
| Fatigue (%) | 62.1 | 30.2 | 79 | <0.001 |
The cohort's average gait speed was 0.97m/s being significantly lower in frail versus non-frail patients (0.86±0.3 versus 1.16±0.2m/s; p<0.001). Frail patients have a decreased hand-grip strength compared to non-frail patients (15 [11–20] kg/m2 versus 22 [16–30] kg/m2, respectively; p<0.001). Table 2 describes the frequencies of each altered FFP criterion on our cohort. The percentage of visceral fat was significantly lower in frail patients than non-frail (11.5±5.1% versus 13.8±4.9% respectively; p=0.024), but there were no differences in the percentage of muscle mass between both groups (Table 3).
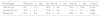
Only 23% of patients were classified as frail based on the FRAIL screening questionnaire. The frequency of each item in non-frail and frail patients are described in Table 4.
Components of the FRAIL frailty phenotype with the frequencies for each criterion, per frailty condition.
| Abnormalities | Global (N=126) | Non-frail (N=44) | Frail+ (N=82) | p Value |
|---|---|---|---|---|
| 1. Fatigue: Do you feel fatigued? (%)* | 62.1 | 30.2 | 79 | <0.001 |
| 2. Resistance: Can you climb one floor using stairs? (%) | 67.7 | 86 | 57.3 | 0.001 |
| 3. Aerobic: Can you walk 1 block without stopping? (%) | 78.2 | 90.7 | 70.7 | 0.014 |
| 4. Morbidity: Do you have more than 5 illnesses? (%) | 5.6 | 2.3 | 7.3 | 0.243 |
| 5. Weight loss: Have you lost ≥5% of your weight in the last 6 months? (%) | 39.5 | 11.6 | 53.7 | <0.001 |
+Based on FRAIL questionnaire.
The prevalence of a positive screening for depression (based on the GDS-5 questionnaire) was 51.6%, and there were significant differences between frail and non-frail patients (67.9% versus 20.9%, respectively; p<0.001).
3.3Long-term survival of the cohort and competing risks analysisA total of 61 patients died and 16 received a liver graft during the follow-up. The cumulative incidence of mortality or liver transplantation at 12, 24, and 48 months were 26.2% (95%CI: 19.4–34.0), 46.1% (95%CI 37.7–55.2), and 64.9% (95%CI 55.9–63.9), respectively (Fig. 2A). Excluding liver recipients, overall mortality at 12, 24, and 48 months were 19.8%, 35.9%, and 52.0%, respectively (Fig. 2B). In a competing risk analysis with liver transplantation, the presence of frailty was associated with mortality reaching a Hazard ratio (HR) of 4.93 (95%CI: 2.34–10.40; p<0.001). The cumulative incidence of mortality was higher in frail patients compared to non-frail patients (26.1% versus 5.9% at 12 months, 47.6% versus 12.0% at 24 months, and 68.2% versus 20.6% at 48 months, respectively; p-value<0.001) (Fig. 3). In the competing risk analysis against mortality, frailty did not affect the chance of being transplanted (HR of 0.50, 95%CI 0.19–1.33: p=0.167). We evaluated the LT free survival based on the score of FFP. Notably, we observed a statistically significant gradient in survival according to FFP score, with an impaired survival among those who scored at least 1 point compared to those who scored 0. Thus, mortality risk increased gradually, being the highest among those who scored 5, p-value<0.001 (Fig. 4).
. B: Stacked cumulative incidence of alive and free from transplantation, mortality, and liver transplantation.")

 FFP).' title='Free-transplant survival according to the Fried Frailty Phenotype (
Employing the FRAIL screening questionnaire, patients with a positive test had four-year mortality of 68.6% compared to 53.3% in those with a negative test (p<0.001).
We also evaluated the ability of low gait speed (<0.8m/s) to predict long-term mortality. In a competing risk analysis with liver transplantation, the presence of decreased gait speed was associated with mortality reaching a Hazard ratio (HR) of 2.96 (95%CI: 1.77–4.98; p<0.001). Patients with decreased gait speed also had a higher cumulative incidence of mortality compared to patients with normal gait speed (32.8% versus 13.3% at 12 months, 58.9% versus 26.2% at 24 months, and 79.9% versus 40.8% at 48 months, respectively; p-value<0.001) (Fig. 5). Competing against mortality, decreased gait speed was non-significantly associated with a lower liver transplantation probability with an HR of 0.16 (95%CI 0.02–1.24: p=0.080).
 at the enrolment of the study (considering a cut-off <0.8m/s).")
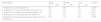
We performed a univariate analysis and then conducted a multivariate-adjusted model to improve the characterization of factors associated to mortality (Table 5). We included age, MELD score, ascites, hepatic encephalopathy, decreased gait speed (<0.8m/s), and frailty. Two separate analyses were performed to avoid collinearity: one including frailty and another including gait speed instead (Table 5). We observed that the only variables independently associated to mortality were MELD-Na score (HR 1.10, 95%CI 1.02–1.18; p=0.011), hepatocellular carcinoma (HR 3.15, 95%CI 1.80–5.50; p<0.001), Frailty: HR 4.24, 95% CI 1.89–9.51 (p<0.001) and gait speed: HR 3.27, 95% CI 1.74–6.14 (p<0.001).
Results from the univariate and multivariate competing risk analyses. Mortality is the primary event and transplant the competing risk. The variables of the multivariate analysis were chosen by statistical significance and clinical relevance.
| Variable | Univariate analysis | Multivariate analysis including frailty | Multivariate analysis including reduced gait speed | ||||||
|---|---|---|---|---|---|---|---|---|---|
| Hazard ratio (HR) | 95%CI | p-Value | Hazard ratio (HR) | 95%CI | p-Value | Hazard ratio (HR) | 95%CI | p-Value | |
| Frailty (FFP)* | 4.93 | 2.34–10.40 | <0.001 | 4.24 | 1.89–9.51 | <0.001 | – | – | – |
| Reduced gait speed (≤0.8m/s)* | 2.97 | 1.77–4.98 | <0.001 | – | – | – | 3.27 | 1.74–6.14 | <0.001 |
| Age (years) | 1.02 | 0.99–1.05 | 0.211 | – | – | – | – | – | – |
| Gender (female) | 0.85 | 0.51–1.40 | 0.519 | ||||||
| MELD-Na score | 1.13 | 1.06–1.19 | <0.001 | 1.10 | 1.02–1.19 | 0.010 | 1.10 | 1.02–1.19 | 0.010 |
| Child–Pugh score | 1.35 | 1.14–1.59 | <0.001 | – | – | – | – | – | – |
| Hemoglobin (g/dL) | 0.90 | 0.79–1.03 | 0.140 | – | – | – | – | – | – |
| Albumin (g/dL) | 0.70 | 0.46–1.07 | 0.103 | – | – | – | – | – | – |
| Total bilirubin (mg/dL) | 1.22 | 1.13–1.32 | <0.001 | – | – | – | – | – | – |
| Sodium (mEq/lt) | 0.95 | 0.91–1.00 | 0.046 | – | – | – | – | – | – |
| Platelets count | 1.00 | 0.99–1.01 | 0.160 | – | – | – | – | – | – |
| Creatinine (mg/dL) | 2.75 | 1.70–4.45 | <0.001 | – | – | – | – | – | – |
| INR | 1.02 | 0.91–1.14 | 0.745 | – | – | – | – | – | – |
| Hepatic encephalopathy† | 1.12 | 0.67–1.89 | 0.660 | 1.02 | 0.58–1.78 | 0.959 | 0.96 | 0.52–1.76 | 0.886 |
| Clinical ascites† | 1.32 | 0.79–2.23 | 0.292 | 0.87 | 0.50–1.52 | 0.635 | 1.10 | 0.60–2.02 | 0.750 |
| Hepatocarcinoma† | 3.38 | 1.93–5.92 | <0.001 | 3.15 | 1.80–5.50 | <0.001 | 2.82 | 0.52–1.76 | 0.003 |
| Esophageal varices† | 0.62 | 0.35–1.10 | 0.105 | – | – | – | – | – | – |
Abbreviations: FFP: Fried Frailty Phenotype; INR: International Normalized Ratio; MELD-Na: Model for End-Stage Liver Disease-Sodium.
Frailty is a multidimensional concept including physical and psychosocial components. It is considered an extreme consequence of the aging process and is characterized by a decline in multiples physiological systems and increased vulnerability to stressors. It is associated with an increased risk of falls, fractures, disability, lower quality of life, cognitive decline, depression, dementia, hospitalization, admission to long-term care, and death [11]. Being a continuum of disease, the severity of frailty is associated with higher health care use and cost [21].
Compared to other studies, our cohort showed a high prevalence of frailty (65.1%). This difference can be explained by our inclusion criteria that required patients older than 50 years and liver dysfunction. In fact, mean age was 64.0 years, hypertension was present in 36.4%, and 48.8% had diabetes, half of patients had esophageal varices, and a similar proportion had ascites. These findings can be explained by our cohort's characteristics considering that two of the centers included are transplant centers and concentrate sicker patients. On the other hand, Chile is a country with severe economic and cultural inequalities. Thus, improper nourishment is common among persons with lower income, which is a significant proportion of our cohort. Regardless, the notoriously high frequency of frailty in our cohort reinforces the need for prehabilitation programs to prepare frail patients for transplantation or improve their tolerance to acute decompensation and improve rehabilitation after a noxious event.
Very interestingly, the presence of frailty was strongly related to long-term survival. Thus, 12 months cumulative incidence of mortality was 5.9% in non-frail and 26.1% in frail patients. This difference gradually increased in the follow-up. In fact, 48 months cumulative incidence of mortality was 20.6% in non-frail patients and 68.2% among frail patients. Considering that the assessment of frailty employing FFP requires training and a dedicated amount of time, we evaluated its isolated components to identify a high-risk population (Table 2). Thus, we found that those patients with a reduced gait speed (<0.8m/s) had markedly higher mortality at 12 months (32.8% versus 13.3%), 24 months (58.9% versus 26.2%), and at 48 months (79.9% versus 40.8%). For this reason, although only 26.9% of patients had an altered gait speed, it seems to be a useful tool to discriminate patients at risk of death.
Interestingly, gait speed has been previously related to adverse outcomes such as hospitalization, liver transplant waitlist dropout, and mortality [4,5,22]. Thus, we validated this prior recommended gait speed threshold, which has been associated with a higher risk of institutionalization, falls, cognitive declined, and death. Gait speed seems to be a robust prognostic factor also in cirrhotic patients. In fact, it seems to improve the prognostic yield of MELD score [23].
Frailty screening questionnaire had a poor ability to identify frail patients compared to FFP. Considering this and that FFP is easy to perform, we recommend FFP as a more useful tool.
Interestingly, we found that the mortality risk gradually increases with higher FFP scores. Thus, survival was higher in patients who scored 0 versus those who scored 1–2. Similarly, survival was increased in those who scored 1–2 versus those who scored 3–4. Thus, the highest mortality risk was found among those who scored 5 FFP points (Fig. 4).
As it was mentioned, frailty comprises a myriad of variables of different systems, including psychiatric diseases. Our study found a markedly increased risk of depression in frail patients as suggested by the higher frequency of a positive GDS-5 test (67.9% versus 20.9%, in the non-frail group; p<0.001). This is an important finding considering that depression is not usually screened in decompensated cirrhotic patients. Very importantly, depression seems to increase the risk of frailty, as suggested by a recent meta-analysis [24]. Thus, its screening in frail population is warranted.
Considering that frailty is a significant predictor of the waitlist and post-transplant mortality, the use of interventions to improve patient status is desirable [25–27]. The quality of the available information will probably be improved by ongoing studies such as SPRINTT study (Sarcopenia and Physical fRailty IN older people: multi-componenT Treatment strategies) that test physical and nutritional interventions [28]. Even though, it is advisable that in every patient, frailty detection could be followed by interventions directed to improve functional status, nutrition, and muscle mass recovery to eventually reduce morbidity and mortality in waiting list and in the post-transplantation period. Very recently, The American Transplant Society published recommendations for frail patients based on the intensity of their disability to improve its condition on waitlist and the results after liver transplantation [29].
Interestingly, although grip strength was markedly reduced in frail patients compared to the non-frail group, muscle mass was similar between both groups (Table 3). This finding suggests that muscle dysfunction in frail patients could explain the reduced strength although muscle mass seems to be preserved.
We are aware that our study has some limitations. Although other tests could be chosen, we decided to employ FFP considering our previous experience and expertise. Besides, its simplicity can improve the chance that other clinicians can employ it. Our study was designed to be focused on a hard endpoint (survival). Thus, we did not assess other secondary outcomes such as the number of hospitalizations, acute decompensations, cognitive decline, and falls, which would require a different design. Finally, although we performed the test only at the beginning of the follow up its robustness was good enough to predict the outcome of the frail patients being this the aim of our study.
Importantly, to avoid collinearity, we performed two separated multivariate analyses, including frailty in the first and gait speed in the second. We found that frailty, as well as gait speed, are independently related to mortality (Frailty: HR 4.24, 95% CI 1.89–9.51 (p<0.001), gait speed: HR 3.27, 95% CI 1.74–6.14 (p<0.001)). This is a truly relevant fact that allows to identify a group of high-risk patients to focalize specific interventions on them. Added to typical scores and markers usually employed in cirrhosis (i.e., Child–Pugh score, MELD-Na score, ascites, hepatic encephalopathy) frailty and altered gait speed have the potential to improve prognostic prediction. Thus, specific interventions to reverse frailty or slow its progression could be employed in these patients in order to avoid adverse outcomes. Considering that gait speed measurement has the advantage of not being time-consuming and allows successive objective determinations, it could be particularly useful to evaluate the impact of eventual interventions. Very interestingly, frailty and gait speed can predict mortality in the midterm and long-term, considering that the median follow-up in this series is 881 [349–1277] days. Thus, it can be clearly seen that survival curves tend to diverge even four years after the start of follow-up (Figs. 3 and 5).
5ConclusionIn our cohort, Fried Frailty Phenotype and gait speed are independently related to long term mortality in cirrhotic patients. Further studies to evaluate the utility of FFP and gait speed to assess the impact of interventions on frail patients are warranted.
ContributorsRS, LAD, and CB are responsible for the overall content of the project and the manuscript submitted as guarantors of the project. RS, LAD, VR, and MZ had full access to all the data in the study. LAD and VR take responsibility for the integrity of the data and the accuracy of the data analysis. CB, RS, LAD, VR, and RS took the final decision to submit for publication. Study concept and design: RS and CB. Acquisition of data: RS, LAD, VR, MZ, MJB, GM, and CG. Analysis or interpretation of data: RS, LAD, VR, and CB. Drafting of the manuscript: LAD, VR, and CB. Critical revision of the manuscript for relevant intellectual content: CB, RS, LAD, VR, GM. Statistical analysis: LAD and EF.
Financial supportThis study does not have sources of funding.
Conflict of interestThe authors reported no potential conflict of interest.
None declared.


