


Hepatic encephalopathy (HE) is a complication of cirrhosis linked to the microbiome. We aimed to characterize the fecal microbiome of patients with prior and future overt HE, and explore the relationship between fecal species, short-chain fatty acids (SCFAs) and ammonia on HE pathogenesis.
Materials and methodsConsecutive inpatients and outpatients with cirrhosis were recruited. A single stool sample was collected and underwent shallow shotgun sequencing, and SCFA and ammonia quantification. Patients were followed until the end of the study period. Prior and new overt HE was diagnosed by the treating hepatologist.
ResultsForty-nine patients with cirrhosis, mean MELD-Na 20 (SD = 9) and 33 (67%) with a history of OHE provided a stool sample. Over a median 85 days of follow up (interquartile range 34–181 days), 16 developed an OHE episode. Eight fecal bacterial species were associated with a history of OHE, and no species predicted future OHE. Bacterial species positively associated with SCFA content were inversely related to cirrhosis disease severity. Patients with a history of OHE had lower concentrations of 6 fecal SCFAs. Fecal ammonia concentrations were similar between those with and without a history of OHE (273 μmol/g ± 214 vs. 327 ± 234, P = 0.43).
ConclusionsWe found 8 fecal species and 6 SCFAs linked to OHE. Many of the species inversely linked to OHE also have an association with SCFA production. Further work is needed to detail this relationship and to develop targeted interventions to treat HE.
Lay Summary
This study found that specific bacteria and short-chain fatty acids were associated with a common and dangerous complication of cirrhosis, hepatic encephalopathy. Many of the bacteria low in hepatic encephalopathy are known to produce short-chain fatty acids, which help to maintain the integrity of the intestinal barrier. These bacteria and short-chain fatty acids may represent targets for future intervention in the treatment of hepatic encephalopathy.
Hepatic encephalopathy (HE) is a common complication of cirrhosis. HE is a state of cognitive and psychomotor dysfunction that leads to considerable morbidity and mortality [1]. Decades of investigation have steadily refined our understanding of its pathogenesis, now believed to be related to intestinal microbial products reaching the brain via portosystemic shunts, together with impaired hepatic clearance [2]. Ammonia has emerged as a marker of particular significance, as it is produced by intestinal flora and contributes to HE pathogenesis. Factors that influence intestinal mucosal barrier integrity, such as short-chain fatty acids (SCFAs), may also contribute to HE development [3,4].
Microbiome sequencing techniques have evolved dramatically in the last decade. New techniques able to identify genus or species-level taxonomic information, and assess activity of functional pathways, are increasingly becoming standard. The first studies investigating the association between microbiome communities and HE found that high-level taxonomic groups, at the family or phyla level, were associated with cognition [5]. More recently, specific genus and even species level taxa have been associated with the presence of minimal HE (MHE) and elevated ammonia [6,7]. While a growing literature has demonstrated that specific taxa may be associated with prior overt HE (OHE) or current MHE, very little has been done to identify microbiome features that predict the future development of HE.
Bacteria within a phyla or family vary considerably in function and host effects. Modern sequencing techniques can provide additional taxonomic specification and functional information. We sought to use contemporary sequencing techniques and a prospective patient cohort to characterize the fecal microbiome of patients with OHE and identify a microbiome signature that predicts the development of future OHE. We further aimed to explore the effect of fecal SCFAs and ammonia on the relationship between influential species and HE pathogenesis.
2Methods2.1Study designConsecutive patients with a diagnosis of cirrhosis presenting to the Massachusetts General Hospital from March 2018 to March 2019 were recruited after obtaining informed consent. The inpatient hepatology service was the main source of patient enrollment, and several outpatients were enrolled based on ability to provide a stool sample. A total of forty-nine patients were enrolled. Another 28 patients provided informed consent but were unable to provide a stool sample. Cirrhosis was determined by liver biopsy, evidence of prior decompensating event, or clinical diagnosis by a hepatologist. To enhance external validity, patients were not excluded based on etiology of cirrhosis, prior or current decompensations, disease severity, or medication use. This study was approved by the Partners HealthCare institutional review board.
Demographic data, comorbid conditions, laboratory values from the time of collection, and medications were identified via chart review. MELD-Na was calculated from laboratory values at the time of stool collection. After providing a stool sample, patients were followed until they experienced an episode of OHE, liver transplantation, death, or end of the study period, October 2019. Patients were followed by chart review and phone calls to determine the timing of these events. The diagnosis of OHE was made by the hepatology consulting team.
2.2Stool sequencing analysisPatients were instructed to collect stool samples, immediately place on ice, and then submit to investigators to store in a −80 °C freezer. All extractions and sequencing were performed by CoreBiome (St. Paul, MN) [8,9]. Genomic DNA was extracted for all samples using MO Bio PowerFecal DNA isolation kit (Qiagen, Germany) according to manufacturer’s instructions, and all downstream processing and sequencing was performed according to standard CoreBiome protocols [8]. Extracted DNA was quantified and qualified using Quant-iT PicoGreen dsDNA assay and NanoDrop-8000 UV–vis Spectrophotometer (Thermo Fisher Scientific, USA). Metagenomic sequencing libraries were prepared with 1 ng of input DNA using a procedure adapted from the Nextera Library Prep kit (Illumina, USA). Libraries were pooled and quantified using Quant-iT PicoGreen dsDNA Assay Kit (Thermo Fisher Scientific, USA) and an Agilent Bioanalyzer High Sensitivity DNA assay (Agilent Technologies, USA). The indexed libraries were sequenced using a 150 cycle NextSeq kit (Illumina, USA), producing a mean of 0.5 million reads/sample at high quality scores.
Alignment was performed using several existing pathways including Bowtie2, Centrifuge, and Kraken [8]. Shallow shotgun reads were first introduced into a pipeline including removal of human reads and quality control of samples. Shotgun samples were quality controlled using FASTQC, followed by quality trimming (PHRED quality score >20) on both ends and adapter removal. Read pairs less than 80 bp required an average quality score of >30 to be retained. Bioinformatics analysis was performed via sequencing pipelines and in-house analyses. These were then mapped using alignment tools against reference genomes via BURST to publicly available NCBI RefSeq, with only the best hit retained for further taxonomic analysis (using a minimum 95% identity threshold). Since samples were processed in triplicate, taxonomic counts were averaged across the replicates for down-stream analysis.
2.3Short-chain fatty acid and ammonia analysisAmmonia and SCFA analyses from fecal samples were performed by Biopharmaceutical Research, Inc. (BRI; Vancouver, BC, Canada). SCFAs (including acetic acid, propionic acid, butyric acid, valeric acid, isovaleric acid, isobutyric acid, lactic acid, maleic acid, and succinic acid) were quantitated using LC-MS/MS. This method was developed and qualified at BRI based on a chemical derivatization method with 3-nitrophenylhydrazine (3NPH) to enable simultaneous reverse phase LC-MS/MS. Briefly, pooled 4% (w/v) fecal homogenates (from 3 healthy donors) were prepared in 1:1 v/v ACN:diH2O by vortex mixing for 5 min and sonicating for 5 min to extract analytes. Homogenates were subsequently diluted to 1% (w/v) and centrifuged to obtain supernatant. An aliquot of the supernatant of each sample was derivatized in a mixture consisting of 40 mM 3NPH, 37.5 mM N-(3-dimethylaminopropyl)-N’-ethylcarbodiimide HCl, and 1.5% (v/v) pyridine in 1:1 v/v ACN:diH2O at 40 °C for 90 min. This was followed by dilution with 2 mL of 10% ACN in diH2O. Following sample derivatization, an aliquot of a labelled internal standard mixture (reacted similarly) containing 0.5% (w/v) H2O2 was added to all samples prior to LC-MS/MS analysis.
Ammonia was analyzed using the Ammonia Assay Kit from Abcam (Cat. No. ab83360) according to manufacturer’s instruction, validated in human feces and qualified at BRI.
2.4Statistical analysisWe used a parametric t-test or Fisher’s exact test to compare clinical characteristics of patients with prior or current OHE and those with no prior HE. These non-microbiome data were analyzed with SAS version 9.4 (Cary, NC).
Downstream visualization and statistics on the taxonomic abundance data were performed by the Harvard T.H. Chan School of Public Health Microbiome Analysis Core. Briefly, the ecological metrics of alpha and beta diversity were calculated to examine within and between-sample differences in microbial composition. Alpha diversity was calculated using the vegan package in R, specifically, the diversity function, and the InvSimpson metric was used for downstream comparisons [10]. Differences between alpha diversity and clinical metadata were tested for using a standard ANOVA on linear models and scatter plots or box plots were used to visualize trends for continuous or categorical data, respectively. The feature table was then filtered requiring all taxa to be at least 10% prevalent and have at least 0.01% abundance. Beta diversity was calculated using the vegdist function from the vegan package in R and utilizing Bray-Curtis dissimilarity which considers the prevalence and abundance of each clade within the samples’ microbiome, then conducts pairwise testing to calculate the relative change in microbial composition between each sample. The maximum percent compositional change (R2) associated with each clinical covariate was calculated using an omnibus univariate PERMANOVA test on the Bray-Curtis dissimilarities. Additionally, multivariate models were conducted using a PERMANOVA test on the Bray-Curtis dissimilarities with the adonis function within the vegan package in R. Further, principal coordinate analysis (PCoA) plots were created on the Bray-Curtis dissimilarities. To display the samples’ community compositions, stacked bar plots and heat maps on taxonomic relative abundances were constructed on the top 30 taxa and annotated with the metadata.
After establishing the global trend in the microbiome over metadata, per feature associations between the gut compositions and metadata were identified using MaAsLin 2.0. MaAsLin employs mixed linear models to calculate in a hierarchical manner all features’ associations with the clinical metadata. Count data is normalized using relative abundance calculations and log-transformed before testing. Among each of the comparisons generated, multiple comparisons are adjusted using a Benjamini and Hochberg correction and false discovery rate corrected p-values of 0.25 or lower are reported as significant. Thus, MaAsLin identifies microbial organisms that reach a statistically significant association with each of the metadata variables. Key clinical metadata included: age, antibiotic use in the last 30 days, lactulose use in the last 30 days, rifaximin use in the last 30 days, OHE prior or current, proton pump inhibitor (PPI) use in the last 30 days, fecal ammonia and SCFA levels. These analyses were performed at multiple taxonomic levels, as deep as species level.
Taxa that were found to significantly associate with current or prior OHE (q-values <0.05) from MaAsLin2, were selected for further analysis via stepwise linear regression to other clinical metadata (including SCFAs as biomarkers). Briefly, these logistic regression models were conducted with current or prior OHE as the dependent variable and log10 relative abundance plus a pseudocount of each individual taxon as an independent variable after controlling for other covariates in the models. Logistic regressions were performed by the following means: using the glm function of the stats package in R, including the parameter option family = binomial (link = “logit”), then using the exp, coef, and confint functions to calculate the odds ratios and 95% confidence intervals using log-likelihood. Then, an analysis of deviance chi-square test was performed on the logistic regression glm test output.
Spearman correlations between the top 25 and top 50 microbial taxa relative abundances and fecal metabolites were performed using the rcorr function from the Hmisc package in R [11]. Heat maps and bar plots were constructed to portray correlations and statistical significance among microbial taxa and metabolites. Additionally, to further validate the findings of the dataset, a robust random forest analysis was conducted utilizing a seed of 123 values to train the analysis, and to a depth of 1000 unique trees. The same analyses were then performed to identify taxa associated with the development of future OHE in the 90 days after stool collection. Patients who died, underwent liver transplantation, or were lost to follow up with 90 days were not included in that analysis. All diversity trends and community composition visualizations were created using the ggplot2 package in R [12].
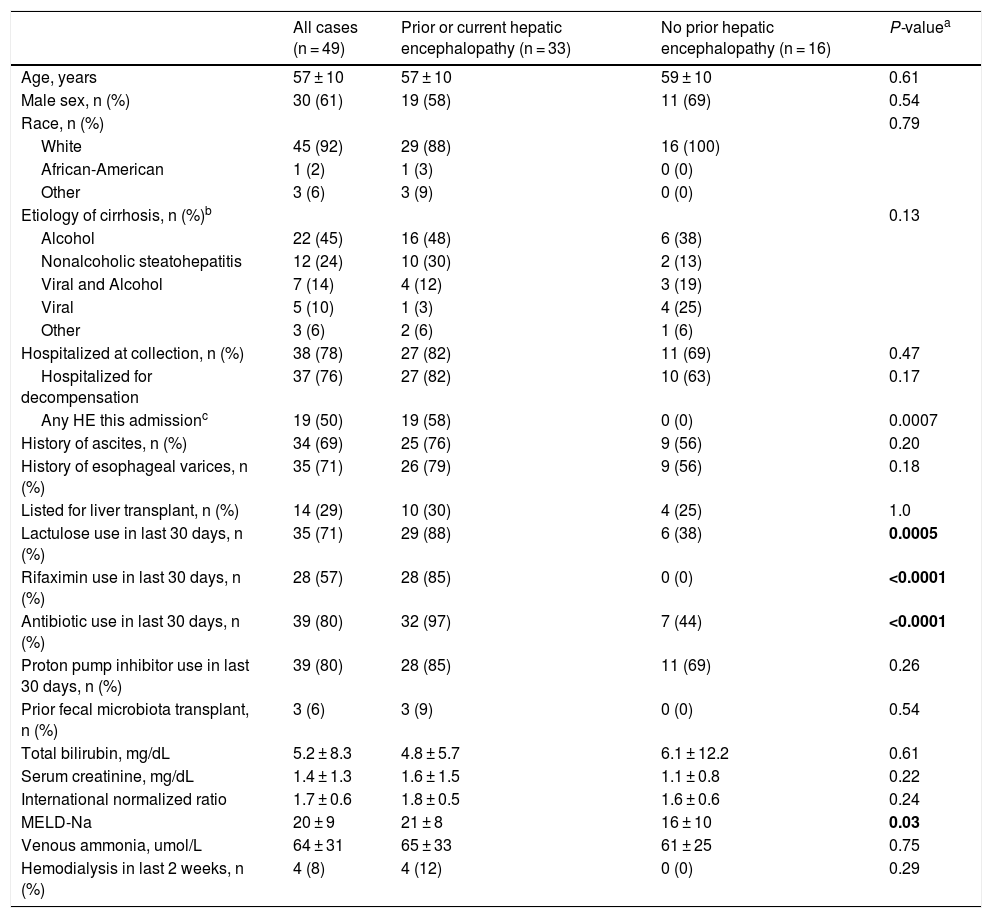
3ResultsStool samples were obtained from 49 patients with cirrhosis. The average age of the cohort was 58 years (SD = 10), 61% were men, 92% were white, and mean MELD-Na was 20 (SD = 9). Etiology of cirrhosis was alcohol-associated in 45%, non-alcoholic steatohepatitis in 24%, viral and alcohol-related in 14%, and viral in 10%. Most stool samples were collected during a hospital admission (78%). Of those hospitalized at the time of collection, 19 (50%) experienced OHE during that hospitalization. All baseline characteristics are described in Table 1.
Patient characteristics at the time of stool collection.
| All cases (n = 49) | Prior or current hepatic encephalopathy (n = 33) | No prior hepatic encephalopathy (n = 16) | P-valuea | |
|---|---|---|---|---|
| Age, years | 57 ± 10 | 57 ± 10 | 59 ± 10 | 0.61 |
| Male sex, n (%) | 30 (61) | 19 (58) | 11 (69) | 0.54 |
| Race, n (%) | 0.79 | |||
| White | 45 (92) | 29 (88) | 16 (100) | |
| African-American | 1 (2) | 1 (3) | 0 (0) | |
| Other | 3 (6) | 3 (9) | 0 (0) | |
| Etiology of cirrhosis, n (%)b | 0.13 | |||
| Alcohol | 22 (45) | 16 (48) | 6 (38) | |
| Nonalcoholic steatohepatitis | 12 (24) | 10 (30) | 2 (13) | |
| Viral and Alcohol | 7 (14) | 4 (12) | 3 (19) | |
| Viral | 5 (10) | 1 (3) | 4 (25) | |
| Other | 3 (6) | 2 (6) | 1 (6) | |
| Hospitalized at collection, n (%) | 38 (78) | 27 (82) | 11 (69) | 0.47 |
| Hospitalized for decompensation | 37 (76) | 27 (82) | 10 (63) | 0.17 |
| Any HE this admissionc | 19 (50) | 19 (58) | 0 (0) | 0.0007 |
| History of ascites, n (%) | 34 (69) | 25 (76) | 9 (56) | 0.20 |
| History of esophageal varices, n (%) | 35 (71) | 26 (79) | 9 (56) | 0.18 |
| Listed for liver transplant, n (%) | 14 (29) | 10 (30) | 4 (25) | 1.0 |
| Lactulose use in last 30 days, n (%) | 35 (71) | 29 (88) | 6 (38) | 0.0005 |
| Rifaximin use in last 30 days, n (%) | 28 (57) | 28 (85) | 0 (0) | <0.0001 |
| Antibiotic use in last 30 days, n (%) | 39 (80) | 32 (97) | 7 (44) | <0.0001 |
| Proton pump inhibitor use in last 30 days, n (%) | 39 (80) | 28 (85) | 11 (69) | 0.26 |
| Prior fecal microbiota transplant, n (%) | 3 (6) | 3 (9) | 0 (0) | 0.54 |
| Total bilirubin, mg/dL | 5.2 ± 8.3 | 4.8 ± 5.7 | 6.1 ± 12.2 | 0.61 |
| Serum creatinine, mg/dL | 1.4 ± 1.3 | 1.6 ± 1.5 | 1.1 ± 0.8 | 0.22 |
| International normalized ratio | 1.7 ± 0.6 | 1.8 ± 0.5 | 1.6 ± 0.6 | 0.24 |
| MELD-Na | 20 ± 9 | 21 ± 8 | 16 ± 10 | 0.03 |
| Venous ammonia, umol/L | 64 ± 31 | 65 ± 33 | 61 ± 25 | 0.75 |
| Hemodialysis in last 2 weeks, n (%) | 4 (8) | 4 (12) | 0 (0) | 0.29 |
Plus-minus values are means ± SD. MELD-Na denotes Model for End Stage Liver Disease-Sodium; HE hepatic encephalopathy; A1AT alpha 1 anti-trypsin deficiency.
Of the 49 patients in our cohort, 33 (67%) had a history of OHE prior to or during that hospitalization. Patients with prior or current OHE were more likely to have used lactulose (88% vs. 38%, P = 0.0005), rifaximin (85% vs. 0%, P < 0.0001), or antibiotics including rifaximin (97% vs. 44%, P < 0.0001) in the 30 days prior to stool collection, and also had a higher MELD-Na score (22 ± 8 vs. 16 ± 10; P = 0.03). They otherwise did not differ on age, gender, race, etiology of cirrhosis, hospitalization status, other hepatic complications, proton pump inhibitor use, or venous ammonia levels (65 ± 33 vs. 61 ± 25; P = 0.75).
Over the course of a median 85 days of follow up (interquartile range 34–181 days), six patients died, two underwent liver transplantation, and 16 developed an OHE episode. Of those with future OHE episodes, 14 occurred within 90 days of stool collection.
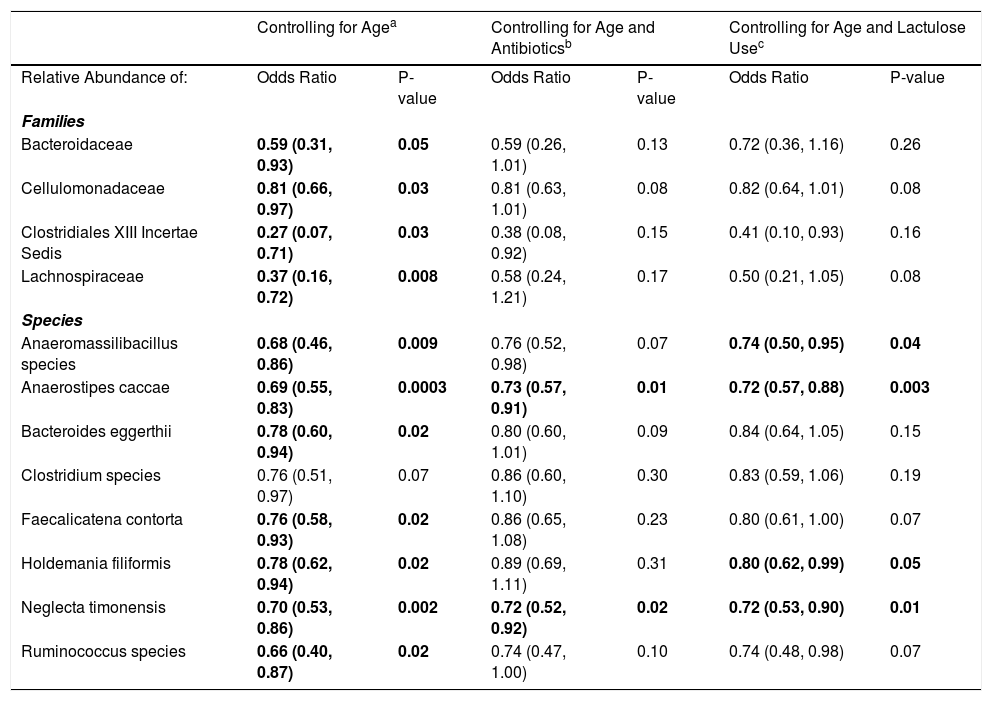
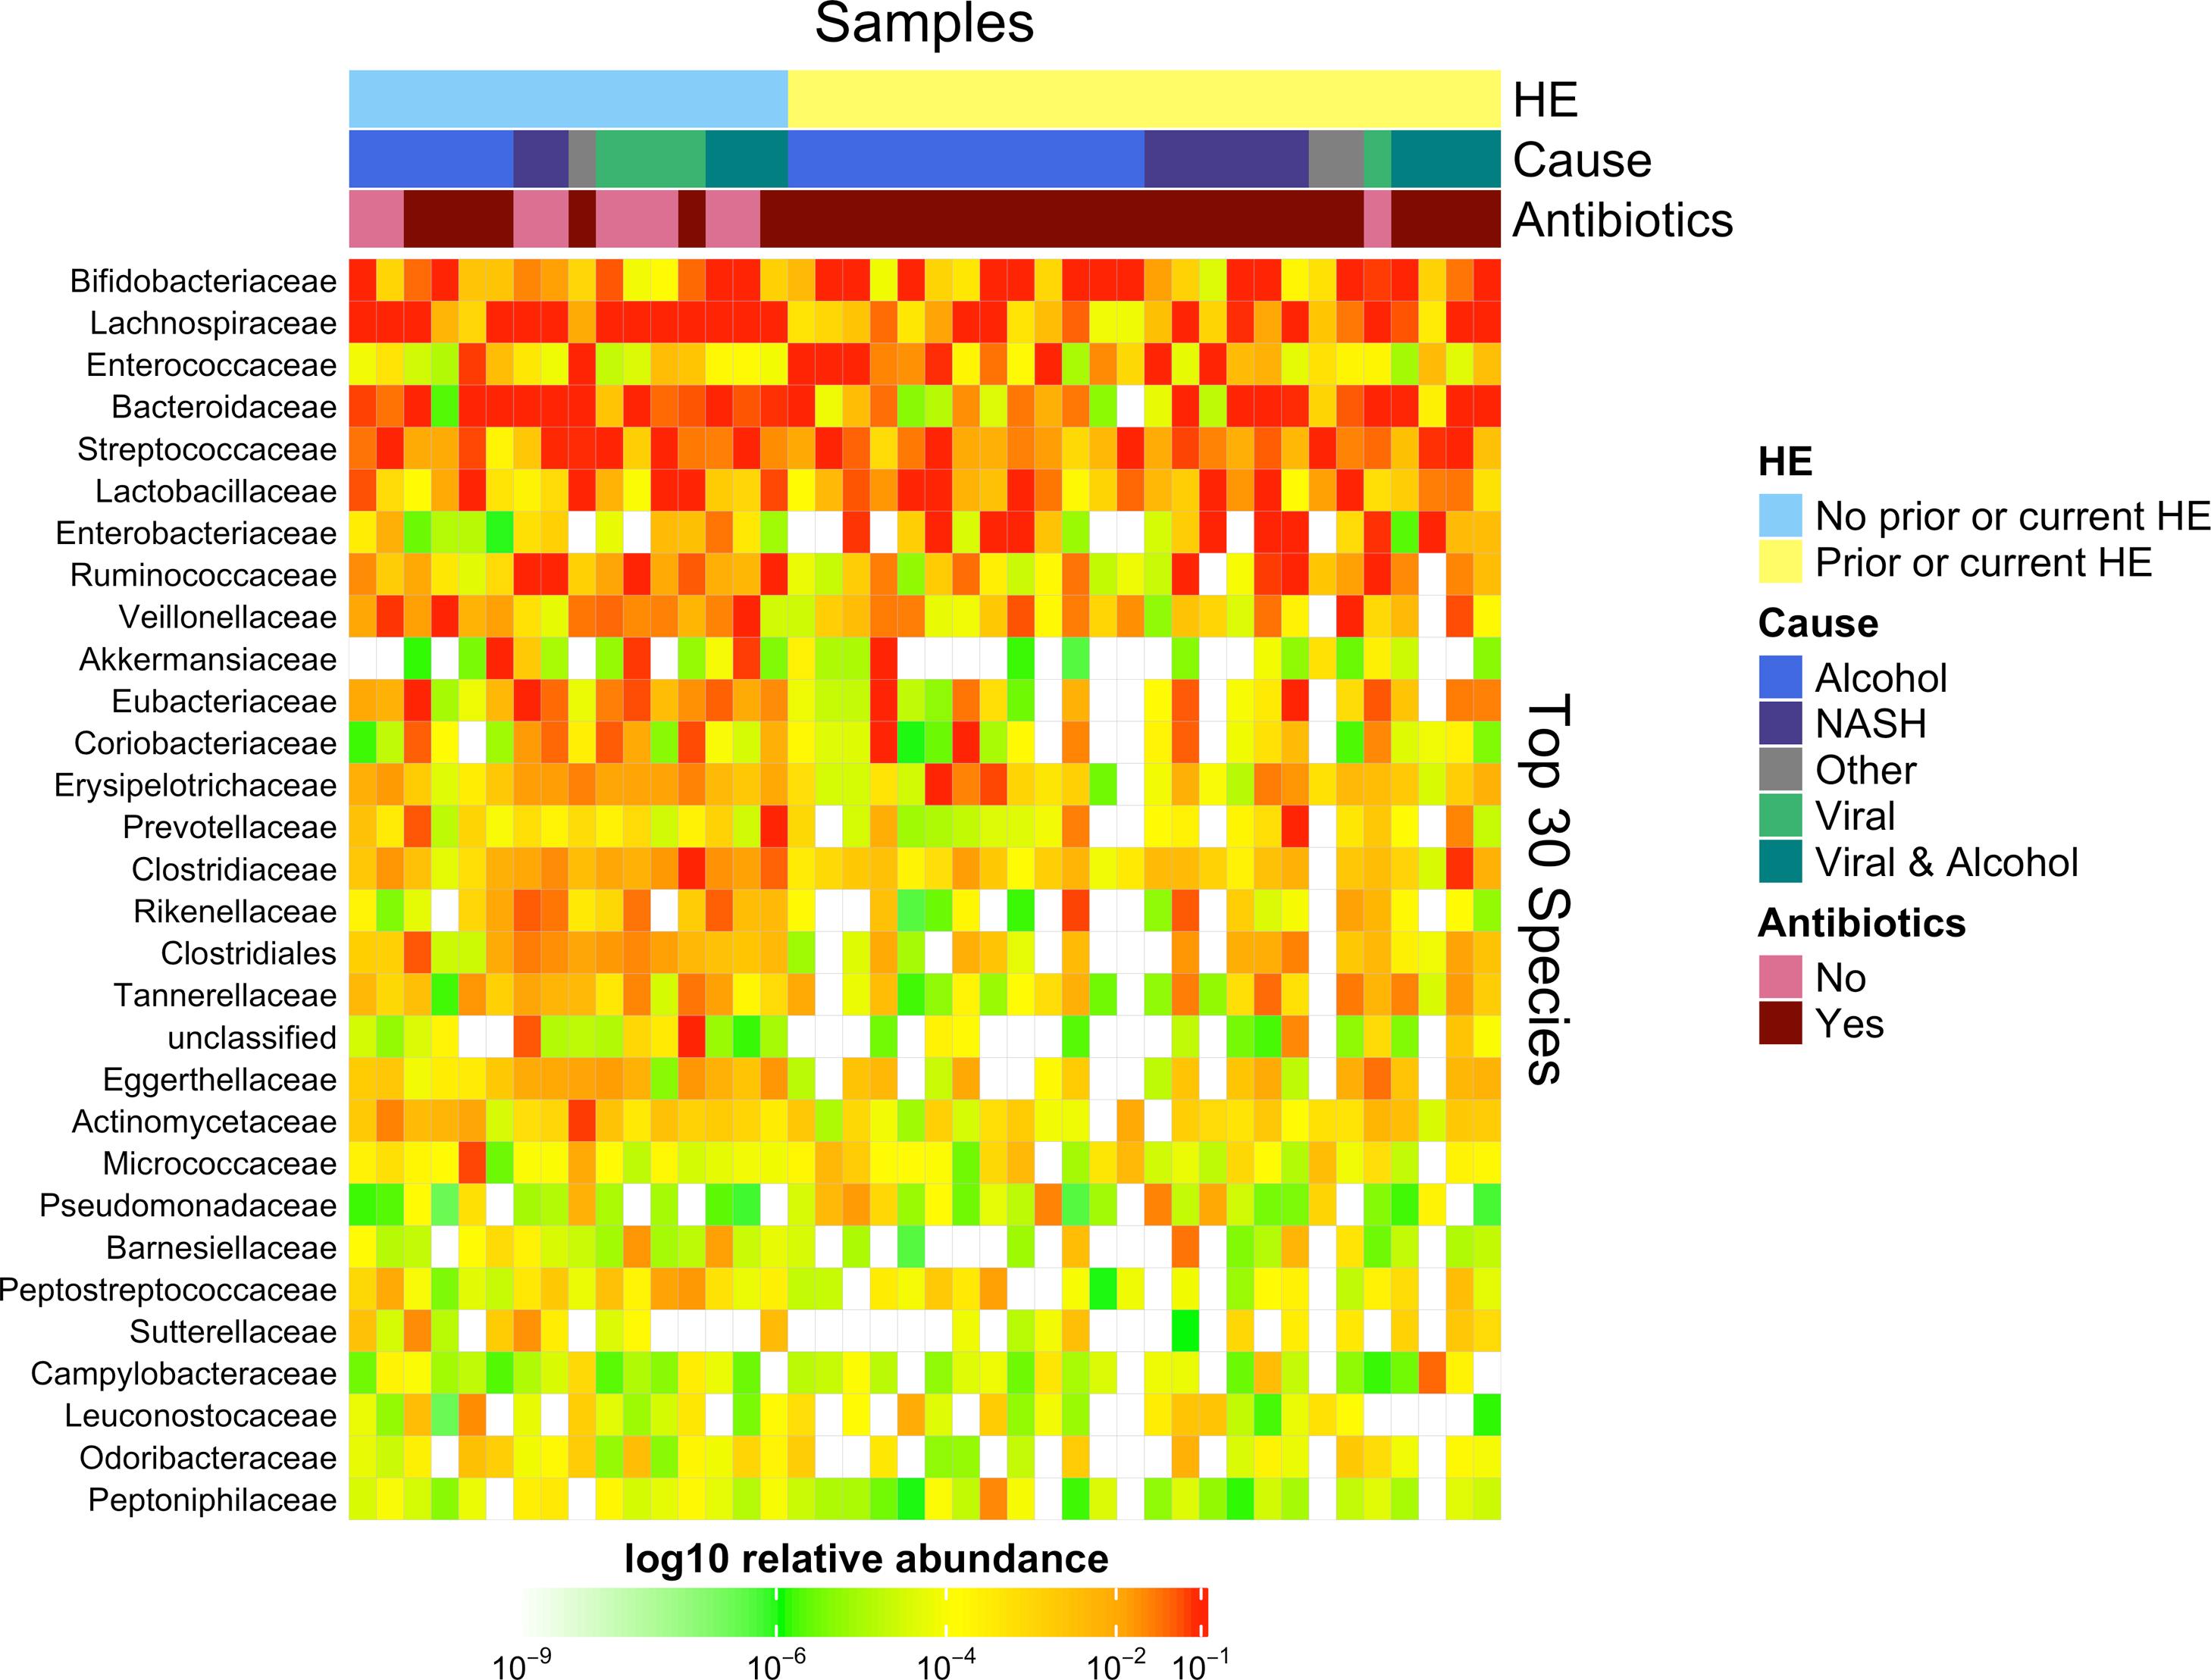
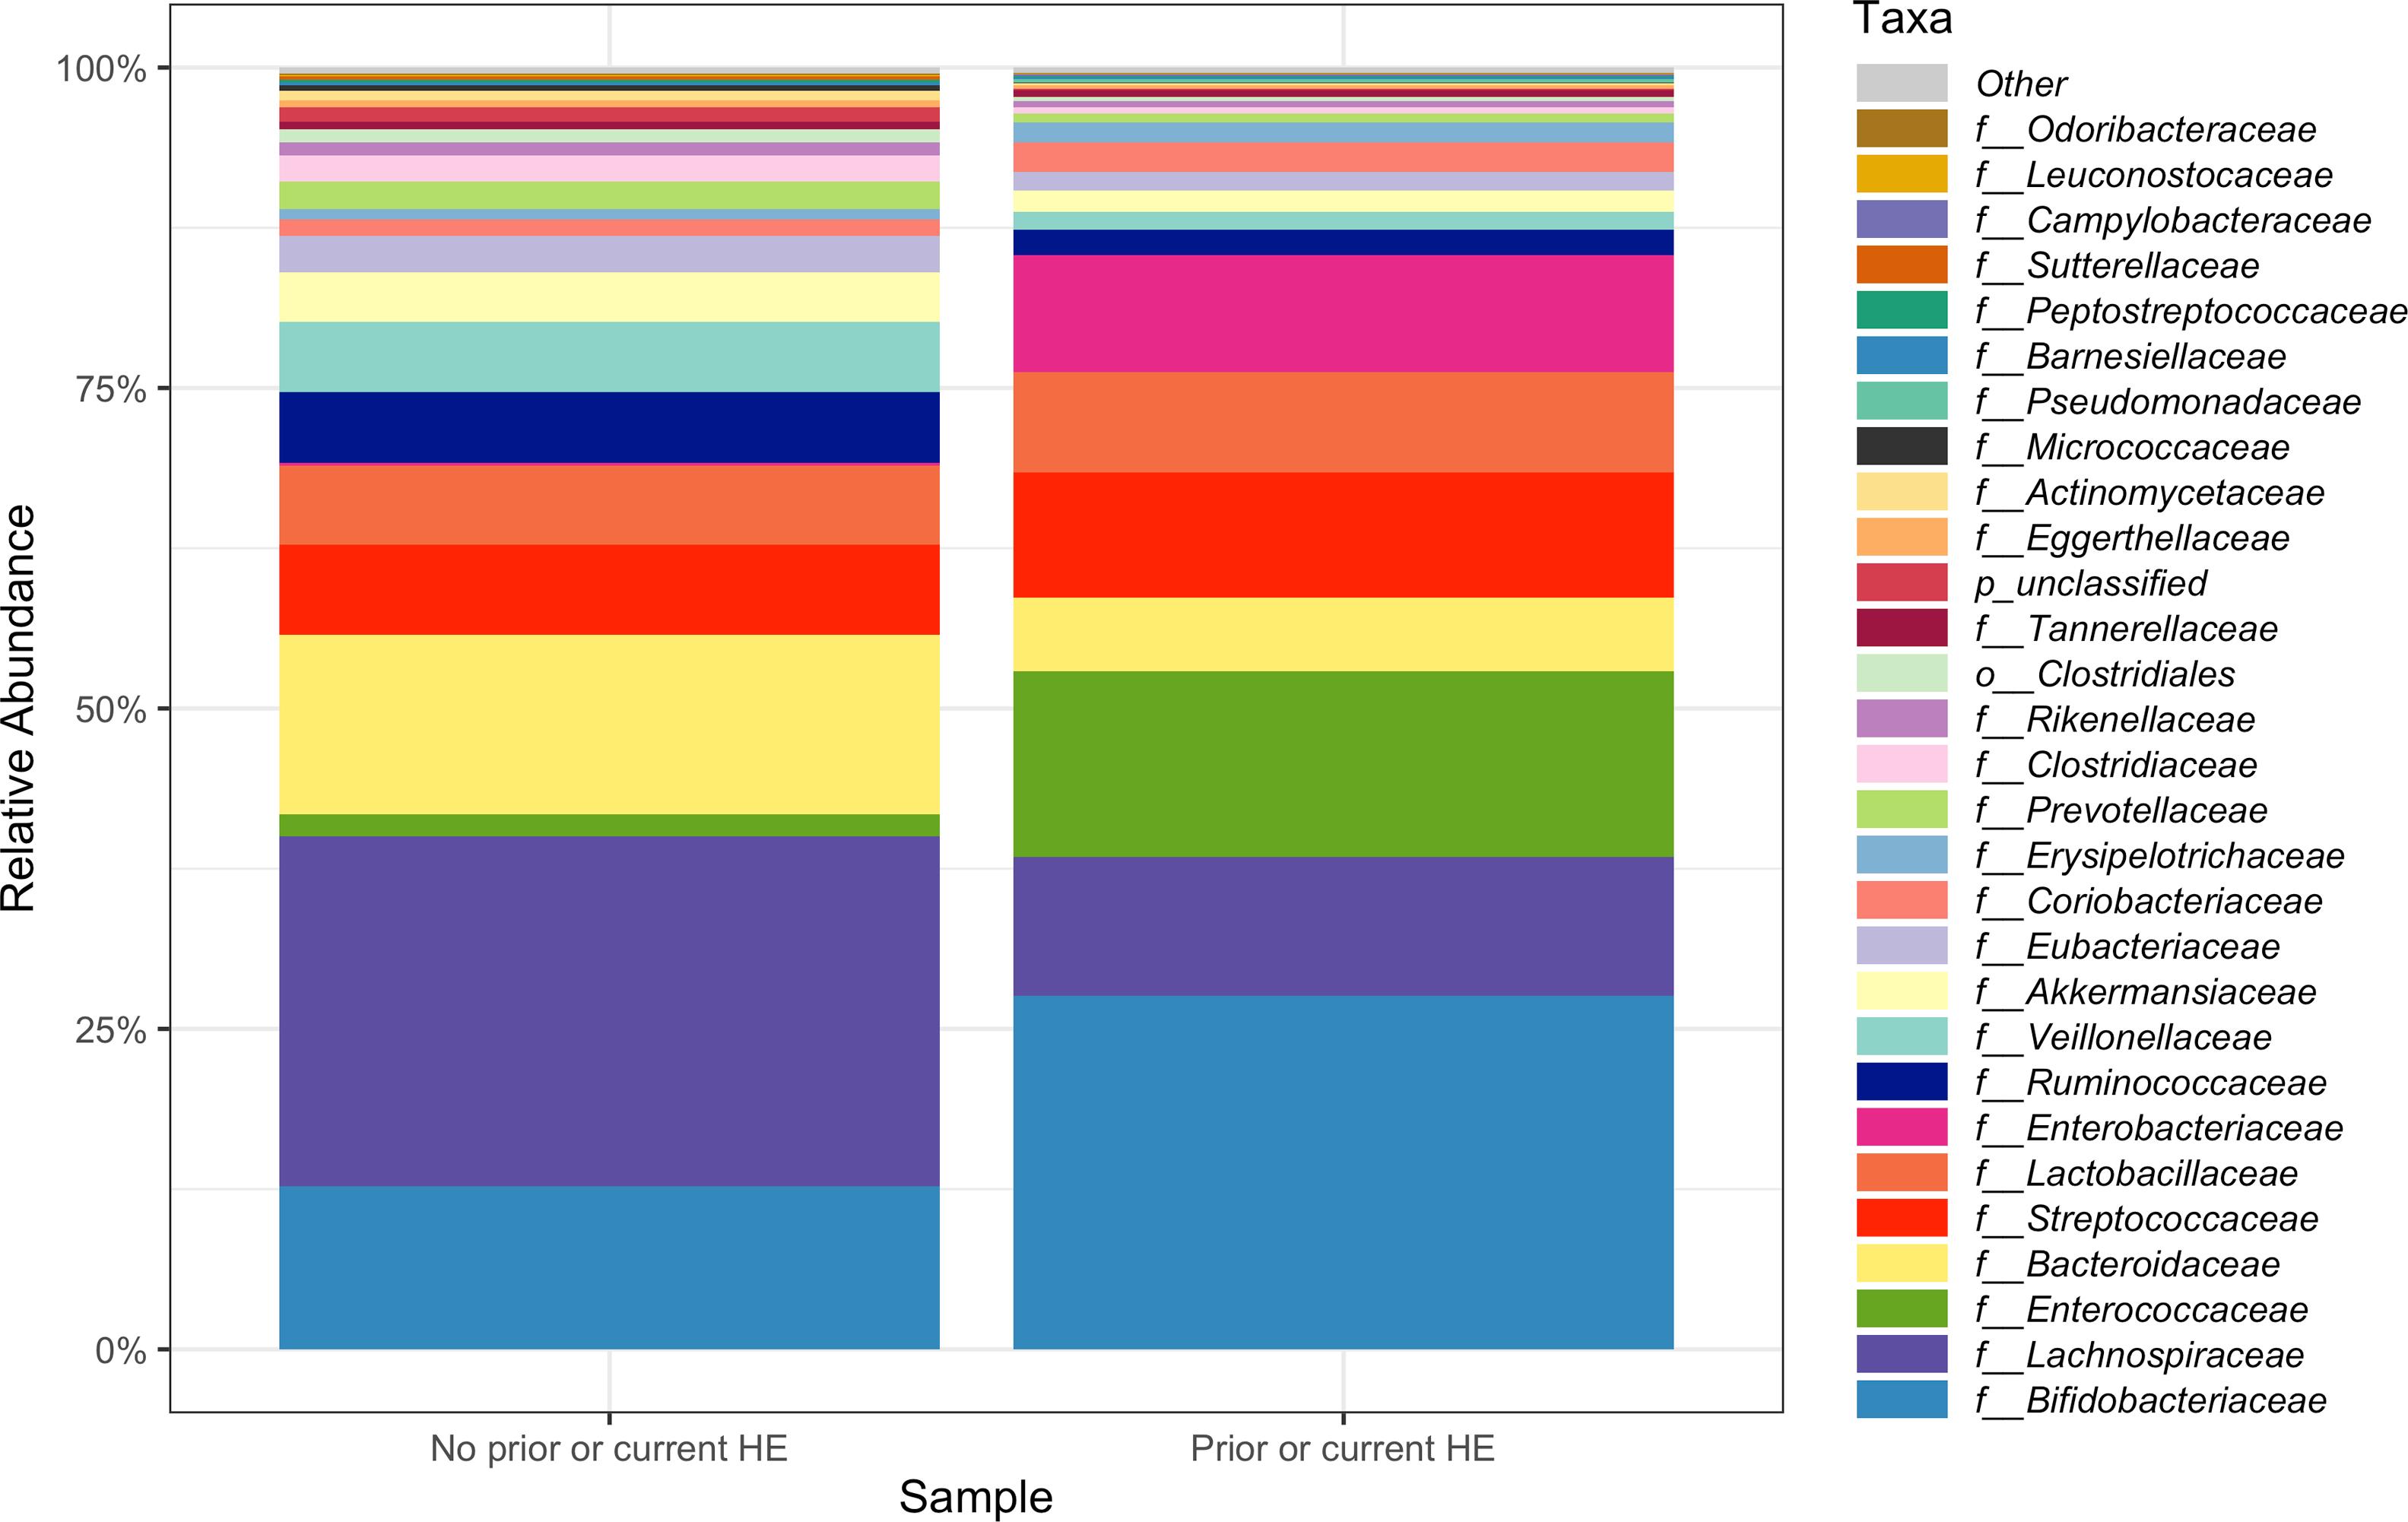
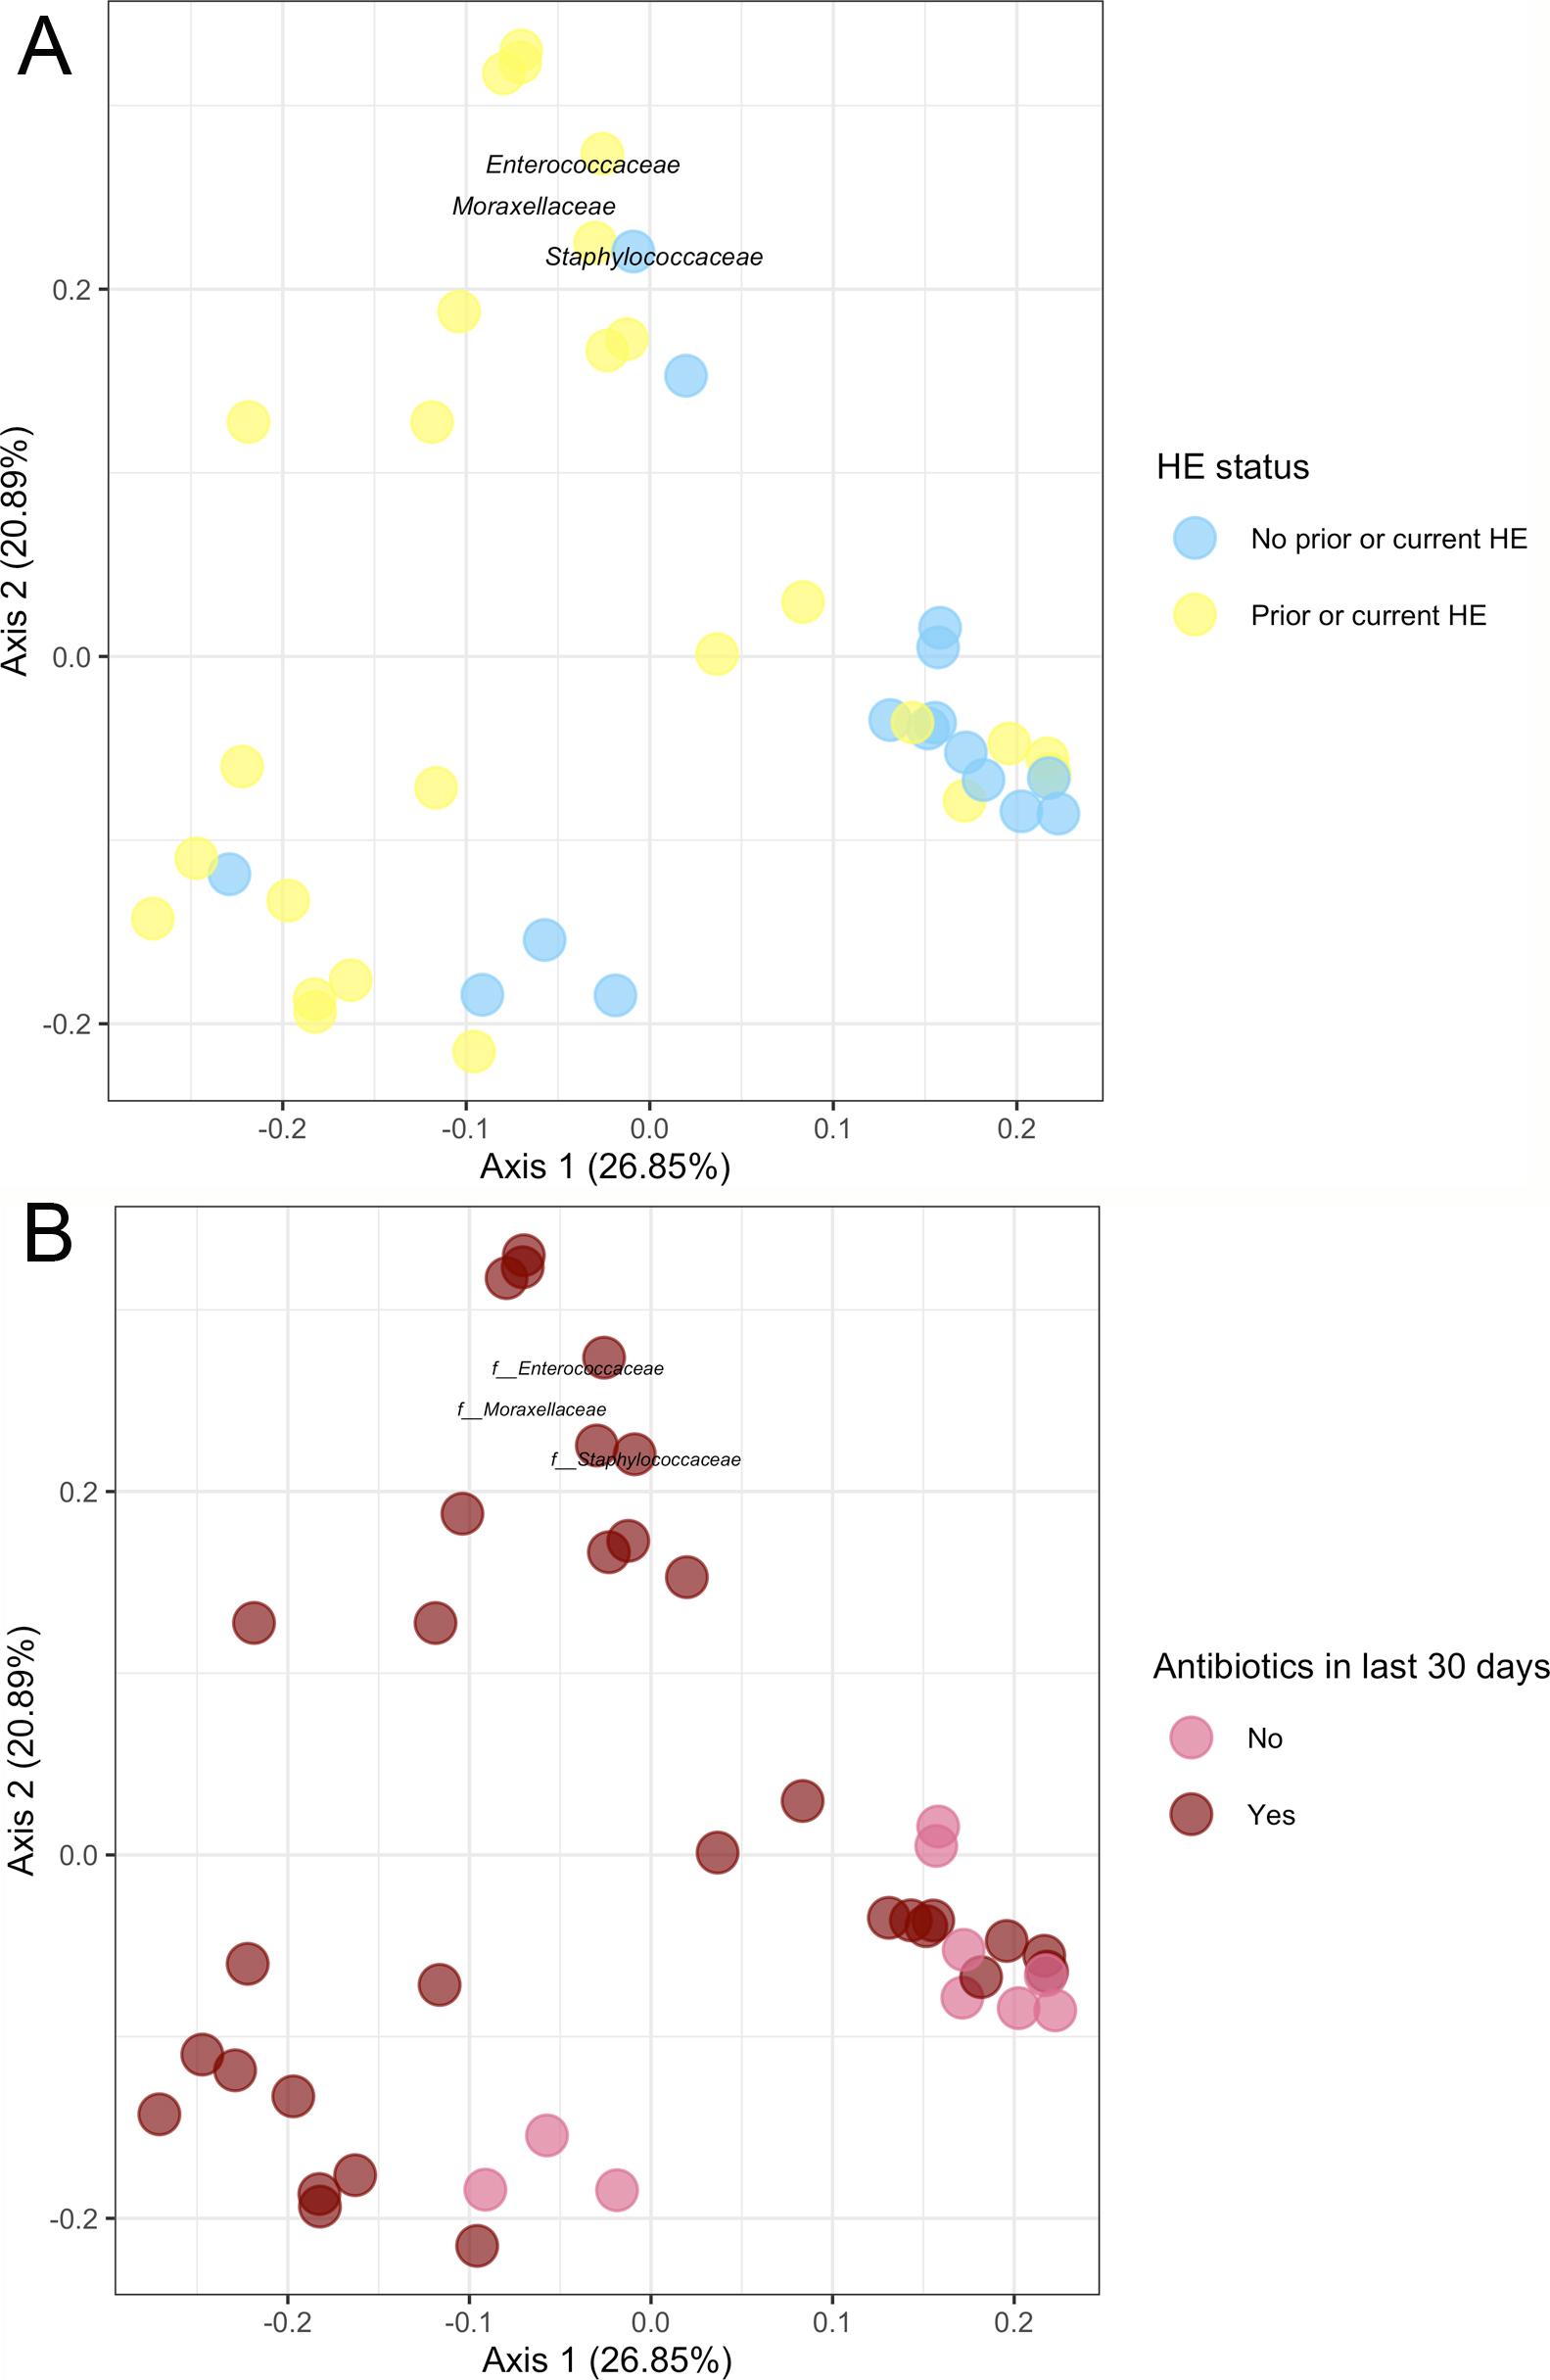
3.1Microbiome composition associated with prior or current hepatic encephalopathyPrior published literature on the microbiome signature of HE primarily reports family-level taxonomic information. In this cohort, the relative abundance of several families differed between those with and without a history of OHE (Supplementary Figs. 1 and 2). Principal coordinate analysis demonstrated differential microbial composition by history of OHE (Supplementary Fig. 3A) and by recent antibiotic use (Supplementary Fig. 3B). Four families were less abundant in those with a history of OHE in univariate analysis: Bacteroidaceae, Cellulomonadaceae, Clostridiales XIII Incertae Sedis, and Lachnospiraceae (Table 2). No bacterial family was associated with a history of OHE when controlling for both age and antibiotics in the preceding 30 days (P > 0.05).
Microbial taxa that predict prior or current overt HE.
| Controlling for Agea | Controlling for Age and Antibioticsb | Controlling for Age and Lactulose Usec | ||||
|---|---|---|---|---|---|---|
| Relative Abundance of: | Odds Ratio | P-value | Odds Ratio | P-value | Odds Ratio | P-value |
| Families | ||||||
| Bacteroidaceae | 0.59 (0.31, 0.93) | 0.05 | 0.59 (0.26, 1.01) | 0.13 | 0.72 (0.36, 1.16) | 0.26 |
| Cellulomonadaceae | 0.81 (0.66, 0.97) | 0.03 | 0.81 (0.63, 1.01) | 0.08 | 0.82 (0.64, 1.01) | 0.08 |
| Clostridiales XIII Incertae Sedis | 0.27 (0.07, 0.71) | 0.03 | 0.38 (0.08, 0.92) | 0.15 | 0.41 (0.10, 0.93) | 0.16 |
| Lachnospiraceae | 0.37 (0.16, 0.72) | 0.008 | 0.58 (0.24, 1.21) | 0.17 | 0.50 (0.21, 1.05) | 0.08 |
| Species | ||||||
| Anaeromassilibacillus species | 0.68 (0.46, 0.86) | 0.009 | 0.76 (0.52, 0.98) | 0.07 | 0.74 (0.50, 0.95) | 0.04 |
| Anaerostipes caccae | 0.69 (0.55, 0.83) | 0.0003 | 0.73 (0.57, 0.91) | 0.01 | 0.72 (0.57, 0.88) | 0.003 |
| Bacteroides eggerthii | 0.78 (0.60, 0.94) | 0.02 | 0.80 (0.60, 1.01) | 0.09 | 0.84 (0.64, 1.05) | 0.15 |
| Clostridium species | 0.76 (0.51, 0.97) | 0.07 | 0.86 (0.60, 1.10) | 0.30 | 0.83 (0.59, 1.06) | 0.19 |
| Faecalicatena contorta | 0.76 (0.58, 0.93) | 0.02 | 0.86 (0.65, 1.08) | 0.23 | 0.80 (0.61, 1.00) | 0.07 |
| Holdemania filiformis | 0.78 (0.62, 0.94) | 0.02 | 0.89 (0.69, 1.11) | 0.31 | 0.80 (0.62, 0.99) | 0.05 |
| Neglecta timonensis | 0.70 (0.53, 0.86) | 0.002 | 0.72 (0.52, 0.92) | 0.02 | 0.72 (0.53, 0.90) | 0.01 |
| Ruminococcus species | 0.66 (0.40, 0.87) | 0.02 | 0.74 (0.47, 1.00) | 0.10 | 0.74 (0.48, 0.98) | 0.07 |
Results are OR (95% CI) from multivariate-adjusted logistic regression in the cohort of 49 participants.
In this study, we investigated differences between subject HE sub-groups at species-level taxonomic resolution. The relative abundance of several species differs between those with and without a history of OHE (Figs. 1 and 2). The maximum percent variation in species abundance explained by history of OHE was 4.16%, P = 0.03. Patients with a history of OHE had lower alpha-diversity than those with no OHE history (Fig. 3A). Eight species were less abundant in those with a history of OHE in univariate analysis: Anaeromassilibacillus species, Anaerostipes caccae, Bacteroides eggerthii, Clostridium species, Faecalicatena contorta, Holdemania filiformis, Neglecta timonensis, and Ruminococcus species (Table 2). Of those eight species, two were associated with a history of OHE when controlling for age, recent antibiotic use, and recent lactulose use: Anaerostipes caccae (OR 0.76 [0.59, 0.97], P = 0.03) and Neglecta timonensis (OR 0.73 [0.52, 0.95], P = 0.04).
 and taxa (columns) are sorted based on HE status (0 = no prior HE), cause of liver disease and antibiotic usage.")


A: Patients with prior or current HE have lower alpha-diversity than those with no HE history. Higher inverse Simpson Diversity = higher alpha-diversity. B: Patients with no future HE have higher alpha-diversity than those with future HE. Higher inverse Simpson Diversity = higher alpha-diversity.
Of the 33 patients with a history of OHE at the time of fecal sampling, 12 developed recurrent OHE within 90 days, 10 did not develop future HE, and 11 died, were transplanted, or otherwise did not have at least 90 days of follow up. Patients with future OHE had lower alpha-diversity than those who did not develop OHE (Fig. 3B). There was no significant difference in species abundance between those who did and did not develop recurrent OHE within 90 days.
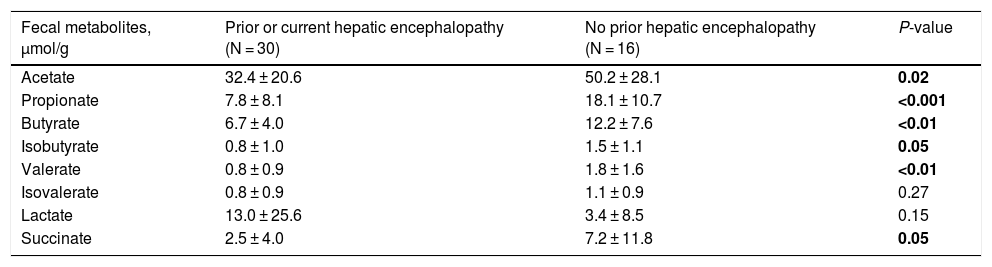
3.3Short-chain fatty acids and hepatic encephalopathyBacterial species positively associated with stool short-chain fatty acid (SCFA) content were inversely related to cirrhosis disease severity (Fig. 4). In addition, most SCFAs were present at higher concentrations in the stool of patients without a history of OHE (Table 3). When controlling for lactulose use, succinate (OR 0.89 [0.80, 0.99]), butyrate (OR 0.82 [0.70, 0.96]), and propionate levels (OR 0.92 [0.85, 0.99]) were associated with a history of OHE. When controlling for rifaximin use, no fecal SCFAs were associated with prior or current OHE.

Most fecal SCFAs were significantly higher in those with no OHE history.
| Fecal metabolites, μmol/g | Prior or current hepatic encephalopathy (N = 30) | No prior hepatic encephalopathy (N = 16) | P-value |
|---|---|---|---|
| Acetate | 32.4 ± 20.6 | 50.2 ± 28.1 | 0.02 |
| Propionate | 7.8 ± 8.1 | 18.1 ± 10.7 | <0.001 |
| Butyrate | 6.7 ± 4.0 | 12.2 ± 7.6 | <0.01 |
| Isobutyrate | 0.8 ± 1.0 | 1.5 ± 1.1 | 0.05 |
| Valerate | 0.8 ± 0.9 | 1.8 ± 1.6 | <0.01 |
| Isovalerate | 0.8 ± 0.9 | 1.1 ± 0.9 | 0.27 |
| Lactate | 13.0 ± 25.6 | 3.4 ± 8.5 | 0.15 |
| Succinate | 2.5 ± 4.0 | 7.2 ± 11.8 | 0.05 |
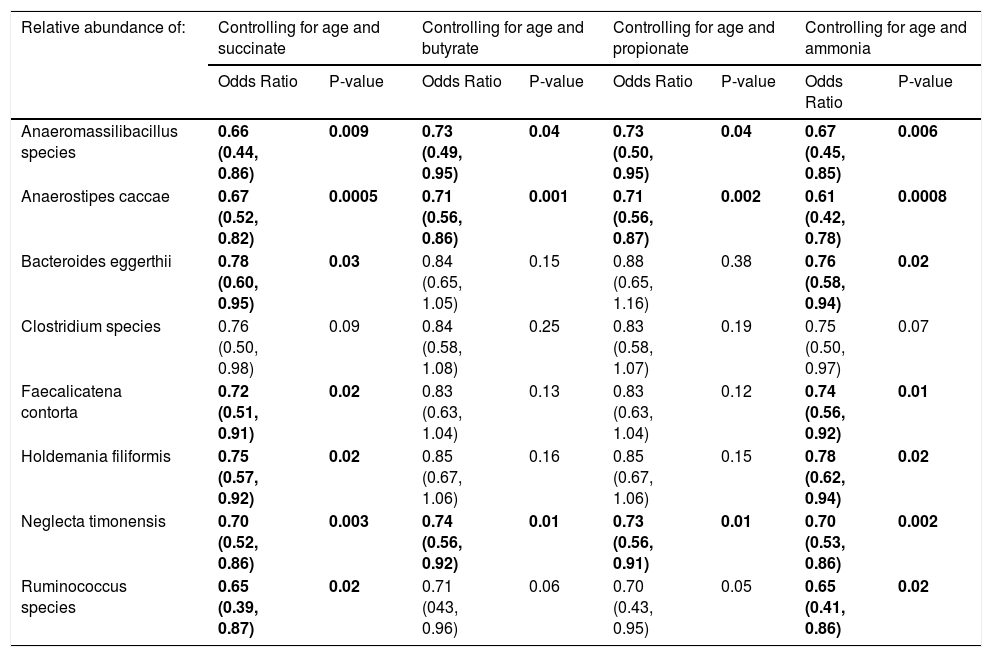
When controlling for succinate, butyrate, or propionate stool concentrations and age, most of the eight species were still associated with a history of OHE (Table 4). In multivariate regression, Anaerostipes caccae was associated with prior OHE when controlling for age, lactulose use, rifaximin use, and succinate (OR 0.73 [0.50, 0.96], P = 0.04), butyrate (OR 0.77 [0.59, 0.99], P = 0.04), or propionate (OR 0.77 [0.59, 0.97], P = 0.03). Neglecta timonensis was associated with prior OHE when controlling for age, lactulose use, rifaximin use, and propionate (OR 0.74 [0.51, 0.96], P = 0.04), but not when controlling for succinate (P = 0.06), or butyrate (P = 0.06).
Species that predict prior or current overt HE when controlling for fecal short-chain fatty acid and ammonia content.
| Relative abundance of: | Controlling for age and succinate | Controlling for age and butyrate | Controlling for age and propionate | Controlling for age and ammonia | ||||
|---|---|---|---|---|---|---|---|---|
| Odds Ratio | P-value | Odds Ratio | P-value | Odds Ratio | P-value | Odds Ratio | P-value | |
| Anaeromassilibacillus species | 0.66 (0.44, 0.86) | 0.009 | 0.73 (0.49, 0.95) | 0.04 | 0.73 (0.50, 0.95) | 0.04 | 0.67 (0.45, 0.85) | 0.006 |
| Anaerostipes caccae | 0.67 (0.52, 0.82) | 0.0005 | 0.71 (0.56, 0.86) | 0.001 | 0.71 (0.56, 0.87) | 0.002 | 0.61 (0.42, 0.78) | 0.0008 |
| Bacteroides eggerthii | 0.78 (0.60, 0.95) | 0.03 | 0.84 (0.65, 1.05) | 0.15 | 0.88 (0.65, 1.16) | 0.38 | 0.76 (0.58, 0.94) | 0.02 |
| Clostridium species | 0.76 (0.50, 0.98) | 0.09 | 0.84 (0.58, 1.08) | 0.25 | 0.83 (0.58, 1.07) | 0.19 | 0.75 (0.50, 0.97) | 0.07 |
| Faecalicatena contorta | 0.72 (0.51, 0.91) | 0.02 | 0.83 (0.63, 1.04) | 0.13 | 0.83 (0.63, 1.04) | 0.12 | 0.74 (0.56, 0.92) | 0.01 |
| Holdemania filiformis | 0.75 (0.57, 0.92) | 0.02 | 0.85 (0.67, 1.06) | 0.16 | 0.85 (0.67, 1.06) | 0.15 | 0.78 (0.62, 0.94) | 0.02 |
| Neglecta timonensis | 0.70 (0.52, 0.86) | 0.003 | 0.74 (0.56, 0.92) | 0.01 | 0.73 (0.56, 0.91) | 0.01 | 0.70 (0.53, 0.86) | 0.002 |
| Ruminococcus species | 0.65 (0.39, 0.87) | 0.02 | 0.71 (043, 0.96) | 0.06 | 0.70 (0.43, 0.95) | 0.05 | 0.65 (0.41, 0.86) | 0.02 |
Results are OR (95% CI) from multivariate-adjusted logistic regression in the cohort of 49 participants.
In the 36 patients who were not censored for death, liver transplant, or lost to follow up in 90 days, those who developed OHE within 90 days had a lower level of valerate (0.8 vs. 1.7 μmol/g, P < 0.05) in their stool. The remaining SCFAs did not differ by future OHE status.
3.4Fecal ammonia and OHEFecal ammonia concentrations were similar between those with and without a history of OHE (273 μmol/g ± 214 vs. 327 ± 234, P = 0.43). Of the patients with a history of OHE, fecal ammonia concentrations were similar between those who did and did not develop OHE within 90 days (221 μmol/g ± 117 vs. 292 ± 269, P = 0.42). Adding fecal ammonia to the multivariable regression model did not influence the ability of seven of the eight previously mentioned species to predict a history of OHE (Table 4). In multivariate regression, Anaerostipes caccae (OR 0.62 [0.38, 0.87], P = 0.02) and Neglecta timonensis (OR 0.74 [0.52, 0.96], P = 0.04) were associated with prior OHE when controlling for age, lactulose use, rifaximin use, and fecal ammonia.
4DiscussionIn this prospective study of 49 patients with cirrhosis, eight bacterial species in the fecal microbiome were linked to a history of OHE. SCFA content was associated with OHE but fecal ammonia was not. No species were identified as predictors of future OHE.
The data presented here supports prior work demonstrating that family abundance and diversity differs between patients with and without OHE. We found that four families were less abundant in those with a history of OHE: Bacteroidaceae, Cellulomonadaceae, Clostridiales XIII Incertae Sedis, and Lachnospiraceae. Lower abundance of Lachnospiraceae has been previously linked to MHE [6] and OHE [13]. More broadly, Clostridiales XIII Incertae Sedis and Lachnospiraceae are less abundant in patients with cirrhosis compared to healthy controls. In fact, Clostridiales XIII Incertae Sedis is a part of the cirrhosis dysbiosis ratio and linked to death, future organ failure, and endotoxin levels [14]. Those with acute-on-chronic liver failure have lower abundance of Bacteroidaceae and Lachnospiraceae [13]. Our study found diminished family diversity in those with past and future OHE, which is also in line with prior work [15].
Our study uniquely examined down to species level and found eight species significantly less abundant in those with a history of OHE: Anaeromassilibacillus species, Anaerostipes caccae, Bacteroides eggerthii, Clostridium species, Faecalicatena contorta, Holdemania filiformis, Neglecta timonensis, and Ruminococcus species. There is limited relevant prior knowledge of Anaeromassilibacillus species, Faecalicatena contorta, Holdemania filiformis, and Neglecta timonensis. Anaerostipes caccae is a butyrate-producing commensal which appears to be important for maintenance of gut barrier function [16,17]. Bacteroides eggerthii is known for propionate production and is depleted in primary biliary cholangitis [18]. Clostridial species have been found to be important in cirrhosis and SCFA production. Butyrate is the main product of commensals in the genus Clostridia [19], and an increase in Clostridial species with probiotics has been linked to cognitive improvement in patients with MHE [20]. Unfortunately, in this study we were unable to identify the specific Clostridial species. Similarly, Ruminococcus in the stool and saliva of patients with cirrhosis has been associated with cognition independent of clinical variables, and associated with advanced fibrosis in non-alcoholic fatty liver disease [6,21]. However, the Ruminococcus genus is quite heterogeneous, including both beneficial and deleterious bacteria, and in our study we were unable to identify the specific species that varied by OHE status. Also of importance, a species previously identified as correlated with MHE, Streptococcus salivarius, did not differ by OHE status in our study [7].
Fecal short-chain fatty acid content clearly correlated with cirrhosis disease severity. As markers of liver disease severity rose, the abundance of species positively associated with SCFA content dropped. Most SCFAs were present at significantly lower levels in patients with a history of OHE. Since SCFAs are utilized by enterocytes, making them crucial to the maintenance of gut barrier function, diminished enteral SCFA content could impair gut barrier function, increase permeability, and lead to increased portosystemic circulation of factors contributing to HE development. In support of our findings, Jin et al. recently found that patients with cirrhosis have reduced capacity to produce SCFAs, especially butyrate [22]. This abnormality was associated with severity of liver disease. We found that three SCFAs in particular were associated with OHE when controlling for lactulose use: succinate, butyrate, and propionate. However, this association disappeared when controlling for rifaximin use. Prior literature has demonstrated that rifaximin may cause a shift to a beneficial pattern of fecal metabolites, improve cognitive function, and reduce endotoxemia [23]. Our findings suggest that rifaximin use may play a role in the modulation of SCFA production and content in OHE.
The production of SCFAs may partially underlie the finding that certain species were associated with OHE. For some species, stool concentrations of succinate, butyrate, or propionate explained the relationship between species abundance and OHE. However, some species predicted OHE even when controlling for SCFA content. Of the original eight species, two were associated with a history of OHE when controlling for age, recent antibiotic use, recent lactulose use and most SCFAs: Anaerostipes caccae and Neglecta timonensis. Anaerostipes caccae is a butyrate-producing commensal, but fecal butyrate content alone did not explain its ability to predict OHE. Little is known about Neglecta timonensis but given our findings here these two species may represent potential targets for future research and intervention.
Fecal ammonia did not appear to have an important influence in this study, despite the historical importance of ammonia in hepatic encephalopathy pathogenesis. Fecal ammonia concentrations did not vary by history of OHE or by development of future OHE. Adding fecal ammonia to a multivariable regression model did not influence the ability of seven of the eight previously mentioned species to predict a history of OHE. These findings are notable in light of work done in a murine model of hepatic injury, which demonstrated that depleting the intestinal microbiome of bacteria that produce ammonia also improved neurological function and mortality [24]. Our work here supports a more important role of enteral SCFA than ammonia content.
Of great importance, our study did not identify specific species with the ability to predict future OHE. There was no significant difference in species abundance between those who did and did not develop recurrent OHE within 90 days, though there was significantly less valerate (a SCFA) in the stool of those who develop OHE. Limited prior work has suggested that certain genera in the fecal microbiome of an overtly encephalopathic patient predicts future OHE and even mortality [15]. In one study, seven patients who underwent fecal microbiome testing before and after a first OHE episode found that intestinal dysbiosis progressed, though again no specific predictive species were identified in this work [14]. It remains possible that with larger and more controlled studies, predictive species will be identified. It is notable that while no species predicted future OHE, a SCFA – valerate – was significantly lower in those with future OHE.
Our study must be interpreted in the context of study design. The patients in our study were on the advanced end of the liver disease severity spectrum. The average MELD-Na was 20 and the majority of stool collections occurred in acutely hospitalized patients. Most patients experienced prior or current OHE, further evidence of disease severity. It is known that the fecal microbiome of cirrhosis correlates with disease severity, so these results must be viewed in that light [25]. Furthermore, alcohol abuse contributed to liver disease in at least 50% of patients in this cohort, and alcohol has known impact on the intestinal microbiome. No formal psychometric testing was performed in this study, meaning that the categorization of MHE was not made. Finally, in order to maximize external validity, several patients without OHE but on lactulose were included in the cohort, in many cases reportedly to treat constipation.
In conclusion, our study found eight species of interest in association with OHE. Bacteria associated with SCFA production were less abundant in those with more advanced liver disease, and SCFA content was lower in the stool of those with OHE. Many of the species linked to OHE also have an association with SCFA production, which may help explain some part of the pathogenesis. Further work is needed to detail this relationship, particularly with genomic and transcriptomic characterization of the microbiome to potentially develop interventions that modify the microbiome or SCFA content in an effort to treat HE.
Statement of financial supportKaleido Biosciences Inc provided funding for personnel and materials used in data collection, as well as all sample analysis.
Conflict of interestDr. Bloom receives funding from the AASLD Advanced Transplant Hepatology Award and ACG Junior Faculty Award and has consulted for Synlogic Inc. Kelsey J. Miller is an employee of Kaleido Biosciences Inc. Dr. Chung is supported by the Massachusetts General Hospital (MGH) Research Scholars Program and has received research funding to the institution from Synlogic. No other author has relevant conflicts of interest.
Visualization and statistics on taxonomic abundance data were performed by the Harvard T.H. Chan School of Public Health Microbiome Analysis Core. John Donlan performed sample and clinical data collection.
The following are Supplementary data to this article:


