


Nonalcoholic fatty liver disease (NAFLD) can be considered one of the most common causes of liver disease in our days and is regarded as one of the newest vascular risk factors for cerebrovascular and other neurological diseases.
Materials and methodsWe studied a group of neurological outpatients, divided into two homogenous groups based on the presence or absence of NAFLD.
Results and conclusionsWe testified an independent relationship between NAFLD and common vascular risk factors (age, sex, educational level, BMI, cholesterol and lipid assessment, Hb1ac). At the same time, we ascertained an independent relationship between NAFLD and more recently recognized vascular risk factors, such as lack of folate, vitamin B12 and vitamin D-OH25, and increased levels of homocysteine. Finally, we have documented that NAFLD showed worse executive and frontal functions, and behavioral changes, such as depressive mood and anxiety, and apathy.
Non-alcoholic fatty liver disease (NAFLD) was defined as “mild, moderate or severe steatosis as determined by ultrasound, in the absence of elevated alcohol consumption” (generally estimated as more than 20g/day for women and more than 30g/day for men), and in the absence of a positive test for viral hepatitis B or C [1,2]. NAFLD is considered one of the most common causes of chronic liver disease [3–5]. It has been reported that it is gradually becoming one of the most prevalent liver diseases, identified on imaging in 20–33% of adults [1,6,7].
NAFLD has been recently associated with cardiovascular disease and is linked with vascular risk factors, such as obesity, hypertension, type 2 diabetes, dyslipidemia [8–10]. Some studies [4,11] also proposed that NAFLD could be considered an independent vascular risk factor. Won Seo et al. [3] hypothesized for the first time that NAFLD could be independently associated with cognitive impairment.
Our study was aimed to find a possible independent relationship with more recently recognized vascular risk factors, such as lack of folate, vitamin B12 and vitamin D-OH25, and increased levels of homocysteine [12–16]. Moreover, we want to determine a possible independent relationship with cognitive and behavioral changes, such as frontal executive functions and divided attention, depression, anxiety, and apathy, not, to the best of our knowledge, together previously studied.
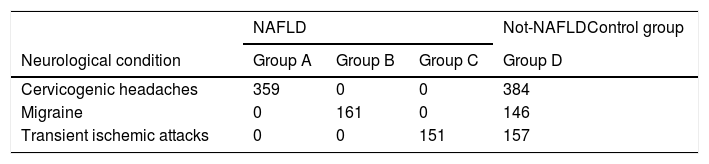
1.1Subjects characteristicsThe study included 1358, consecutive cases of adult patients referred to the Neurological Unit of the University of Trieste, from June 1st, 2008 to June 1st, 2016. Their referral to Neurological Unit was determined by different diagnosis: 743 suffering from cervicogenic headaches, 307 suffering from a migraine, and 308 due to a single transient ischemic attack. Study subjects underwent a standardized baseline assessment, that included: a detailed history; a physical examination; laboratory tests; neuropsychological evaluations; an abdominal echography; a carotid Doppler ultrasonography. The physical examination included cardiac and blood pressure evaluation, peripheral pulses, retinal vessel exploration, electrocardiographic evaluation. All the patients were evaluated with a complete neurological examination and completed the test with a series of neuropsychological examination.
All the recruited participants underwent a gallbladder and liver examination by ultrasound with a TOSHIBA SSA-907 machine with a 3.75 and 5.0MHz transducer data concerning the presence of kidney to liver contrast, echogenic walls within the intrahepatic vessels and deep beam attenuation, associated with the brightness of the liver parenchyma and gallbladder walls was obtained. We applied a standardized algorithm, to define the extension of the steatosis as a 4 level classification (1: none; 2: mild; 3: moderate; 4: severe steatosis). Patients were divided into two groups according to the presence or absence of NAFLD. 671 patients were affected by NAFLD: among them, 359 suffered from cervicogenic headaches (Group A), 161 suffering from a migraine (Group B), and 151 due to a single transient ischemic attack (Group C). Among the 687 patients without NAFLD (Group D) 384 suffered from a cervicogenic headache, 146 from a migraine and 157 had a single transient ischemic attack. Group D was considered the control population.
Standard questionnaires were conducted with all participants and included alcohol consumption, smoking, drug use, and physical activity.
The present study was conducted following the Declaration of Helsinki, and under the Ethics Guidelines (Point 4 of the CEUR Declaration) of the Committee of the University – Hospital of Trieste, and written informed consent was obtained from all the participants.
2MethodsDiabetes mellitus was defined as venous plasma glucose concentrations of >120mg/dl after an overnight fast. Glycated hemoglobin (Hb1Ac) results have been aligned to the assay applied by the Diabetes Control and Complication Trial (DCCT), expressed as a percentage; non-diabetic normal range has been considered a level 4–5.6%; 5.5–6.5% indicates a high risk of developing diabetes; a value superior to 6.6% indicates diabetes [17,18]. Clinical measurement included: total serum cholesterol, triglycerides, and high-density lipoprotein (HDL), low-density lipoprotein (LDL) was calculated by Friedwald's formula [19]. Serum level of folate, vitamin B12 and homocysteine were also tested, as specific measures of vascular risk factors. Liver enzymes, alanine aminotransferase (ALT) and aspartate aminotransferase (AST), as well as a second generation enzyme Immuno-assay (Abbott Laboratories, Chicago, IL) was employed to detect the presence of hepatitis C antibodies, while a solid phase competitive immunoassay (Abbott Laboratories) was used to detect antibodies to the hepatitis B core antigen. Serum levels of 25 (OH)D vitamin were measured using enzyme immune-assay kits (DIA Source ImmunoAssay, SA Belgium) and the classification of vitamin D following the National Osteoporosis Society [20].
Standard questionnaires were conducted with all participants and included alcohol consumption (AUDIT), smoking, drug use, and physical activity.
We obtained the average daily estimate for alcohol consumption as an amount less than 20g/day for women and less than 30g/day for men [21–23].
The body mass index (BMI) was calculated. Vascular impairment, tumor, or CNS primary inflammatory or degenerative disease were excluded by a head CT/MRI scan.
An Ultrasonography Carotid examination has been done to all the patients.
All the patients underwent a simple sequence of neuropsychological tests:
- 1.
Frontal Assessment Battery (FAB; score: 0–18; 18=normal) [24,25].
- 2.
Beck's Depression Inventory (version for Italian population) (score: 0–39; total score 10–19 indicated mild depression; total score 20–29 indicated moderate depression; >30 indicated severe depression) [26,27].
- 3.
Hamilton Anxiety Rating Scale (HAM-A) (score: 0–56; a total score comprised 0–17, estimated mild anxiety; 18–24: mild to moderate anxiety; 25–30: severe anxiety) [28].
- 4.
Apathy Evaluation Score (AES-C) (clinical examination; score: 18–72; higher scores reflect more apathy) [29].
- 5.
Stroop Test (reading, color naming, and interference mistakes) [30,31].
Statistical analysis was performed with SPSS statistics 17.0 (SPSS version 17.0). The difference in baseline characteristics between the NAFLD and no NAFLD patients was assessed by ANOVA test, for categorical variables; in case the ANOVA results were found significant, the multiple comparison analysis was also done by the Tukey Test, to examine those groups, which were significantly different from each other. The multinomial logistic regression method was applied to analyze the relationship between disease status (NAFLD and control) considering them as the dependent variable (non-metric), and age (metric), sex (non-metric), Labs values (all metrics) as independent variables.
To evaluate the relationship between NAFLD and cognitive and behavioral results, we performed a multivariate linear regression analysis.
In model 1, we adjusted for sex, age, race, and educational levels; in model 2 we further adjusted for vitamin D-OH25, folate, vitamin B12, and homocysteine levels.
3ResultsWe recruited 1358 consecutive patients. 671 patients were affected by NAFLD. 687 did not suffer from NAFLD (Group D) and were considered as healthy controls.
Among the 671 NAFLD patients enrolled, five patients abandoned the study, 13 were excluded for lack of compliance, 653 patients completed the study. Group A included 341 patients; Group B enrolled 155 patients, and Group C comprised 151 patients, for a total of 647 patients.
In Group D, composed initially by 687 healthy controls, 12 patients abandoned the study and 22 were excluded for the lack of compliance. Therefore, Group D finally comprised of 653 patients.
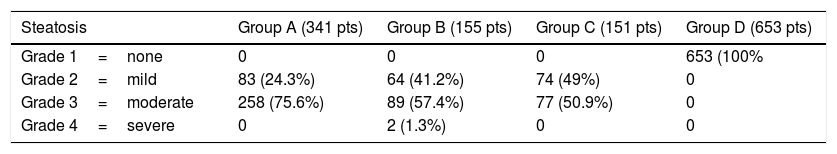
By definition, NAFLD did not have HBV or HCV virus Antibodies; In group A (341 patients), 83 (24.3%) showed grade 2 steatosis and 258 (75.6%) grade 3 steatosis. In Group B (155 patients), 64 patients (41.2%) showed grade 2 steatosis, 89 (57.4%) grade 3 of steatosis, and 2 (1.3%) patients grade 4 of steatosis. In Group C (151 patients), 74 patients (49%) showed grade 2 steatosis and 77 patients (50.9%) grade 3 steatosis. The two patients with grade 4 of steatosis have been further studied and were defined as nonalcoholic steatohepatitis (NASH): they represent 0.3% of the NAFLD patients.
Nobody in the control group showed steatosis (Table 1).
Steatosis as defined by Third National Health and Nutrition Exa. Survey, 2010 (number of patients and %).
| Steatosis | Group A (341 pts) | Group B (155 pts) | Group C (151 pts) | Group D (653 pts) |
|---|---|---|---|---|
| Grade 1=none | 0 | 0 | 0 | 653 (100% |
| Grade 2=mild | 83 (24.3%) | 64 (41.2%) | 74 (49%) | 0 |
| Grade 3=moderate | 258 (75.6%) | 89 (57.4%) | 77 (50.9%) | 0 |
| Grade 4=severe | 0 | 2 (1.3%) | 0 | 0 |
AUDIT (WHO) measures indicated an average score of 6.4 (SD=2.1) in 568 NAFLD patients and 7.8 (SD=1.3) in 79 NAFLD patients. Group D AUDIT score was of 6.6 (SD=2.5) in 579 patients and 7.2 (SD=3.1) in 74 patients.
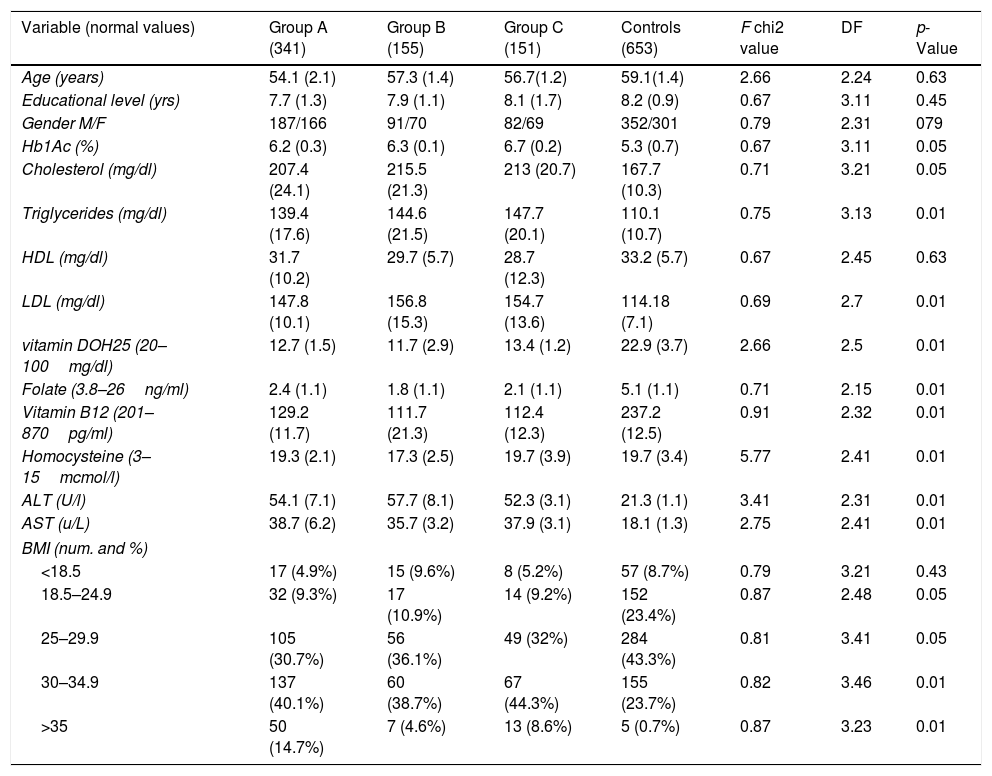
The demographic values, i.e., age, gender, and educational levels were not significantly associated with NAFLD. One-way analysis of variance (ANOVA) method was applied to explore the statistically significant difference among mean value in three groups of NAFLD and control (Table 2). The neurological pathologies did not differ in the groups (Table 3). Group A, with chronic headaches; Group B, with sleep disorders and Group C with a precedent transient ischemic attack (TIA) have been studied and compared for neuropsychological results. All the three groups of NAFLD showed a significant increase of glycated hemoglobin (p<0.05), of total cholesterol (p<0.05), triglycerides (p<0.01), and of LDL (p<0.01) than controls. They showed a decreased level of vitamin D-OH25 (p<0.01), folate (p<0.01), vitamin B12 (p<0.01), elevated levels of homocysteine (p<0.01), and higher levels of AST and ALT (p<0.01), than controls.
Comparison of mean values of various biochemical parameters in the three groups and controls (Means and SD).
| Variable (normal values) | Group A (341) | Group B (155) | Group C (151) | Controls (653) | F chi2 value | DF | p-Value |
|---|---|---|---|---|---|---|---|
| Age (years) | 54.1 (2.1) | 57.3 (1.4) | 56.7(1.2) | 59.1(1.4) | 2.66 | 2.24 | 0.63 |
| Educational level (yrs) | 7.7 (1.3) | 7.9 (1.1) | 8.1 (1.7) | 8.2 (0.9) | 0.67 | 3.11 | 0.45 |
| Gender M/F | 187/166 | 91/70 | 82/69 | 352/301 | 0.79 | 2.31 | 079 |
| Hb1Ac (%) | 6.2 (0.3) | 6.3 (0.1) | 6.7 (0.2) | 5.3 (0.7) | 0.67 | 3.11 | 0.05 |
| Cholesterol (mg/dl) | 207.4 (24.1) | 215.5 (21.3) | 213 (20.7) | 167.7 (10.3) | 0.71 | 3.21 | 0.05 |
| Triglycerides (mg/dl) | 139.4 (17.6) | 144.6 (21.5) | 147.7 (20.1) | 110.1 (10.7) | 0.75 | 3.13 | 0.01 |
| HDL (mg/dl) | 31.7 (10.2) | 29.7 (5.7) | 28.7 (12.3) | 33.2 (5.7) | 0.67 | 2.45 | 0.63 |
| LDL (mg/dl) | 147.8 (10.1) | 156.8 (15.3) | 154.7 (13.6) | 114.18 (7.1) | 0.69 | 2.7 | 0.01 |
| vitamin DOH25 (20–100mg/dl) | 12.7 (1.5) | 11.7 (2.9) | 13.4 (1.2) | 22.9 (3.7) | 2.66 | 2.5 | 0.01 |
| Folate (3.8–26ng/ml) | 2.4 (1.1) | 1.8 (1.1) | 2.1 (1.1) | 5.1 (1.1) | 0.71 | 2.15 | 0.01 |
| Vitamin B12 (201–870pg/ml) | 129.2 (11.7) | 111.7 (21.3) | 112.4 (12.3) | 237.2 (12.5) | 0.91 | 2.32 | 0.01 |
| Homocysteine (3–15mcmol/l) | 19.3 (2.1) | 17.3 (2.5) | 19.7 (3.9) | 19.7 (3.4) | 5.77 | 2.41 | 0.01 |
| ALT (U/l) | 54.1 (7.1) | 57.7 (8.1) | 52.3 (3.1) | 21.3 (1.1) | 3.41 | 2.31 | 0.01 |
| AST (u/L) | 38.7 (6.2) | 35.7 (3.2) | 37.9 (3.1) | 18.1 (1.3) | 2.75 | 2.41 | 0.01 |
| BMI (num. and %) | |||||||
| <18.5 | 17 (4.9%) | 15 (9.6%) | 8 (5.2%) | 57 (8.7%) | 0.79 | 3.21 | 0.43 |
| 18.5–24.9 | 32 (9.3%) | 17 (10.9%) | 14 (9.2%) | 152 (23.4%) | 0.87 | 2.48 | 0.05 |
| 25–29.9 | 105 (30.7%) | 56 (36.1%) | 49 (32%) | 284 (43.3%) | 0.81 | 3.41 | 0.05 |
| 30–34.9 | 137 (40.1%) | 60 (38.7%) | 67 (44.3%) | 155 (23.7%) | 0.82 | 3.46 | 0.01 |
| >35 | 50 (14.7%) | 7 (4.6%) | 13 (8.6%) | 5 (0.7%) | 0.87 | 3.23 | 0.01 |
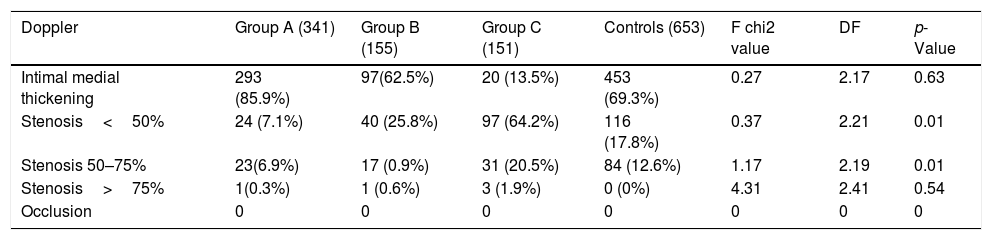
As expected, there is a higher percentage of increased BMI (30–35 or more) in NAFLD (p<0.01) than controls. Moreover, there is a higher percentage of not-hemodynamic stenosis (50–75%) in NAFLD (Table 4).
Doppler results.
| Doppler | Group A (341) | Group B (155) | Group C (151) | Controls (653) | F chi2 value | DF | p-Value |
|---|---|---|---|---|---|---|---|
| Intimal medial thickening | 293 (85.9%) | 97(62.5%) | 20 (13.5%) | 453 (69.3%) | 0.27 | 2.17 | 0.63 |
| Stenosis<50% | 24 (7.1%) | 40 (25.8%) | 97 (64.2%) | 116 (17.8%) | 0.37 | 2.21 | 0.01 |
| Stenosis 50–75% | 23(6.9%) | 17 (0.9%) | 31 (20.5%) | 84 (12.6%) | 1.17 | 2.19 | 0.01 |
| Stenosis>75% | 1(0.3%) | 1 (0.6%) | 3 (1.9%) | 0 (0%) | 4.31 | 2.41 | 0.54 |
| Occlusion | 0 | 0 | 0 | 0 | 0 | 0 | 0 |
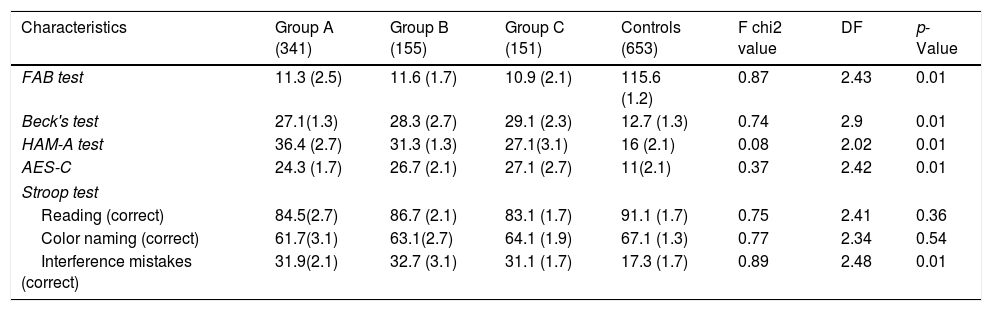
Patients of the three groups did worse in the FAB test than controls (p<0.05) showing more severe executive alterations. They showed higher levels of depressive mood (according to Beck's test) (p<0.01) than controls. At the same time, they showed greater anxiety, according to HAM-A (p<0.01) when compared to controls and higher levels of apathy (AES-C) (p<0.01) (Table 5). Moreover, they made higher quantities of interference mistakes in STROOP test than controls (p<0.01).
Comparison of mean values of neuropsychological tests in the three groups and controls (Means and SD).
| Characteristics | Group A (341) | Group B (155) | Group C (151) | Controls (653) | F chi2 value | DF | p-Value |
|---|---|---|---|---|---|---|---|
| FAB test | 11.3 (2.5) | 11.6 (1.7) | 10.9 (2.1) | 115.6 (1.2) | 0.87 | 2.43 | 0.01 |
| Beck's test | 27.1(1.3) | 28.3 (2.7) | 29.1 (2.3) | 12.7 (1.3) | 0.74 | 2.9 | 0.01 |
| HAM-A test | 36.4 (2.7) | 31.3 (1.3) | 27.1(3.1) | 16 (2.1) | 0.08 | 2.02 | 0.01 |
| AES-C | 24.3 (1.7) | 26.7 (2.1) | 27.1 (2.7) | 11(2.1) | 0.37 | 2.42 | 0.01 |
| Stroop test | |||||||
| Reading (correct) | 84.5(2.7) | 86.7 (2.1) | 83.1 (1.7) | 91.1 (1.7) | 0.75 | 2.41 | 0.36 |
| Color naming (correct) | 61.7(3.1) | 63.1(2.7) | 64.1 (1.9) | 67.1 (1.3) | 0.77 | 2.34 | 0.54 |
| Interference mistakes (correct) | 31.9(2.1) | 32.7 (3.1) | 31.1 (1.7) | 17.3 (1.7) | 0.89 | 2.48 | 0.01 |
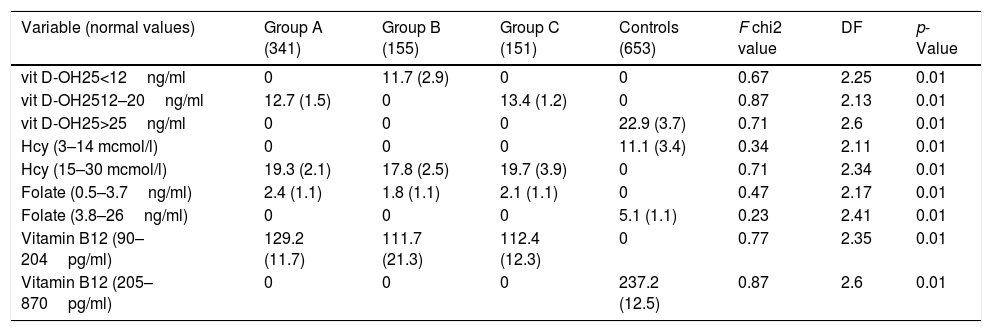
We have considered four biochemical variables (low folate, vitamin B12, low vitamin D-OH25, and high homocysteine) and found them significantly different in the three Groups (Table 6). In NAFLD groups, the mean level of vitamin D-OH was lower than controls (p<0.01) (Table 6), and as seen in Table 3, Group A population was entirely in an insufficiency condition, whereas Group B in a deficiency status (NOS Criteria [20]).
Comparison of mean values of specific biochemical (divided by different levels) and neuropsychological parameters in the three groups and controls (Means and SD).
| Variable (normal values) | Group A (341) | Group B (155) | Group C (151) | Controls (653) | F chi2 value | DF | p-Value |
|---|---|---|---|---|---|---|---|
| vit D-OH25<12ng/ml | 0 | 11.7 (2.9) | 0 | 0 | 0.67 | 2.25 | 0.01 |
| vit D-OH2512–20ng/ml | 12.7 (1.5) | 0 | 13.4 (1.2) | 0 | 0.87 | 2.13 | 0.01 |
| vit D-OH25>25ng/ml | 0 | 0 | 0 | 22.9 (3.7) | 0.71 | 2.6 | 0.01 |
| Hcy (3–14 mcmol/l) | 0 | 0 | 0 | 11.1 (3.4) | 0.34 | 2.11 | 0.01 |
| Hcy (15–30 mcmol/l) | 19.3 (2.1) | 17.8 (2.5) | 19.7 (3.9) | 0 | 0.71 | 2.34 | 0.01 |
| Folate (0.5–3.7ng/ml) | 2.4 (1.1) | 1.8 (1.1) | 2.1 (1.1) | 0 | 0.47 | 2.17 | 0.01 |
| Folate (3.8–26ng/ml) | 0 | 0 | 0 | 5.1 (1.1) | 0.23 | 2.41 | 0.01 |
| Vitamin B12 (90–204pg/ml) | 129.2 (11.7) | 111.7 (21.3) | 112.4 (12.3) | 0 | 0.77 | 2.35 | 0.01 |
| Vitamin B12 (205–870pg/ml) | 0 | 0 | 0 | 237.2 (12.5) | 0.87 | 2.6 | 0.01 |
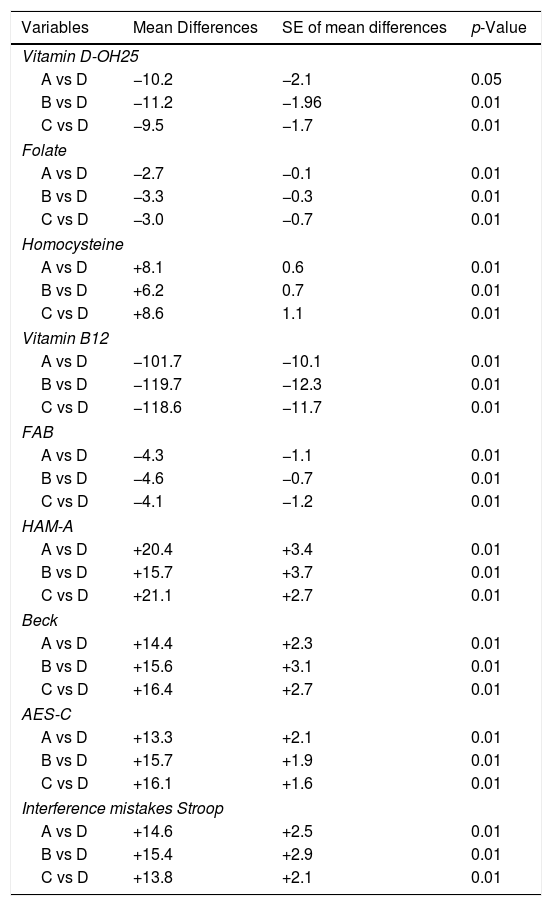
In NAFLD populations, mean Hcy levels were higher than in controls (p<0.01) (Table 6), as well as folate and vitamin B12 levels, were significantly lower than controls (p<0.01) (Table 6). The Multiple-comparison Tukey Test confirmed these results (Table 7).
Multiple comparison analysis (Tukey test) of various biochemical and neuropsychological parameters in the four groups.
| Variables | Mean Differences | SE of mean differences | p-Value |
|---|---|---|---|
| Vitamin D-OH25 | |||
| A vs D | −10.2 | −2.1 | 0.05 |
| B vs D | −11.2 | −1.96 | 0.01 |
| C vs D | −9.5 | −1.7 | 0.01 |
| Folate | |||
| A vs D | −2.7 | −0.1 | 0.01 |
| B vs D | −3.3 | −0.3 | 0.01 |
| C vs D | −3.0 | −0.7 | 0.01 |
| Homocysteine | |||
| A vs D | +8.1 | 0.6 | 0.01 |
| B vs D | +6.2 | 0.7 | 0.01 |
| C vs D | +8.6 | 1.1 | 0.01 |
| Vitamin B12 | |||
| A vs D | −101.7 | −10.1 | 0.01 |
| B vs D | −119.7 | −12.3 | 0.01 |
| C vs D | −118.6 | −11.7 | 0.01 |
| FAB | |||
| A vs D | −4.3 | −1.1 | 0.01 |
| B vs D | −4.6 | −0.7 | 0.01 |
| C vs D | −4.1 | −1.2 | 0.01 |
| HAM-A | |||
| A vs D | +20.4 | +3.4 | 0.01 |
| B vs D | +15.7 | +3.7 | 0.01 |
| C vs D | +21.1 | +2.7 | 0.01 |
| Beck | |||
| A vs D | +14.4 | +2.3 | 0.01 |
| B vs D | +15.6 | +3.1 | 0.01 |
| C vs D | +16.4 | +2.7 | 0.01 |
| AES-C | |||
| A vs D | +13.3 | +2.1 | 0.01 |
| B vs D | +15.7 | +1.9 | 0.01 |
| C vs D | +16.1 | +1.6 | 0.01 |
| Interference mistakes Stroop | |||
| A vs D | +14.6 | +2.5 | 0.01 |
| B vs D | +15.4 | +2.9 | 0.01 |
| C vs D | +13.8 | +2.1 | 0.01 |
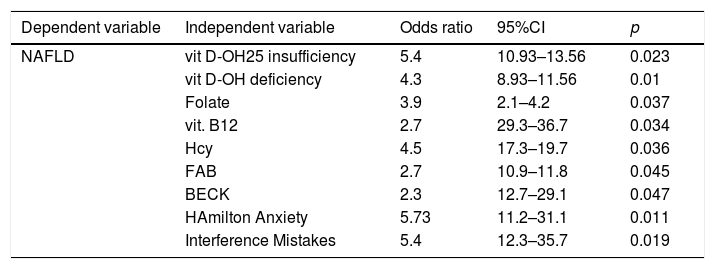
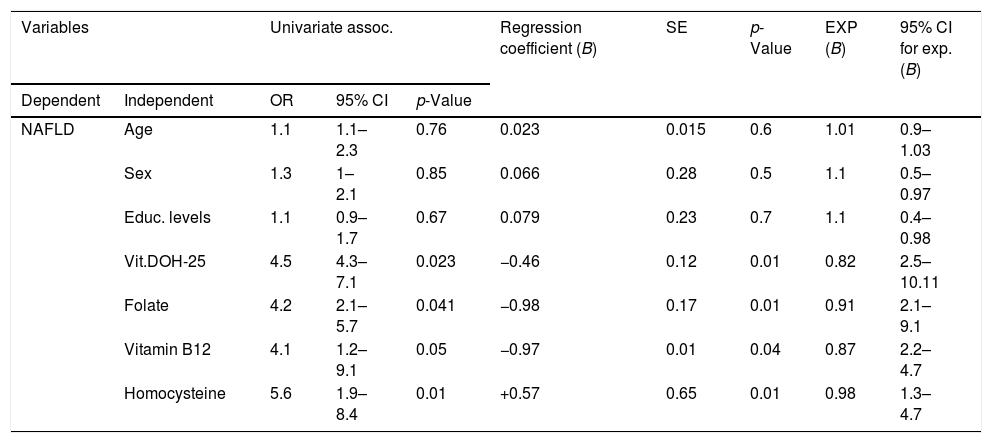
As demonstrated by the Univariate Regression Analysis, as shown in Table 8, crude odds ratios are significant for the association between NAFLD and vitamin insufficiency and deficiency, folate and vitamin B12 deficiency and high level of homocysteine. At the same time, there is a positive association between NAFLD and low performances in FAB and Interference Part of Stroop test, higher levels of Beck Hamilton and AES-C test.
Univariate regression analysis.
| Dependent variable | Independent variable | Odds ratio | 95%CI | p |
|---|---|---|---|---|
| NAFLD | vit D-OH25 insufficiency | 5.4 | 10.93–13.56 | 0.023 |
| vit D-OH deficiency | 4.3 | 8.93–11.56 | 0.01 | |
| Folate | 3.9 | 2.1–4.2 | 0.037 | |
| vit. B12 | 2.7 | 29.3–36.7 | 0.034 | |
| Hcy | 4.5 | 17.3–19.7 | 0.036 | |
| FAB | 2.7 | 10.9–11.8 | 0.045 | |
| BECK | 2.3 | 12.7–29.1 | 0.047 | |
| HAmilton Anxiety | 5.73 | 11.2–31.1 | 0.011 | |
| Interference Mistakes | 5.4 | 12.3–35.7 | 0.019 |
The presence of a relationship between them was checked based on the statistical significance of the final model chi-square, and the existence of a relationship was established. All the independent variables, excepted age, sex, and educational level, had significant contributions toward NAFLD groups (Table 9).
Summary of multinomial logistic regression analysis.
| Variables | Univariate assoc. | Regression coefficient (B) | SE | p-Value | EXP (B) | 95% CI for exp. (B) | |||
|---|---|---|---|---|---|---|---|---|---|
| Dependent | Independent | OR | 95% CI | p-Value | |||||
| NAFLD | Age | 1.1 | 1.1–2.3 | 0.76 | 0.023 | 0.015 | 0.6 | 1.01 | 0.9–1.03 |
| Sex | 1.3 | 1–2.1 | 0.85 | 0.066 | 0.28 | 0.5 | 1.1 | 0.5–0.97 | |
| Educ. levels | 1.1 | 0.9–1.7 | 0.67 | 0.079 | 0.23 | 0.7 | 1.1 | 0.4–0.98 | |
| Vit.DOH-25 | 4.5 | 4.3–7.1 | 0.023 | −0.46 | 0.12 | 0.01 | 0.82 | 2.5–10.11 | |
| Folate | 4.2 | 2.1–5.7 | 0.041 | −0.98 | 0.17 | 0.01 | 0.91 | 2.1–9.1 | |
| Vitamin B12 | 4.1 | 1.2–9.1 | 0.05 | −0.97 | 0.01 | 0.04 | 0.87 | 2.2–4.7 | |
| Homocysteine | 5.6 | 1.9–8.4 | 0.01 | +0.57 | 0.65 | 0.01 | 0.98 | 1.3–4.7 | |
The regression coefficient (B) for the vitamin D-OH25 was −0.46 for NAFLD; it indicates that the increase of vitamin D-OH25 decreased the likelihood of NAFLD, with an exponential B value 0.82, which implies that for an increase of vitamin D levels, the odds of having NAFLD decreased by 18%. The regression coefficient (B) for the folate was −0.98 for NAFLD; it indicates that the increase of vitamin D-OH25 decreased the likelihood of NAFLD, with an exponential B value 0.82, which implies that for an increase of folate levels, the odds of having NAFLD decreased by 9%. The regression coefficient (B) for the vitamin B12 was −0.87 for NAFLD; it indicates that the increase of vitamin D-OH25 decreased the likelihood of NAFLD, with an exponential B value 0.85, which implies that for an increase of vitamin B12 levels, the odds of having NAFLD decreased by 7%. The regression coefficient (B) for the homocysteine was +0.57 for NAFLD; it indicates that the decrease of homocysteine decreased the likelihood of NAFLD, with an exponential B value 0.98, which implies that for a decrease of homocysteine levels, the odds of having NAFLD decreased by 15%.
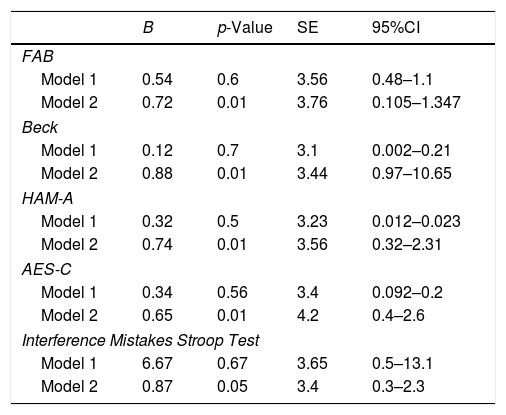
In order to evaluate the relationship between NAFLD and cognitive and behavioral impairment, we performed a multivariate linear regression analysis: in model 1, we adjusted for sex, age, educational level and in model 2 we further adjusted for vitamin D-OH25, folate, vitamin B12, and homocysteine (Table 10).
Association between NAFLD and neuropsychological variables with a multivariate linear regression analysis.
| B | p-Value | SE | 95%CI | |
|---|---|---|---|---|
| FAB | ||||
| Model 1 | 0.54 | 0.6 | 3.56 | 0.48–1.1 |
| Model 2 | 0.72 | 0.01 | 3.76 | 0.105–1.347 |
| Beck | ||||
| Model 1 | 0.12 | 0.7 | 3.1 | 0.002–0.21 |
| Model 2 | 0.88 | 0.01 | 3.44 | 0.97–10.65 |
| HAM-A | ||||
| Model 1 | 0.32 | 0.5 | 3.23 | 0.012–0.023 |
| Model 2 | 0.74 | 0.01 | 3.56 | 0.32–2.31 |
| AES-C | ||||
| Model 1 | 0.34 | 0.56 | 3.4 | 0.092–0.2 |
| Model 2 | 0.65 | 0.01 | 4.2 | 0.4–2.6 |
| Interference Mistakes Stroop Test | ||||
| Model 1 | 6.67 | 0.67 | 3.65 | 0.5–13.1 |
| Model 2 | 0.87 | 0.05 | 3.4 | 0.3–2.3 |
Model 1 adjusted for age (continuous), sex (m/f), educational levels (years school). Model 2 adjusted for vitamin D-OH25, folate, vitamin B12 and homocysteine.
FAB, Beck, HAM-A, AES-C and Interference Mistakes number failed to have a lower score concerning age, sex, and educational levels (see all the model 1 regression in Table 9). On the other hand, compared to controls, NAFLD patients had lower performances on FAB, higher scores in Beck, HAM-A, and AES-C and higher Interference Number of mistakes in Stroop test after controlling for vitamin D-OH25, folate, vitamin B12 and homocysteine (respectively: FAB: B=0.72, 95% CI: 0.105–1.347, p<0.01; Beck: B=0.88, 95% CI: 0.97–10.65, p<0.01; HAM-A: B=0.74, 95% CI: 0.32–2.31, p<0.01; AES-C: B=0.65, 95% CI: 0.4–2.6, p<0.01; Interference Mistakes Stroop Test: B=0.87, 95% CI: 0.3–2.3, p<0.05).
The classification accuracy rate of the logistic model was 56.7%, which was higher than the proportional by chance accuracy; the criteria for the classification accuracy were satisfied.
Finally, we did not find a correlation between higher levels of Beck Scores and lower FAB scores, or higher Interference mistakes test. We did not find any relation between higher levels of HAM-A and lower FAB scores or higher Interference mistakes test. We did find a not-significant, but effective relation between higher levels of AES-C and lower FAB scores (r=−0.67, p=0.064, Spearman's correlation coefficient), but not with higher Interference mistakes test. As expected, we did find a positive correlation between Beck's score and HAM-A (r=0.89, p<0.01) (Spearman's correlation coefficient), but any with AES-C.
4DiscussionThis work is a cross-sectional study, covering 647 NAFLD-neurological outpatients, and 653 control-outpatients.
We testified that NAFLD, following data previously published, related to common vascular risk factors, such as lipid assessment and lower HDL levels, Hb1ac, AST and [9,11,32,33] and obesity [34,35].
NAFLD has been only recently related to lower levels of vitamin B complex [36], it has been shyly related to higher level of homocysteine [37], and finally, it has been tightened to lower levels of vitamin D (independent to body mass and obesity status) [38,39].
To our knowledge, this is the first work which reported a positive correlation with NAFLD and low levels of vitamin B12, folate, and vitamin D and with higher levels of homocysteine. Moreover, we documented that for an increase of vitamin D levels, the odds of having NAFLD decreased by 18%; for an increase of folate levels, the odds of having NAFLD decreased by 9%; for an increase of vitamin B12 levels, the odds of having NAFLD decreased by 7%, and for a decrease of homocysteine levels, the odds of having NAFLD decreased by 15%.
We demonstrated a higher percentage of not-hemodynamic carotid stenosis (50–75%) in NAFLD than in the control group, in line with other works [40].
Our work has also demonstrated a significant association between NAFLD and low scores of FAB and with a higher number of interference mistakes [30], higher scores of Beck and Hamilton Anxiety Test. Finally, a multivariate linear regression analysis, as shown in our model 2, NAFLD patients had lower performances on FAB, higher scores in Beck, HAM-A, and AES-C and higher Interference Number of mistakes in Stroop test after controlling for vitamin D-OH25, folate, vitamin B12, and homocysteine.
Various studies have demonstrated that obese subjects have lower folate serum levels in comparison with normal-range BMI subjects [41,42]. Furthermore, obesity is a well-known risk factor for NAFLD, as shown in our study too [43]. Therefore, it has been suggested that folate deficiency may have a pathogenic role in NAFLD [36], and it leads to a more severe form of the disease, mainly in metabolic syndrome and diabetes mellitus type 2 patients [43]. Moreover, Sid et al. [43] stressed the importance of folate in the progression of NAFLD, thus raising the possibility that supplemental folate may be a treatment option (confirmed by Xia et al. [44]).
Another important finding of this study was the role of low vitamin B12 levels as an independent predictor of NAFLD: it has been hypothesized a relationship between vitamin B12 low scores and NASH histological severity, and fibrosis grade [36]. These results corroborated previous studies, which demonstrated that NAFLD patients have lower serum levels of vitamin B12 in comparison to controls [45–47] and are in contrast with some others [48,49]. In another study [50,51], higher levels of homocysteine were observed in 71 NAFLD patients, which correlated negatively with folate and B12 concentrations. Therefore, Mahamid et al. [36] speculated that low levels of vitamin B12 might predict the development of a severe form of NASH; high levels may indicate the commencement of end-stage liver disease.
Even more difficult is to explain the dysexecutive and attention disorders showed in our NAFLD patients, associated with a somewhat increased level of depression and anxiety. The cognitive alterations observed in our study were in line, with that described by Won Seo et al. [3]: the magnitude of the association with NAFLD was robust and persisted when other vascular factors have been included in models. As suggested by Won Seo et al. [3] it remains possible that the association between NAFLD and cognitive impairment could be an epiphenomenon, mainly due to the superimposing cardiovascular risk factors, characteristic of the two conditions (NAFLD and cognitive impairment) or due to an inflammatory condition (common to NAFLD and cognitive impairment [35,52–55]). Our patients, though, underwent to neuroimaging, and we did not find any significant vascular alteration. The behavioral disturbances studied in our work reflected that NAFLD was more depressed and more anxious (in accordance to previous studies, i.e. [56–59]), and as imagined, there is a positive correlation between depression and anxiety scores. Curiously, none of the patients recruited in the study auto-defined themselves as depressed or anxious. To our best knowledge, this is the first study which analyzes apathy score and found out that NAFLD related with a higher score of apathy, which did not relate to depression or anxiety [60]. There is a single work [61] that, employing near-infrared spectroscopy (NIRS), found out that Japanese women, with NAFLD, were more depressed, with less concentration and showed a minor value of oxy-Hb concentration in the frontal lobe.
NIRS technique is not entirely and universally accepted [61,62], but it is suggestive of supporting our findings, which are strongly related to frontal–subcortical sufferance.
One of the open questions could be if the observed spectrum could be a primary effect, concerned somehow to NAFLD or secondary to all the vascular factors, which are super-imposed to NAFLD? In accordance to the Literature, NAFLD comprises metabolic risk factors, such as hypertension, higher triglycerides level, higher LDL and lower HDL, diabetes, and obesity, and even the combination of all the risk factors [63–65]. Since we have considered two neurological populations, indeed, one with NAFLD and the other without it, the metabolic syndrome, which characterized NAFLD, did not influence neurological pathologies, per se. The two groups are matched for neurological comorbidities, which did not seem to be related to the metabolic factors we found in the NAFLD group. On the other hand, the other neuropsychological spectrum of symptoms, i.e., apathy, depression, dysexecutive functions, has been observed in NAFLD group. The question remains unsolved: are they related to NAFLD or the metabolic symptoms bound to NAFLD? If so, behavior and vascular risks could even be more pronounced in patients with NASH: a further possibility for future studies could be the comparison of NAFLD and NASH population; this will hopefully give more data, with a healthy group to better understand the real role of liver alteration in the neuropsychological profile.
Our study has several limitations, being a single-center study with a small number of recruited patients and therefore with clear limits to interfere; the study has a cross-sectional design, and it does not have any pathological confirm. On the other hand, all our patients can be thoroughly studied in a standardized way, which means careful neuroimaging, LABS, Ultrasonography, and neuropsychological examinations. This way, we applied homogenous and well-accepted criteria to study our groups, NAFLD and healthy controls. The control group, matched for age, educational level and sex differences have the same neurological conditions than the other group and can be thoroughly studied.
Our data were the first to relate vitamin B12 and D, folate, and homocysteine and different neuropsychological variables to NAFLD, having excluded alcohol consumption.
More studies will be needed to implement further knowledge.
Conflict of interestThe authors have no conflicts of interest to declare.
The authors thank Mr. Andrew Highgate for the revision of the manuscript.


