


Nonalcoholic fatty liver disease (NAFLD) is the hepatic manifestation of metabolic syndrome. Some dietary fatty acids have showed different bioactive functions in metabolic syndrome. The aim of this study is to determine the dietary consumption patterns and serum percentage of bioactive fatty acids in NAFLD patients.
Patients and methodsCross-sectional study with NAFLD patients and non-NAFLD patients. Dietary consumption of bioactive fatty acids was assessed by a food frequency questionnaire. NAFLD and liver fibrosis were diagnosed by transient elastography. The identification of serum bioactive fatty acids was achieved by gas chromatography–mass spectrometry (%). Bioactive fatty acids consumption was correlated with NAFLD clinical characteristics with the Spearman correlation analysis.
ResultsA total of 299 patients were included, whose mean of age and body mass index were 44.2±9.9 years and 25.9±3.8kg/m2, respectively. The consumption of bioactive fatty acids was no different regarding the presence of NAFLD; however, the consumption of stearic and linoleic fatty acids was higher in relation with NAFLD severity (p≤0.05). The consumption of myristic acid was higher in patients with fibrosis (p=0.02). Serum percentage and dietary consumption did not show correlations.
ConclusionDietary consumption of bioactive fatty acids is different according to NAFLD severity. Individualized diets according to NAFLD severity could be successful in order to prevent liver injury-related outcomes.
body mass index
controlled attenuated parameter
fatty acid methyl ester
glycosylated hemoglobin
high density lipoprotein
low density lipoprotein
monounsaturated fatty acids
non-alcoholic fatty liver disease
non-alcoholic steatohepatitis
polyunsaturated fatty acids
saturated fatty acids
Nonalcoholic fatty liver disease (NAFLD) is one of the most frequent chronic hepatic conditions worldwide. It is characterized by the increase of fat deposits in hepatocytes in absence of high alcohol consumption, drug hepatotoxicity, or viral and autoimmune diseases [1]. NAFLD is associated with obesity, type 2 diabetes, hypertension, and dyslipidemia. This condition is considered the hepatic manifestation of metabolic syndrome. Genetic, metabolic, environmental, and nutritional factors are involved in NAFLD pathogenesis [2,3].
Reports show a prevalence of NAFLD of 20 to 40% in general population; differences in prevalence are due to different diagnostic methods and population, with variable risk factors such as genetic predisposition, socioeconomic status, and anthropometric characteristics [1,4–6]. In Mexico, the prevalence of NAFLD has been estimated in 14% to 50%. This prevalence derives from high rates of obesity and type 2 diabetes in which prevalence of NAFLD is 82% and 18%, respectively; genetic factors such as presence of PNPLA3 polymorphism in Mexican population are also related to high prevalence [7,8]. In the last few years, a modification of dietary habits in Mexican population has been characterized by an increase in saturated fats consumption and low polyunsaturated fatty acids consumption [9], which exert a direct effect in metabolic syndrome risk and chronic liver diseases development and increase.
Despite the efforts in clinical trials for pharmacological treatments for NAFLD, only two options (pioglitazone and vitamin E) have been included in American and European guidelines for NAFLD treatment [10]. The main treatment for this hepatic condition is still based on lifestyle modifications, including dietary assessment, weight loss, and physical activity [1,11].
In the last few years, dietary recommendations are focused in decreasing the total intake of dietary lipids, with special emphasis in lower consumption of saturated fatty acids (SFAs). However, some of the dietary lipids have shown different bioactive functions that depend on their molecular characteristics. These effects could mean whether a risk or a protective factor for different diseases, including those related to metabolic syndrome, like cardiovascular diseases [12].
Nowadays, a wide diversity of biological activities associated with bioactive fatty acids—including their metabolic derivatives and components—has been described that proves their role in energetic-metabolic homeostasis, cellular proliferation, inflammatory regulation, as well as the modulation of hepatocytes in obesity, NAFLD, and liver fibrosis development [13]. The saturation characteristics of fatty acids have also been related to an increased risk of metabolic diseases (SFAs), fatty acids oxidation, lipogenesis (monounsaturated fatty acids (MUFAs)), and anti/pro inflammatory properties (polyunsaturated fatty acids (PUFAs)) [14–17]. It has been established that the bioactive function of some fatty acids could be beneficial, deleterious, or dual depending on individual characteristics, such as intestinal microbiota composition, genetics, and lifestyle. In NAFLD, saturated bioactive fatty acids have showed a beneficial effect through the regulation of cholesterol and triglycerides metabolism. Notably, monounsaturated fatty acids have shown a dual effect in lipid metabolism and inflammation. On the other hand, polyunsaturated fatty acids have different effects in each component of NAFLD physiopathology: a beneficial effect has been observed in insulin resistance and obesity; the deleterious effect is characteristic of lipids metabolism and deposition; and a dual effect could be observed in inflammation and in liver fibrosis related to obesity [13].
As far as we know, recent evidence which associates bioactive fatty acids with NAFLD is mainly supported by animal models [18–20] and human studies with small samples [21–25].
The aim of this study is to determine the dietary consumption patterns and serum percentage of bioactive fatty acids in NAFLD patients.
2Material and methods2.1Patient populationThis is a cross-sectional study carried out at the Medica Sur Clinic and Foundation check-up unit. The study was approved by the Ethics Committee and it complies with the Helsinki Declaration. Patients signed an informed consent form to participate in this study.
The study population was selected from a series of consecutive patients. Exclusion criteria included alcohol intake (>20g/day), diagnosed liver disease, and current use of medication. The absence of any viral, genetic, autoimmune, and drug-induced liver disease was confirmed in each patient by laboratory tests and by a questionnaire about medications taken at the time of the check-up.
Sociodemographic data were collected. Body mass index (BMI) was calculated as [weight (kg)/height (m)2]. Complete blood counts, biochemical data including glycosylated hemoglobin (HbA1c), liver function tests, and lipid panel were performed.
2.2NAFLD and liver fibrosis evaluationA transient elastography (Fibroscan™ 502 Touch, Echosens, Paris, France) was performed in each patient, M or XL probes were chosen according to the manufacturer and quality recommendations [26]. The presence of NAFLD was identified by Control Attenuation Parameter (CAP), classifying patients in four groups according to percentage of fat measured in decibels/meter (dB/m), as: non-steatosis (<232dB/m, <5% of fat in liver cells), mild steatosis (232–256dB/m, >5% of fat in liver cells), moderate steatosis (257–290dB/m, >33% of fat in liver cells), and severe steatosis (>290dB/m, >66% of fat in liver cells). Liver fibrosis were diagnosed by Wong cut-off points [27]: >6.2kPa, as liver fibrosis, and >12kPa as advanced liver fibrosis.
2.3Bioactive fatty acids consumption analysisRecruited patients answered a food frequency questionnaire validated in Mexican population by the National Institute of Public Health software (SNUT) [28]. The SNUT software calculates the daily intake of calories, proteins, carbohydrates, fats, and micronutrients. In terms of the fat consumption analysis, the results of the questionnaire are presented as the daily intake of different nutrients and fatty acids.
We analyzed the consumption of each bioactive fatty acid and classified them according to their molecular characteristics as non-saturated (myristic acid), saturated (palmitic and stearic acids), monounsaturated (palmitoleic and oleic acids), and polyunsaturated (linoleic, linolenic, arachidonic).
2.4Bioactive fatty acids serum percentage analysisA representative sample of 40 individuals was analyzed by Gas Chromatography–Mass Spectrometry, through Mass Profiler Professional software and data extraction was completed by deconvolution on Mass Hunter Qualitative Analysis software. A peak area of ≥1% of the total chromatogram was established as criteria for exportation data for statistics. Compounds were retained for analysis by flags and frequency filtering.
Peripheral blood samples were collected in sterile pyrogen-free tubes and serum was recovered after centrifugation and stored at −80°C until use. Serum was subjected to esterification to obtain FAME (Fatty Acid Methyl Ester) reaction with some modifications [29] as follows: 200μL of serum of 10 patients per group were individually evaporated at 40°C, dissolved in 400μL of anhydrous methanol (MeOH) and 20μL of acetyl chloride, hermetically stored under N2 atmospheres, and let react for 30minutes. The reaction was cold for 3minutes and then 500μL of potassium carbonate 6% were added or until any gas evolution was registered. The total volume was transferred into a conic tube, added with 400μL of hexane, vortexed, and centrifuged for 10min (10,000rpm). 200μL of organic phase were analyzed by GC-MS using a DB-23 0.25mm×0.25μm, 30m length column with the following conditions: 8°C/min-175°C–0min, 4°C/min–230°C–10min [30]. A 38 component FAME standard mix C4-C24 was analyzed.
Compounds were identified by the correlation of their retention time and the fragmentation pattern with those of FAME standard components; additional peaks were compared with NIST library v2014.
2.5Statistical analysisThe distribution of variables was determined by the Kolmogorov–Smirnov test, while data are presented as mean±S.D., median (interquartile range), or percentage.
The comparison of dietary consumption patterns of bioactive fatty acids in patients with or without NAFLD, as well as the severity of liver diseases, was performed with ANOVA, Kruskal–Wallis, or Chi square statistical test, as needed. The Spearman correlation analysis was applied to observe the correlation of dietary consumption of bioactive fatty acids, as well as the serum percentage with biochemical data. Values of p≤0.05 were considered statistically significant. All statistical analyses were performed using the SPSS software (SPSS version 16.0, Inc., Chicago, Il, USA).
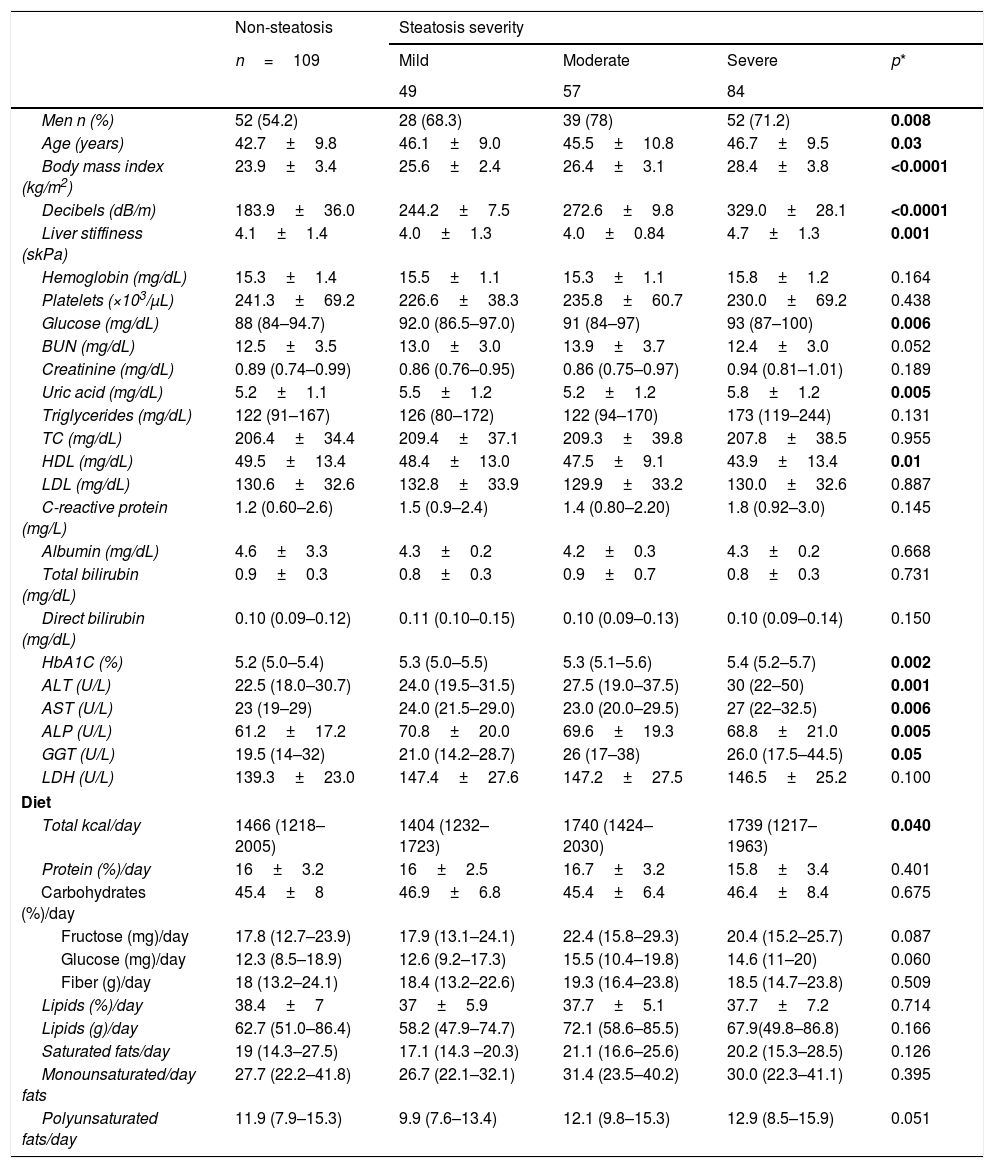
3Results3.1General characteristics of populationA total of 299 patients were included, 109 without NAFLD and 190 with NAFLD; 63.9% (n=190) were men, whose median of age and BMI were 44.2±9.9 years and 25.9±3.8kg/m2, respectively. Clinical and biochemical characteristics are shown in Table 1. In NAFLD patients, the proportion of men was higher (70.5% (n=134) vs. 29.5% (n=56)). As expected, BMI was directly proportional to NAFLD severity, as well as glucose, uric acid, triglycerides, and HbA1c levels. In NAFLD patients, levels of liver function tests were higher, but high density lipoprotein (HDL) cholesterol was lower in severe NAFLD cases (p≤0.05). Clinical, biochemical and dietary characteristics of all study participants are shown in Table 1.
Clinical, biochemical and dietary characteristics in all study participants.
| Non-steatosis | Steatosis severity | ||||
|---|---|---|---|---|---|
| n=109 | Mild | Moderate | Severe | p* | |
| 49 | 57 | 84 | |||
| Men n (%) | 52 (54.2) | 28 (68.3) | 39 (78) | 52 (71.2) | 0.008 |
| Age (years) | 42.7±9.8 | 46.1±9.0 | 45.5±10.8 | 46.7±9.5 | 0.03 |
| Body mass index (kg/m2) | 23.9±3.4 | 25.6±2.4 | 26.4±3.1 | 28.4±3.8 | <0.0001 |
| Decibels (dB/m) | 183.9±36.0 | 244.2±7.5 | 272.6±9.8 | 329.0±28.1 | <0.0001 |
| Liver stiffiness (skPa) | 4.1±1.4 | 4.0±1.3 | 4.0±0.84 | 4.7±1.3 | 0.001 |
| Hemoglobin (mg/dL) | 15.3±1.4 | 15.5±1.1 | 15.3±1.1 | 15.8±1.2 | 0.164 |
| Platelets (×103/μL) | 241.3±69.2 | 226.6±38.3 | 235.8±60.7 | 230.0±69.2 | 0.438 |
| Glucose (mg/dL) | 88 (84–94.7) | 92.0 (86.5–97.0) | 91 (84–97) | 93 (87–100) | 0.006 |
| BUN (mg/dL) | 12.5±3.5 | 13.0±3.0 | 13.9±3.7 | 12.4±3.0 | 0.052 |
| Creatinine (mg/dL) | 0.89 (0.74–0.99) | 0.86 (0.76–0.95) | 0.86 (0.75–0.97) | 0.94 (0.81–1.01) | 0.189 |
| Uric acid (mg/dL) | 5.2±1.1 | 5.5±1.2 | 5.2±1.2 | 5.8±1.2 | 0.005 |
| Triglycerides (mg/dL) | 122 (91–167) | 126 (80–172) | 122 (94–170) | 173 (119–244) | 0.131 |
| TC (mg/dL) | 206.4±34.4 | 209.4±37.1 | 209.3±39.8 | 207.8±38.5 | 0.955 |
| HDL (mg/dL) | 49.5±13.4 | 48.4±13.0 | 47.5±9.1 | 43.9±13.4 | 0.01 |
| LDL (mg/dL) | 130.6±32.6 | 132.8±33.9 | 129.9±33.2 | 130.0±32.6 | 0.887 |
| C-reactive protein (mg/L) | 1.2 (0.60–2.6) | 1.5 (0.9–2.4) | 1.4 (0.80–2.20) | 1.8 (0.92–3.0) | 0.145 |
| Albumin (mg/dL) | 4.6±3.3 | 4.3±0.2 | 4.2±0.3 | 4.3±0.2 | 0.668 |
| Total bilirubin (mg/dL) | 0.9±0.3 | 0.8±0.3 | 0.9±0.7 | 0.8±0.3 | 0.731 |
| Direct bilirubin (mg/dL) | 0.10 (0.09–0.12) | 0.11 (0.10–0.15) | 0.10 (0.09–0.13) | 0.10 (0.09–0.14) | 0.150 |
| HbA1C (%) | 5.2 (5.0–5.4) | 5.3 (5.0–5.5) | 5.3 (5.1–5.6) | 5.4 (5.2–5.7) | 0.002 |
| ALT (U/L) | 22.5 (18.0–30.7) | 24.0 (19.5–31.5) | 27.5 (19.0–37.5) | 30 (22–50) | 0.001 |
| AST (U/L) | 23 (19–29) | 24.0 (21.5–29.0) | 23.0 (20.0–29.5) | 27 (22–32.5) | 0.006 |
| ALP (U/L) | 61.2±17.2 | 70.8±20.0 | 69.6±19.3 | 68.8±21.0 | 0.005 |
| GGT (U/L) | 19.5 (14–32) | 21.0 (14.2–28.7) | 26 (17–38) | 26.0 (17.5–44.5) | 0.05 |
| LDH (U/L) | 139.3±23.0 | 147.4±27.6 | 147.2±27.5 | 146.5±25.2 | 0.100 |
| Diet | |||||
| Total kcal/day | 1466 (1218–2005) | 1404 (1232–1723) | 1740 (1424–2030) | 1739 (1217–1963) | 0.040 |
| Protein (%)/day | 16±3.2 | 16±2.5 | 16.7±3.2 | 15.8±3.4 | 0.401 |
| Carbohydrates (%)/day | 45.4±8 | 46.9±6.8 | 45.4±6.4 | 46.4±8.4 | 0.675 |
| Fructose (mg)/day | 17.8 (12.7–23.9) | 17.9 (13.1–24.1) | 22.4 (15.8–29.3) | 20.4 (15.2–25.7) | 0.087 |
| Glucose (mg)/day | 12.3 (8.5–18.9) | 12.6 (9.2–17.3) | 15.5 (10.4–19.8) | 14.6 (11–20) | 0.060 |
| Fiber (g)/day | 18 (13.2–24.1) | 18.4 (13.2–22.6) | 19.3 (16.4–23.8) | 18.5 (14.7–23.8) | 0.509 |
| Lipids (%)/day | 38.4±7 | 37±5.9 | 37.7±5.1 | 37.7±7.2 | 0.714 |
| Lipids (g)/day | 62.7 (51.0–86.4) | 58.2 (47.9–74.7) | 72.1 (58.6–85.5) | 67.9(49.8–86.8) | 0.166 |
| Saturated fats/day | 19 (14.3–27.5) | 17.1 (14.3 –20.3) | 21.1 (16.6–25.6) | 20.2 (15.3–28.5) | 0.126 |
| Monounsaturated/day fats | 27.7 (22.2–41.8) | 26.7 (22.1–32.1) | 31.4 (23.5–40.2) | 30.0 (22.3–41.1) | 0.395 |
| Polyunsaturated fats/day | 11.9 (7.9–15.3) | 9.9 (7.6–13.4) | 12.1 (9.8–15.3) | 12.9 (8.5–15.9) | 0.051 |
Data are presented as mean±SD or median (IQR).
The mean of dB/m of each group was: 183.9±36 in the non-NAFLD group (n=109); 244.2±7.5 in the mild NAFLD group (n=49); 272.6±9.8 in the moderate NAFLD group (n=57); and 329±28.1 in the severe NAFLD group (n=84). The median liver stiffness was 4.2 (IQR 3.4–4.9) kPa, and the prevalence of liver fibrosis (>6kPa) was 11.7% (n=35). There were no patients with advanced liver fibrosis (≥12kPa).
3.3Dietary consumption analysisRegarding the presence of NAFLD, significant differences were observed in dietary consumption of glucose (14.7g (IQR 10.0–19.4) vs. 12.4mg (IQR 8.2–18.9)) and fructose (20.4g (IQR 14.6–25.9) vs. 17.6mg (IQR 12.6–23.9)) (p=0.031); patients from the non-NAFLD group (n=109) showed lower consumption of these nutrients than NAFLD patients (n=190). It is important to mention that the total lipid consumption in all the population was higher (37–38.4% of total calories intake) than the daily recommended intake [15,31]. The bioactive fatty acids dietary consumption did not show significant differences between NAFLD and non-NAFLD patients.
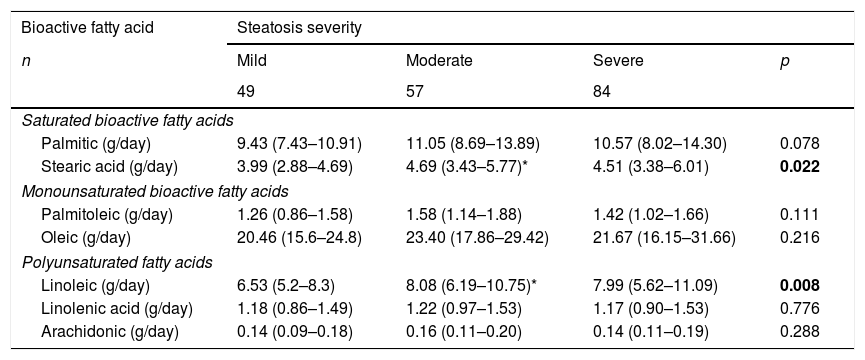
3.4Dietary consumption patterns of bioactive fatty acids according to NAFLD severityIn patients with NAFLD diagnosis (n=190), we observed significant differences in stearic and linoleic bioactive fatty acids consumption, being higher in moderate NAFLD cases (Table 2).
Profile of bioactive fatty acids consumption according to NAFLD severity (n=190).
| Bioactive fatty acid | Steatosis severity | |||
|---|---|---|---|---|
| n | Mild | Moderate | Severe | p |
| 49 | 57 | 84 | ||
| Saturated bioactive fatty acids | ||||
| Palmitic (g/day) | 9.43 (7.43–10.91) | 11.05 (8.69–13.89) | 10.57 (8.02–14.30) | 0.078 |
| Stearic acid (g/day) | 3.99 (2.88–4.69) | 4.69 (3.43–5.77)* | 4.51 (3.38–6.01) | 0.022 |
| Monounsaturated bioactive fatty acids | ||||
| Palmitoleic (g/day) | 1.26 (0.86–1.58) | 1.58 (1.14–1.88) | 1.42 (1.02–1.66) | 0.111 |
| Oleic (g/day) | 20.46 (15.6–24.8) | 23.40 (17.86–29.42) | 21.67 (16.15–31.66) | 0.216 |
| Polyunsaturated fatty acids | ||||
| Linoleic (g/day) | 6.53 (5.2–8.3) | 8.08 (6.19–10.75)* | 7.99 (5.62–11.09) | 0.008 |
| Linolenic acid (g/day) | 1.18 (0.86–1.49) | 1.22 (0.97–1.53) | 1.17 (0.90–1.53) | 0.776 |
| Arachidonic (g/day) | 0.14 (0.09–0.18) | 0.16 (0.11–0.20) | 0.14 (0.11–0.19) | 0.288 |
The total calories intake was directly proportional to NAFLD severity (mild NAFLD 1404 (1232–1723) kcal/day; moderate NAFLD 1740(1424–2030) kcal/day and severe NAFLD 1739 (1217–1963) kcal/day, p<0.04) (Table 1); however, carbohydrates, protein, and fat distribution were not different among groups.
According to decibels of CAP, we observed positive but weak correlations with consumption of palmitic (r2=0.180, p=0.018), stearic (r2=0.200, p=0.009) and linoleic (r2=0.163, p=0.032) acids. On the other hand, in patients with severe NAFLD (n=84) decibels of CAP showed significant positive, and once again, weak correlation with consumption of stearic (r2=0.329, p=0.003) and palmitoleic acid (r2=0.304, p=0.006). (Fig. 1)
 and bioactive fatty acids consumption.")
In a post hoc analysis we divided patients in groups according to severity (non-NAFLD+mild NAFLD and moderate NAFLD+severe NAFLD) to identify differences between these groups; only palmitoleic acid dietary consumption was significantly higher in moderate+severe NAFLD patients (1.4 (IQR 1.1–1.8) vs. 1.3 (IQR 1.0–1.7), p=0.044).
3.5Dietary consumption pattern of bioactive fatty acids in patients with fibrosisIn patients with fibrosis we observed a significantly higher consumption of myristic acid (1.15 (IQR 0.96–1.62 g) vs. 0.99 (IQR 0.68–1.37) g, p=0.021). In correlation analysis of consumption of bioactive fatty acids with liver stiffness (kPa) we did not observed significant correlations; however, in severe NAFLD patients (n=84), analysis of correlation, showed a weak but significantly positive correlation between consumption of palmitic (r2=0.33; p=0.003), stearic (r2=0.32; p=0.005), palmitoleic (r2=0.29; 0.01), oleic (r2=0.29; p=0.01), and linoleic acid (r2=0.29; p=0.01) and liver stiffness (Fig. 2).
3.6Serum percentage of bioactive fatty acids analysis and bioactive fatty acids consumption.")
The analysis of bioactive fatty acids serum percentage (n=40, ten patients per group) did not show differences in NAFLD patients versus non-NAFLD patients; also, we did not observe correlations between serum percentage and dietary consumption. In terms of severity, bioactive fatty acids serum percentage did not show significant correlations.
4DiscussionBioactive fatty acids consumption is an important issue since it has been related to an increased or decreased risk of developing several diseases related to metabolic syndrome, such as NAFLD [32]. This study shows the relation between bioactive fatty acids consumption, NAFLD severity, and serum percentage. As far as we know, this is the first study that evaluates all these factors and their correlation with biochemical markers related to metabolic syndrome.
We observed an increased stearic acid consumption related to NAFLD severity. Meanwhile, saturated (palmitic, stearic, and linolenic) bioactive fatty acids showed a positive correlation with NAFLD severity (dB/m), which has been related to an increase in the consumption of SFAs with hepatic fat fraction [33]. SFAs have been associated with inflammatory cytokine promotion and apoptosis induction in NAFLD [16,34]. In our sample, we observed that bioactive SFAs (stearic and palmitic acid) were positively correlated with kPa in severe NAFLD.
In our population, the higher consumption of bioactive SFAs corresponds to palmitic acid, which has been associated with increased lipotoxicity and inflammation; [35,36] nevertheless, palmitic acid did not show significant differences regarding NAFLD severity.
A balance between myristic acid and palmitic acid has been related to NAFLD and NASH (non-alcoholic steatohepatitis) [35]; apparently the inflammatory response and high cardiovascular risk are related to these two bioactive fatty acids [37]. SFAs induce apoptosis in hepatocytes, where specifically myristic acid has been proposed as a biomarker in NASH [38]. Moreover, we observed a higher consumption of myristic acid in patients with fibrosis.
It has been described that traditional Mexican diet confers a high NAFLD risk, due to the low consumption of MUFAs and PUFAs and the high consumption of SFAs [17]. Despite the fact that patients with severe steatosis showed higher consumption of MUFAs and PUFAs, daily recommended requirements are not accomplished, which has also been observed in Brazilian population [39].
Imbalance of n−3/n−6 in favor to n−6 is associated with inflammatory promotion and eicosapentaenoic acid/arachidonic acid serum index, which has been related to NAFLD development [40,41]. We observed a high consumption of linoleic acid in moderate and severe NAFLD patients, respect to mild NAFLD patients. This is a factor that may contribute to the progression from NAFLD to NASH, since the imbalance in favor to n-6 has an important role in the progression of NAFLD [16]. However, this bioactive fatty acid did also correlate with kPa in severe NAFLD patients.
In severe NAFLD patients we observed a high consumption stearic and linoleic acids. This observation could be interpreted as a sign of imbalance between n−3/n−6; such imbalance could condition the effect direction of bioactive fatty acids in terms of their dual effect, thus increasing NAFLD severity instead of showing an anti-inflammatory effect [16,42]. These results support the importance of maintaining an n−3/n−6 balance, especially in patients with evidence of fat deposition in liver tissue, thus avoiding an increase in the consumption of arachidonic acid.
The aim of the study encompasses the evaluation of dietary consumption and serum percentage pattern in NAFLD patients; however, we did not observe a correlation between consumption and serum profile. Several studies of lipidomic profile of NAFLD have been published before; however, most of them focused in animal models, even less in human samples [43]. As far as we know, our work is the first to try to correlate consumption pattern and serum percentage of bioactive fatty acids in NAFLD patients. Regrettably, this aim was not properly accomplished. A direct correlation between consumption and serum content seems to be complicated to analyze, since multiple biochemical and metabolic mechanisms occurred in the process until the lipid reaches the blood stream and still in it. Recently, several bioactive lipids, more specifically free fatty acids, have been proposed as agonists of free fatty acids receptors, which have important roles in several cells and tissues and are involved in metabolic and inflammation mechanisms [44]. Then, this may be an alternative area of study that could lead us to meet the stated objective.
The evaluation and modification of bioactive fatty acids consumption in NAFLD dietary treatment should focus on prioritizing the consumption of those that are characterized by anti-inflammatory and anti-fibrotic properties, but mainly maintaining an n−3/n−6 balance. These modifications, in combination with lifestyle modifications and physical activity, seem to be promising in the progression of liver disease prevention.
Conclusively, the dietary consumption of bioactive fatty acids is different according to NAFLD severity, but not in the presence or absence of this liver disease. Individualized diets according to NAFLD severity could be successful in order to prevent outcomes related to augmentation of inflammation, development of NASH, and progression to cirrhosis and hepatocellular carcinoma.
Author contributionsAll the authors have read and approved the final manuscript.
FundingFunding for this study was provided by the CONACyT-FOSSIS-262216, and Medica Sur, Mexico.
Conflict of interestThe authors declare no conflict of interest.
The authors would like to thank Valeria Álvarez-Rivero and Guillermo López-Sánchez for their support in data collection.


