


Hepatitis B virus (HBV) might be an etiological factor modulating fat distribution in steatotic livers. We aim to compare hepatic steatosis distribution patterns between NAFLD and FL&CHB patients with second-harmonic generation (SHG)/two-photon excited fluorescence (TPEF) method.
Patients and methods42 patients with NAFLD, 46 with FL&CHB and 55 without steatosis were enrolled in the study. Overall and regional steatosis in liver sections were quantified by SHG/TPEF method. The accuracy of which was validated by pathologist evaluation and magnetic resonance spectroscopy (MRS). Difference in degree of overall and regional steatosis between NAFLD and FL&CHB groups was analyzed by Mann–Whitney U test. Multivariable linear regression analysis was used to model factors contributing to steatosis distribution.
ResultsThe hepatic steatosis measured by SHG/TPEF method was highly correlated with pathologist grading (r=0.83, p<0.001) and MRS measurement (r=0.82, p<0.001). The level of overall steatosis in FL&CHB group is significantly lower than that in NAFLD group (p<0.001). In NAFLD group, periportal region has significantly lower steatosis percentage than lobule region and overall region (p<0.001); while in FL&CHB group there is no difference among regions. The ratio of steatosis at periportal region to lobule region is significantly higher in FL&CHB group than that in NAFLD group (p<0.05). Multivariable linear regression analysis shows that HBV infection is the major contributing factor (β=0.322, p<0.01).
ConclusionsSHG/TPEF method is an accurate and objective method in hepatic steatosis quantification. By quantifying steatosis in different histological regions, we found steatosis distribution patterns are different between FL&CHB and NAFLD patients.
As nonalcoholic fatty liver disease (NAFLD) emerges as a common liver disorder in general population, the incidence of chronic hepatitis B (CHB) patients with fatty liver (FL) increased rapidly. How hepatic steatosis is affected by hepatitis B virus (HBV) infection remains controversial. Cell and animal studies suggested HBV might enhance hepatic steatosis [1–4]; however, most of clinical studies revealed that HBV infection was negatively associated with hepatic steatosis [5–8] and there also existed some studies reporting no association between virus status and fatty liver [9,10]. Peng et al. reported higher prevalence of steatosis in CHB patients and argued that the hepatosteatosis was attributed to the metabolic factors body mass index (BMI) [11]. All these studies were based on overall steatosis assessment of liver. However, steatosis often presented in zonal distribution instead of scattered randomly on an individual cell basis in metabolic factor induced steatosis. The liver sinusoid is divided into three zones. Zone 1 rings the portal tract, and zone 3 is located around the central zone, and zone 2 is in between [12]. In NAFLD biopsy sections, the steatosis predominantly occupies zone 3 region in adult patients [13,14]. Zone 1 steatosis occurs more often in pediatric NAFLD [13,14]. The histological location of steatosis may be affected by the type of dietary. On the other hand, it is associated with its tendency to develop fibrosis [15,16]. Therefore, study steatosis distribution features in different disease situations or sub-population of the same disease is valuable in exploring the mechanism of steatosis and predicting prognosis. In this study, we explored how CHB affects the overall steatosis and its distribution.
Second-harmonic generation (SHG)/two-photon excited fluorescence (TPEF) microscopy technique is a new technique developed in recent years. With the development of both mode-locked lasers and highly sensitive optical sensors, non-linear optical microscopy, become an affordable option for tissue imaging [17]. SHG signal is able to detect collagen fibers; organizational structures and auto-fluorescence properties are displayed using TPEF imaging. Algorithm has been developed to automatically recognize different histological regions and lipid droplet using signal from both channels [18,19] in Genesis system, allowing regional steatosis quantification in addition to measurement of overall steatosis. In this study, we validated application of SHG/TPEF method in clinical paraffin section by both pathologic evaluation and MRS measurement. Taking advantage of the method introduced above, we were able to compare the overall steatosis and steatosis distribution patterns of NAFLD patients and fatty liver with CHB patients (FL&CHB).
2Patients and methods2.1PatientsPatients who were referred to the Hepatology Department of the Affiliated Hospital of Hangzhou Normal University from January 2013 to January 2018 underwent liver biopsy for suspected NASH or CHB stage assessment. Patients older than 17 and proved to be NAFLD/NASH or CHB were eligible for this study. A comprehensive clinical and laboratory assessment were conducted within one-week time frame of liver biopsy. Patients with concomitant liver diseases including chronic hepatitis C infection, autoimmune hepatitis, primary biliary cholangititis, primary sclerosing cholangitis and Wilson's disease, significant alcohol intake, drug-related causes of hepatic steatosis, currently active or suspected hepatocellular carcinoma, previous liver surgery or liver transplantation were all excluded.
2.2Ethical statementAll the patients≥18 had given written informed consent for biopsy. For patients under 18, consent forms were signed by their parents. The study was conducted according to the Declaration of Helsinki guidelines and was approved by the Ethics Committee of the Affiliated Hospital of Hangzhou Normal University
2.3Laboratory testAnthropomtric and clinical parameters were measured in all patients using standardized methods. Total cholesterol, triglycerides, low density lipoprotein-cholesterol (LDL-c), high density lipoprotein-cholesterol (HDL-c), fasting glucose and liver function tests aspartate (AST) and alanine (ALT) aminotransferase, bilirubin, albumin were measured by standard enzymatic method (7180 Automatic Biochemical analyzer Hitachi, Tokyo, Japan). Serum HBV DNA levels were measured by real-time PCR.
2.4Histopathological steatosis evaluationAll the liver biopsy specimens were routinely processed by formalin fixation and paraffin-embedding, sectioned at 5μm thickness. After hematoxylin and eosin (H&E) staining, sections were reviewed by two pathologists independently. Fatty liver is defined as the presence of >5% steatosis. The degree of steatosis was graded as 0–3, corresponding to <5%, 5–33%, 34–66%, and >66% of hepatocyte containing lipid droplets respectively according to NAS system developed by clinical research network [20].
2.5Steatosis quantification using MRS-measured proton density fat fraction (MRS-PDFF)1H-MRS was performed within one week of the liver biopsy. A Simens Avanto 1.5T MR scanner (Siemens, Germany) was used to perform 1H-MRS. Each scanning started at the end of inspiration and patients were required to hold breath during scanning process. 1H-MRS sequence parameters were as follows: volume selection: 20×20×20mm, repetition time=3000ms, echo time TE=12, 24, 36, 48, 72ms, flip angle=90°, section thickness=4mm, section gap=0.8mm, band width=1200Hz. Two volume of interest were acquired at the same location. Big vessels, bile duct and the edges of liver in all dimensions were avoided.GE sage software package was used for analysis of the 1H-MRS data. Proton density fat fraction was quantified as: the area of amplitude lipid resonances/the sum of the area of the water and lipid resonance.
2.6Steatosis assessment by SHG/TPEF method2.6.1Image acquisition5μm thick deparaffinized unstained tissue sections were obtained from all samples and imaged by the Genesis™ system (HistoIndex Pte. Lte., Singapore), in which TPEF microscopy was utilized for visualization of the cell structures, such as hepatocyte cells, immune cells and fat vacuoles (FV). The collagen can be visualized with SHG microscopy [21]. The samples were laser-excited at 780nm. SHG and TPEF signals were recorded at 390nm and 550nm, respectively. Image tiles were acquired at 20× magnifications with 512×512 pixels resolution, and each tile had a dimension of 200μm×200μm. Multiple adjacent image tiles were captured to encompass a large stitched image that contained the entire biopsy tissue.
2.6.2Steatosis quantification in overall section and in different regionInside empty space of FV, vessels, bile ducts, sinusoids, perisinusoidal spaces and cracks in SHG/TPEF images appears dark without any TPEF signals inside. An automatic image processing algorithm was able to distinguish FV from other structures by a pre-constructed decision tree [19]. Finally, the steatotic regions were determined by combining the FV and their surrounding tissue regions, expressed as percent of steatosis area to the overall area.
The steatosis in the periportal region (100μm from the center of portal triad) and lobular region (including central vein and perisinusoidal regions) was detected and the area and percentage of steatosis in each region were calculated automatically.
2.7Statistical analysisContinuous variables are expressed as mean and standard division for data excepted noted. Between group difference was analyzed by Student's t test or Mann–Whitney U test/Kruskal–Wallis for normally distributed data or non-normally distributed data, respectively. Category parameters using chi-square test. Correlations were assessed using spearman correlation coefficient. Multivariable linear regression model was used to identify risk factors contributing to the difference in steatosis distribution. A two-tailed p-value<0.05 was considered as statistically significant. All statistical analyses were performed using SPSS software version 17.0 (SPSS, Chicago, IL, USA).
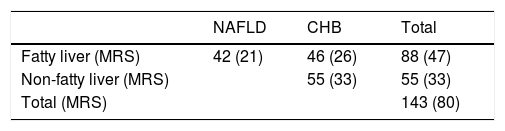
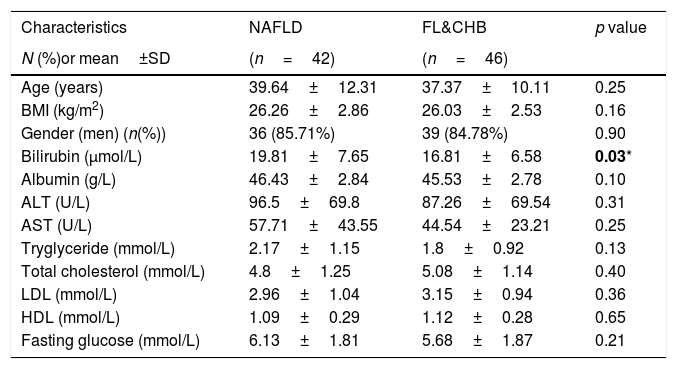
3Results3.1Patient characteristicsPatient disposition of current study is depicted in Table 1. A total of 143 subjects participated in this study. Based on pathological evaluation and viral serology data, 55 CHB subjects were non-fatty liver (steatosis<5%) patients, 88 subjects were with fatty liver. Among them, 42 were NAFLD and 46 were FL&CHB patients. 80 out of 143 participants agreed to undergo MRS for fat quantification within one-week time frame of receiving liver biopsy. Their group distribution is listed in the parenthesis in Table 1. The clinic characteristics for patients with fatty liver are listed in Table 2. There is no statistic difference in anthropomtric and clinical parameters except lower total bilirubin in FL&CHB group.
Clinical characteristics of 88 fatty liver patients.
| Characteristics | NAFLD | FL&CHB | p value |
|---|---|---|---|
| N (%)or mean±SD | (n=42) | (n=46) | |
| Age (years) | 39.64±12.31 | 37.37±10.11 | 0.25 |
| BMI (kg/m2) | 26.26±2.86 | 26.03±2.53 | 0.16 |
| Gender (men) (n(%)) | 36 (85.71%) | 39 (84.78%) | 0.90 |
| Bilirubin (μmol/L) | 19.81±7.65 | 16.81±6.58 | 0.03* |
| Albumin (g/L) | 46.43±2.84 | 45.53±2.78 | 0.10 |
| ALT (U/L) | 96.5±69.8 | 87.26±69.54 | 0.31 |
| AST (U/L) | 57.71±43.55 | 44.54±23.21 | 0.25 |
| Tryglyceride (mmol/L) | 2.17±1.15 | 1.8±0.92 | 0.13 |
| Total cholesterol (mmol/L) | 4.8±1.25 | 5.08±1.14 | 0.40 |
| LDL (mmol/L) | 2.96±1.04 | 3.15±0.94 | 0.36 |
| HDL (mmol/L) | 1.09±0.29 | 1.12±0.28 | 0.65 |
| Fasting glucose (mmol/L) | 6.13±1.81 | 5.68±1.87 | 0.21 |
Variations are expressed as mean±standard deviation except gender, which is expressed as the percentage of men.
Note: BMI, body mass index; ALT, alanine aminotransferase; AST, aspartate aminotransferase; LDL, low density lipoprotein; HDL, high density lipoprotein;
Nonstained histology sections were imaged by SHG/TPEF method and steatosis was quantified by Genesis system. As shown in Fig. 1B, signals from collagen were shown in green; TPEF signals from other structure were shown in red. Inside empty space of FV, vessels, bile ducts, sinusoid and perisinusoidal spaces are displayed as dark regions, which corresponds to white regions in H&E staining (Fig. 1A). The periportal area was recognized by computer-aid algorithm in Genesis system, the rest of area was recognized as lobule area. Lipid droplets within lobule were recognized by image processing algorithm and labeled as pink spot, while those within periportal region were shown in light blue color (Fig. 1C).
 Image acquired by conventional H&E staining, (B) SHG/TPEF image acquired by Genesis system. Fibrilla collagen is detected by SHG signal (green); cell structure is detected by TPEF signals (red), inside empty space of FV, vessels, bile ducts, sinusoid and perisinusoidal spaces are displayed as dark regions. (C) Fat vacuoles in periportal region (light blue) and lobule region (pink) are recognized by automatic image processing algorithm. Note: SHG, second-harmonic generation; TPEF, two-photon excited fluorescence; FL, fatty liver; CHB, chronic hepatitis B; H&E, Hematoxylin and Eosin; FV, fat vacuoles.")
SHG/TPEF imaging and regional steatosis recognition by SHG/TPEF method in a 53 years-old-man with FL&CHB. (A) Image acquired by conventional H&E staining, (B) SHG/TPEF image acquired by Genesis system. Fibrilla collagen is detected by SHG signal (green); cell structure is detected by TPEF signals (red), inside empty space of FV, vessels, bile ducts, sinusoid and perisinusoidal spaces are displayed as dark regions. (C) Fat vacuoles in periportal region (light blue) and lobule region (pink) are recognized by automatic image processing algorithm. Note: SHG, second-harmonic generation; TPEF, two-photon excited fluorescence; FL, fatty liver; CHB, chronic hepatitis B; H&E, Hematoxylin and Eosin; FV, fat vacuoles.
Steatosis area identified by the system was quantified and expressed as the percentage of steatotic region to the corresponding total region (%steatosis). To evaluate the accuracy of this automatic method, the quantification results of overall steatosis by SHG/TPEF method was compared with pathologic grading according to semi-quantitative NAS system developed by clinical research network [20]. The results correlate well with histopathological grading (r=0.83, p<0.001) (Fig. 2A). We also studied the correlation of quantitative results between SHG/TPEF method and MRS assessment, the later has been considered as golden standard for noninvasive screening of fatty liver [22,23]. There was significant Spearman rank correlation between SHG and MRS methods (r=0.82, p<0.001) (Fig. 2B).
3.4Comparison of steatosis distribution between NAFLD and FL&CHB
We compared the percent of steatosis in overall (%steatosis O), periportal (% steatosis PT) and lobule (%steatosis L) area in each fatty liver group with/without CHB. As shown in Fig. 3A, the median %steatosis PT in NAFLD is significantly lower than %steatosis L and %steatosis O (p<0.001). Fig. 3C is a representative scanning picture in NAFLD group with FV in different region labeled with different color as described in Fig. 1. Predominant steatosis occurs in lobule region. While in FL&CHB group, there is no obvious regional difference (Fig. 3B, D).
 and FL& CHB group (B). Representative scanning picture from liver section of NAFLD group (C), in which, predominant steatosis occurs in lobule region and almost all FV are colored in pink. D is a typical picture from liver section of FL&CHB group. FV present in both lobule region (in pink) and periportal region (in blue) with no obvious regional preference. Note: NAFLD, non-alcoholic fatty liver disease; FL, fatty liver; CHB, chronic hepatitis B.")
Steatosis distributions in different histological regions in liver biopsy sections from NAFLD and FL& CHB patients. Comparison of percent of steatosis in overall, periportal and lobule region in NAFLD (A) and FL& CHB group (B). Representative scanning picture from liver section of NAFLD group (C), in which, predominant steatosis occurs in lobule region and almost all FV are colored in pink. D is a typical picture from liver section of FL&CHB group. FV present in both lobule region (in pink) and periportal region (in blue) with no obvious regional preference. Note: NAFLD, non-alcoholic fatty liver disease; FL, fatty liver; CHB, chronic hepatitis B.
When the %steatosis O was compared in these two groups, we found it is significantly lower in FL&CHB group (Fig. 4A) (p<0.001). In order to exclude that the different distribution pattern is due to difference in total steatosis, we decided to compare the ratio of %steatosis PT to %steatosis L in each sample irrelevance of overall steatosis. As shown in Fig. 4B, %steatosis PT/%steatosis L is significantly higher in FL&CHB than NAFLD (p<0.05) (Fig. 4B). We also compared relative degree of %steatosis PT by normalizing %steatosis PT to %steatosis O. the relative degree of steatosis in periportal area (%steatosis PT/%steatosis O) is more severe in FL&CHB group than that in NAFLD group (p<0.05) (Fig. 4C).
; ratio of percent of steatosis in periportal region to percent of steatosis in lobule region (B), relative degree of steatosis in periportal region by normalizing to overall steatosis (C). Note: NAFLD, non-alcoholic fatty liver disease; FL, fatty liver; CHB, chronic hepatitis B.")
Comparison of steatosis in overall region and relative steatosis in local region between NAFLD and FL& CHB group. Comparison of steatosis between NAFLD and FL&CHB group in overall region (A); ratio of percent of steatosis in periportal region to percent of steatosis in lobule region (B), relative degree of steatosis in periportal region by normalizing to overall steatosis (C). Note: NAFLD, non-alcoholic fatty liver disease; FL, fatty liver; CHB, chronic hepatitis B.
Next, we test which clinical parameters independently associated with %steatosis PT/%steatosis L. After adjusting for confounders such as group, gender, age, BMI and blood lipids levels, glucose, ALT, AST and overall steatosis in the liver, linear regression analysis showed that %steatosis PT/%steatosis is positively associated with HBV infection (β=0.322, 95% CI: 0.095, 0.550; p=0.006) and fasting blood glucose level (β=0.077, 95% CI: 0.018–0.136, p=0.011).
4DiscussionIn current study, we report that steatosis could be quantified accurately and automatically by SHG/TPEF microscopy and adaptive quantification algorithm in Genesis system. In addition, this method could measure the steatosis in specific histological region defined by Genesis system. This allowed us to compare both the overall steatosis and the steatosis distribution patterns of liver biopsy sections from NAFLD patients and FL&CHB patients. We discovered that the ratio of steatosis in periportal area to lobule area in FL&CHB group is significantly higher than that in NAFLD group, linear regression analysis shows that HBV infection is associated with this distribution pattern difference.
Recently, liver fibrosis quantification by SHG/TPEF method has been reported in several papers [24–26]. It has been demonstrated that it is a sensitive, quantitative and automatic way to quantify collagen. Here we report that with the same technique hepatic steatosis could be accurately quantified simultaneously. The quantification method is validated by both pathological grading and MRS quantification. It is proved to be highly consistent with these classic methods. It was firstly described in a recently report [27]. In that study involving 86 subjects, the steatosis quantification result was also highly consistent with pathologists grading (r=0.93). In our study, we used MRS as an additional objective method to validate the results, and similarly, we found that SHG/TPEF method was highly correlated with MRS assessment. Both our study and the previous report support the SHG method as an accurate way to quantify hepatic steatosis.
It has been reported that in rat, coherent anti-Stokes Raman scattering microscopy has been used for steatosis assessment in frozen section by probing inherent lipid vibration from lipid [28,29], TPEF signals were only used for tissue and cell morphology. In this study, paraffin section was used, combined information from TPEF/SHG were used for recognizing lipid droplet by specific imaging processing algorithm without relying on anti-Stoke Raman scattering microscopy. Sections prepared for SHG/TPEF quantification is convenient for storage, do not require H&E staining step, which saves time prior to evaluation and void variation brought by staining procedure. This automatic quantitative method only requires very short time of technical training, will be particular suitable for the assessment of clinical trial for NASH treatment, in which histology improvement is a major end point to define treatment response [30,31]. Automatic and accurate quantification of steatosis could guarantee the objective and reliability of the assessment.
In current study, we found that FL&CHB patients accumulate much less fat in the liver, which is consistent with several other studies reporting negative relationship between HBV infection and incident rate of fatty liver. Lower steatotic levels in FL&CHB patients may be explained by the fact that CHB patients tend to avoid high fat food consciously, as some research suggested [32]. However, in our study population, as shown in Table 2, the hepatic steatosis in CHB&FL patients is dramatically decreased (p<0.001) although they only had slightly but not significant lower BMI than NAFLD patients (p=0.16), suggesting the diet and nutrition might not be a critical factor for the difference. Indeed, the infection of HBV by itself may inhibit the development of steatosis, as study showed that HBsAg seropositivity was negatively associated with the incidence of NAFLD after adjusting for BMI [8] and HBV DNA was positively associated with adiponectin levels, the decrease of which is a causative factor in the pathogenesis of NAFLD [33]. In addition to the merit of quantitative measurement of overall steatosis, by incorporating SHG signal from collagen and other cell structure signal from TPEF, Genesis system is able to identify different histological regions, quantitatively assess steatosis in different region automatically.
In this study, we compared the steatosis distribution patterns in the livers of NAFLD and FL&CHB patients in addition to overall steatosis. In NAFLD group, steatosis mainly occurs within lobule area, which is a typical distribution pattern in adult NAFLD [13,14,34]. Interestingly, we discovered that this typical distribution pattern shifted significantly, the ratio of %steatosis PT/%steatosis L is significantly higher in FL&CHB group comparing to NAFLD group.
Hepatic steatosis often shows zonation patterns. This may be related to metabolic zonation change. Recently, a single-cell transcriptome analysis of fixed mouse liver found 50% gene express differently in different liver zone [35]. This pattern may change under pathological conditions or may contribute to the disease [36]. Wnt/β-catenin signaling pathways have been reported to be a fundamental regulator of liver zonation. This pathway is most active in pericentral area and repressed in periportal area [37]. Mareau et al. reported in the liver of HCV transgenic mouse, major lipogenic enzyme redistributed from normal periportal region into the midzone of the lobule, which is coincidence with the accumulation of steatosis in the midzone. The author connected this with the activation of Wnt/β-catenin pathways by HCV infection [38]. In HBV patients, it was also found Wnt/β-catenin pathway is enhanced [39]. Whether this might be the potential mechanism for the change of steatosis distribution patterns need to be further studied.
What is more important to clinicians is what this distribution alteration means to clinical practice. Differential steatosis distribution patterns are also seen between adult NAFLD and pediatric NAFLD. In adult NAFLD, steatosis typically located in the pericentral region as demonstrated in our study. Comparing to adult NAFLD, pediatric NAFLD is predominantly zone 1 steatosis, which is close to portal tract. Cross study shows that this type of steatosis is associated with more advanced fibrosis [16]. Whether this is the case for FL&CHB patients is not clear. It is worth to explore how steatosis affects the progression of HBV related fibrosis. Besides, whether this type of steatosis responses differently from typical adult NAFLD steatosis in treatment also need to be further addressed.
The limitation of our study is that it is cross-sectional and thus causal inference of HBV could not be firmly established. It would be more convincing if we could confirm this by showing histology alteration pre and post anti-virus therapy. Unfortunately, second biopsy is hard to obtain due to ethic issue. Secondly, the relatively small number of study population may not guarantee a general conclusion.
5ConclusionsWe demonstrated that SHG/TPEF method is an accurate and objective way to quantify hepatic steatosis. With its regional quantification feature, it could be used to study steatosis with different distribution patterns. In this study, by comparing liver overall and regional steatosis between FL&CHB patients and NAFLD patients, we found HBV infection not only affect the steatosis in liver quantitatively, but also changed their distribution patters by increasing ratio of steatosis PT to steatosis L significantly.AbbreviationsALT alanine aminotransferase aspartate aminotransferase hematoxylin and eosin second-harmonic generation body mass index chronic hepatitis B fatty liver high density lipoprotein cholesterol hepatitis B virus low density lipoprotein cholesterol magnetic resonance imaging magnetic resonance spectroscopy non-alcoholic fatty liver disease NAFLD activity score non-alcoholic Steatohepatitis two-photon excited fluorescence fat vacuoles
This work was supported by Major Project of Health Planning Science and Technology Program from Hangzhou, China under grant number 2015ZD02.
Conflict of interestNone.
We thank Yayun Ren for his technical support in steatosis quantification by Genesis system.


