


Introduction and aim. Epigenetic alterations play an essential role in cancer onset and progression, thus studies of drugs targeting the epigenetic machinery are a principal concern for cancer treatment. Here, we evaluated the potential of the DNA methyltransferase inhibitor 5-aza-2’-deoxycytidine (5aza-dC) and the pan-deacetylase inhibitor Trichostatin A (TSA), at low cytotoxic concentrations, to modulate the canonical Wnt/β-catenin pathway in liver cancer cells.
Material and methods. Pyrosequencing was used for DNA methylation analyses of LINE-1 sequences and the Wnt/β-catenin pathway antagonist DKK3, SFRP1, WIF1 and CDH1. qRT-PCR was employed to verify the expression of the antagonist. Pathway regulation were evaluated looking at the expression of β-catenin and E-cadherin by confocal microscopy and the antitumoral effects of the drugs was studied by wound healing and clonogenic assays.
Results. Our result suggest that 5aza-dC and TSA treatments were enough to induce a significant expression of the pathway antagonists, decrease of β-catenin protein levels, re-localization of the protein to the plasma membrane, and pathway transcriptional activity reduction. These important effects exerted an antitumoral outcome shown by the reduction of the migration and clonogenic capabilities of the cells.
Conclusion. We were able to demonstrate Wnt/ β-catenin pathway modulation through E-cadherin up-regulation induced by 5aza-dC and TSA treatments, under an activation-pathway background, like CTNNB1 and TP53 mutations. These findings provide evidences of the potential effect of epigenetic modifier drugs for liver cancer treatment. However, further research needs to be conducted, to determine the in vivo potential of this treatment regimen for the management of liver cancer.
The International Agency for Research on Cancer, estimated that 782,000 new liver cancer cases occurred globally in 2012, being the fifth most common cancer in men and the ninth in women; likewise, is the second cause of cancer related death worldwide. Even of more concern, the prognosis is poor and the relapse of the disease and metastasis are common.1
The canonical Wnt/β-catenin signaling pathway plays a critical role in liver cancer development.1,2 This pathway is highly conserved among species and plays pivotal roles in the regulation of cell fate. During embryonic development cooperates in the establishment of cell polarity and also in tissue and organ formation. In adult organs participates in tissue homeostasis regulation, stem cell maintenance, adhesion, proliferation and regeneration.3 Thus, their deregulation results in developmental defects4 and also leads to diverse diseases.5
β-catenin is the key component of the canonical Wnt/β-catenin pathway, since it is involved in cell adhesion, linking E-cadherin to the cytoskeleton.6 Upon Wnt-mediated signaling, β-catenin translocate to the nucleus where promotes the expression of genes involved in cell proliferation and differentiation, like c-MYC (v-myc avian myelocytomatosis viral oncogene homolog),7 in conjunction with Lef/Tcf transcription factors (lymphoid enhancer-binding factor/T cell factor). In absence of Wnt signaling, β-catenin is phosphorylated on serine-threonine residues located in its N-terminal domain by Gsk3β (glycogen synthase kinase 3 beta) and CkIα (casein kinase-alpha), in complex with Apc (adenomatous polyposis coli) and Axin (axis inhibitor), to induce the proteasomal degradation of β-catenin.6
Aberrant β-catenin activation occurs by both genetic and epigenetic alterations in different components of the pathway. In hepatocellular carcinoma (HCC), activating mutations in CTNNB1 gene (encoding for β-catenin) are present in 8-30% of tumors; additionally, 1%-15% of cases have APC and AXIN mutations. Likewise, FZD7 (frizzled class receptor 7) and WNT3A (wingless-type MMTV integration site family, member 3A) overexpression are also frequent in HCC.2
DNA methylation and histone modifications are the most widely studied epigenetic alterations. In this context, it is well known that tumor cells present focal hypermethylation of CpG islands located in the promoter of tumor suppressor genes, like the Wnt/β-catenin pathway antagonist CDH1 (cadherin-1), DKK3 (dickkopf WNT signaling pathway inhibitor-3), SFRP1 (secreted frizzledrelated protein-1) and WIF1 (WNT inhibitory factor-1), thereby preventing the expression of the corresponding gene.8–10
Given the important contribution of the epigenetic alterations in cancer development, there is an increasing interest to develop epigenetic modifiers drugs that targets specific chromatin regulatory proteins, like DNA-methyltransferases (DNMTs) and histone deacetylases (HDACs). Some of these drugs have been already approved to be tested in clinical trials and in the clinic, for the treatment of cutaneous T cell lymphomas, B cell malignancies, myelodysplastic syndromes and acute myeloid leukemias.11–13
The aim of this study is to evaluate the potential of the combination of 5aza-dC and TSA, to modulate the Wnt/β-catenin pathway in liver cancer cell lines, and determine the effect of this possible regulation over the migratory and survival properties of these cells.
Material and MethodsCell linesHuman epithelial-derived hepatoma cell lines HepG2 and HuH7 were used. HepG2 has a constitutively active β -catenin isoform, resulting from a deletion in one allele of CTNNB1 gene, that results in the lost of amino acids 25-140 of the protein.14 HuH7 is β-catenin wild type, but harbors a mutation in the DNA binding domain of TP53 gene, that promotes β-catenin accumulation.14 Cell lines were cultured in DMEM medium (Gibco, Carlsbad, United-States), supplemented with 10% FBS, 1% penicillin-streptomycin, 1% L-glutamine and 1% sodium pyruvate (all from Life Technologies, Carlsbad, United-States). Cells were maintained in a humidified incubator at 37 °C and 5% of CO2.
Combined treatmentsDifferent concentrations of 5aza-dC and TSA (both from Sigma-Aldrich, St. Louis-United States) were tested according to previous literature reports,9,15–17 treating 6 x 10³ cells during 96 h with 5aza-dC, adding TSA for the last 24 h (Figure 1A). However, it is well known that high drugs concentrations, greatly reduces cell proliferation, viability and induces apoptosis.18,19 For these reasons, concentrations of 5aza-dC (1 μM) and TSA (100 nM) were selected to maintain viability ~80% in the cell lines, when compared to untreated cells (Figure 1B). Control cultures (untreated cells) received 0.1% of drug vehicle (DMSO). In independent experiments, and to determine the influence of treatments on cell proliferation, 6 × 10³ cells were treated during 96 h with 1 of 5aza-dC alone, or adding 100 nM of TSA for the last 24 h of the 96 h 5aza-dC treatment. At 24 h, 48 h, 72 h and 96 h of treatments, MTT (Sigma-Aldrich) was added to each well and cells incubated for 4 h in the dark at 37 °C, previous to measure the absorbance at 560 nm using the microplate reader Glomax multidetection system (Promega, Madison-United States). As shown in figure 2, cells grew exponentially in presence of 5aza-dC alone; but by adding TSA, an important inhibition of cell proliferation was observed. Freshly prepared medium containing drugs for treated cells or DMSO for untreated cells was changed on a daily basis. All treatments were carried out using exponentially growing cultures.
, with 95% confidence intervals ± SD. p < 0.05 denotes statistical significance. *p < 0.05. **p < 0.005. ***p < 0.0005. ****p < 0.0001.")
Treatment outline determination. Different combinations of 5aza-dC and TSA were tested according to what previously reported in the literature. A. Cells were treated with 5aza-dC, adding TSA for the last 24 h of treatment. B. Cells were treated with 1 µΜ of 5aza-dC, adding 100 nM of TSA for the last 24 h of treatment. The experiments were performed in triplicate and results correspond to means and the comparison of the means, between treated and non-treated cells (DMSO), with 95% confidence intervals ± SD. p < 0.05 denotes statistical significance. *p < 0.05. **p < 0.005. ***p < 0.0005. ****p < 0.0001.
, adding TSA for the last 24 h of treatment (measure at 96 h). Absorbance is directly proportional to cell density in the well. The experiments were performed in triplicate and results correspond to means and the comparison of the differences of the means, between treated and non-treated cells, with 95% confidence intervals ± SD. p < 0.05 denotes statistical significance. *p < 0.05, **p < 0.005, ***p < 0.0005, ****p < 0.0001.")
Growth of HepG2 and HuH7 cell lines. A. HepG2 and HuH7 cell lines treated with 5aza-dC alone for 96 h. B. HepG2 and HuH7 cell lines treated with 5aza-dC (measures at 24 h, 48 h and 72 h), adding TSA for the last 24 h of treatment (measure at 96 h). Absorbance is directly proportional to cell density in the well. The experiments were performed in triplicate and results correspond to means and the comparison of the differences of the means, between treated and non-treated cells, with 95% confidence intervals ± SD. p < 0.05 denotes statistical significance. *p < 0.05, **p < 0.005, ***p < 0.0005, ****p < 0.0001.
5 × 10⁴ cells were seeded into 12-wells plates and treated with 5aza-dC 1 μM and TSA 100TM. Thereafter, cells were detached, fixed with ethanol and kept at 4 °C for 24 h. For the analysis of the SubG1 fraction, RNAse A (Sigma-Aldrich) and propidium iodide (Sigma-Aldrich) were added to cell suspensions. Cells were then incubated for 30 min at 37 °C in the dark and the distribution of cell cycle phases measured in a Coulter EPICS XL flow cytometer (Beckman Coulter, Miami-United States), and the data analyzed with FlowJo software (FlowJo, Ashland-United States).
Cell viability, cytotoxicity and caspase activityTo determine simultaneously processes related with cellular death in a single well, the ApoTox-Glo™ Triplex Assay Kit (Promega) was used, following the manufacturer instructions. All measurements were performed using the microplate reader Glomax multidetection system (Promega). 6 × 10³ cells were seeded into 96-well plates and treated with 5aza-dC 1 μM and TSA 100 nM.
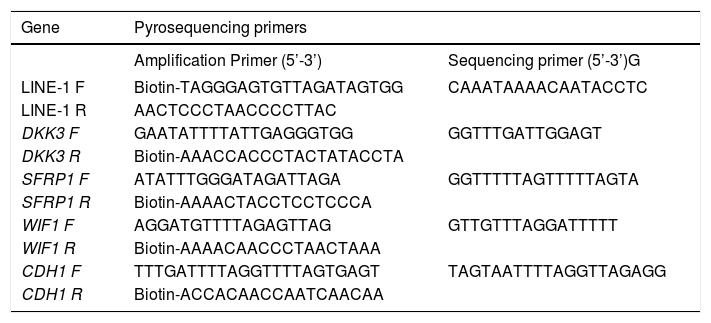
Bisulfite modification and pyrosequencingDNA was extracted using the Allprep DNA/RNA mini kit (Qiagen, Hilden-Germany). For the quantitative measurement of DNA methylation levels in individual CpG sites in the promoter region of DKK3 (8 CpGs), SFRP1 (7 CpGs), WIF1 (5 CpGs) and CDH1 (7 CpGs) genes and LINE-1 sequences (5 CpGs) (Table 1), we performed sodium bisulfite modification on 500 ng of DNA using the EZ DNA Methylation-Gold Kit (Zymo Research, Irvine-United States). Pyrosequencing was performed as previously described using the PyroMark Q96 ID pyrosequencing system (Qiagen).20 The methylation levels at the target CpGs were evaluated by converting the resulting pyrograms to numerical values for peak heights and expressed as the average of all CpG sites analyzed at a given gene promoter.
Pyrosequencing primers. Primer sequences used for methylation analysis. All the primers were designed at the Epigenetics group of the International Agency for Research on Cancer.
| Gene | Pyrosequencing primers | |
|---|---|---|
| Amplification Primer (5’-3’) | Sequencing primer (5’-3’)G | |
| LINE-1 F | Biotin-TAGGGAGTGTTAGATAGTGG | CAAATAAAACAATACCTC |
| LINE-1 R | AACTCCCTAACCCCTTAC | |
| DKK3 F | GAATATTTTATTGAGGGTGG | GGTTTGATTGGAGT |
| DKK3 R | Biotin-AAACCACCCTACTATACCTA | |
| SFRP1 F | ATATTTGGGATAGATTAGA | GGTTTTTAGTTTTTAGTA |
| SFRP1 R | Biotin-AAAACTACCTCCTCCCA | |
| WIF1 F | AGGATGTTTTAGAGTTAG | GTTGTTTAGGATTTTT |
| WIF1 R | Biotin-AAAACAACCCTAACTAAA | |
| CDH1 F | TTTGATTTTAGGTTTTAGTGAGT | TAGTAATTTTAGGTTAGAGG |
| CDH1 R | Biotin-ACCACAACCAATCAACAA | |
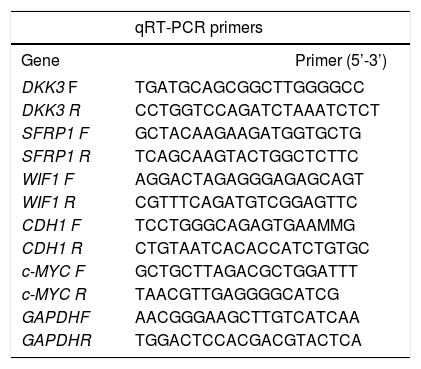
RNA was extracted using the Allprep DNA/RNA mini kit (Qiagen). Five hundred ng of total RNA were used to generate cDNA, using the M-MLV reverse transcriptase (Life Technologies) and random hexamer primers. qRT-PCRs were performed to determine mRNA levels of DKK3, SRP1, WIF1, CDH1 and c-MYC. GAPDH was used as reference gene (Table 2). The assays were performed using MESA GREEN qPCR MasterMix Plus (eu-rogentec, Liege-Belgium) and a CFX96 Real-Time PCR Detection System (Biorad, Hercules-United States). Relative fold-changes in mRNA levels compared to controls, were measured using the 2-AACt calculations (ΔΔCt=ΔCttreated−ΔCtcontr°l). In independent experiments, cells were treated with 100 nM of TSA alone for 48 h to evaluate the effect of the HDAC inhibitor in CDH1 expression.
qRT-PCR primers. Primer sequences used for gene expression analysis. All the primers were designed at the Epigenetics group of the International Agency for Research on Cancer.
| qRT-PCR primers | ||
|---|---|---|
| Gene | Primer (5’-3’) | |
| DKK3 F | TGATGCAGCGGCTTGGGGCC | |
| DKK3 R | CCTGGTCCAGATCTAAATCTCT | |
| SFRP1 F | GCTACAAGAAGATGGTGCTG | |
| SFRP1 R | TCAGCAAGTACTGGCTCTTC | |
| WIF1 F | AGGACTAGAGGGAGAGCAGT | |
| WIF1 R | CGTTTCAGATGTCGGAGTTC | |
| CDH1 F | TCCTGGGCAGAGTGAAMMG | |
| CDH1 R | CTGTAATCACACCATCTGTGC | |
| c-MYC F | GCTGCTTAGACGCTGGATTT | |
| c-MYC R | TAACGTTGAGGGGCATCG | |
| GAPDHF | AACGGGAAGCTTGTCATCAA | |
| GAPDHR | TGGACTCCACGACGTACTCA | |
In order to describe the subcellular localization of E-Cadherin and β -catenin, 5 × 10⁴ cells were grown and treated with 5aza-dC 1 and TSA 100 nM in cover slips, and fixed with 4% formaldehyde for 20 min, then washed and stained with primary antibodies against E-Cadherin (NB110-56937, Novus Biologicals, Minneapolis-United States) by O/N incubation and β-catenin (610154, BD Transduction Laboratories, San Jose-United States) by 1 h incubation. Alexa Fluor 488 and Alexa Fluor 555 (Life Technologies) were used as secondary antibodies, and then counterstained with TO-PRO-3-iodide (Life Technologies) for nuclear staining and mounted with VECTASHIELDs Mounting Medium (Vector Laboratories, Burlingame-United States). An Axiovert LSM 510 confocal microscope (Zeiss, Oberkochen-Germany) was used for image collection. Images were analyzed using LSM image browser software (Zeiss).
CDH1 knock-downCells were treated with 5aza-dC 1 μM and TSA 100 nM. After TSA addition, a mixture of 4 siRNAs against CDH1 or 1 non-targeting siRNA (Dharmacon, Lafayette-United States) were transfected at a final concentration of 15 nM using FuGENE HD transfection reagent (Promega). After 12 h of transfection, cells were washed and medium was replaced and total RNA was collected after 72 h of transfection, in order to look for CDH1 and c-MYC expression.
Colony formation assayClonogenic assays were performed to determine the capability of the cells to form colonies. After treatments with 5aza-dC 1 μM and TSA 100 nM, 40,000 cells were cultured in 6-well plates over a semisolid agar (0.6% of standard agarose) for 4 weeks, changing the medium two times per week. Then, the cells were fixed and stained with 0.01% (w/v) crystal violet. In independent experiments, cells were treated with 100 nM of TSA alone for 48 h. The colonies were automatically quantified with Image J, using the plugin Colony Area.21
Wound healing assayTo explore if treatments with 5aza-dC 1 μM and TSA 100 nM could influence the migration of the cell lines after an injury stimulus, 5 × 10⁴ cells were seeded in 12-well plates and cultured without FBS. Upon reaching appropriate confluence, treatments were initiated and 24 h later the cell layer was scratched with a sterile plastic tip, washed twice with medium to remove the debris and cultured until the end of treatments. At least 3 fields from each well were photographed every 12 h under a microscope using a Nikon DsFi1c digital camera with 10x magnification (Nikon, Tokyo-Japan). In independent experiments, 1x10⁵ cells were treated with 100 nM of TSA alone for 48 h, scratching the cell layer from the beginning of the assay. The images were analyzed using Bio-EdIP, an automatic approach for in vitro cell confluence images quantification, developed by Grupo de Investigación e Innovación Biomédica-ITM.22
Statistical analysisMeans and the comparison of the differences of the means, between treated and non-treated cells, with 95% confidence intervals ± SD were obtained using GraphPad Prism® 6.0 (GraphPad Software Inc., La Jolla-United States). Two-tailed student t test was used for unpaired analysis to compare the results between treated and non-treated cells, assuming the normality of the data; p < 0.05 values were considered statistically significant. All experiments were carried out at least in triplicate.
ResultsCell death and cytotoxicity analysesTo be sure that the outcome of the treatments is given by a biological effect induced by the epigenetic-acting drugs and not by extensive cell death and/or high cytotoxicity, the influence of the combined regimen on these mechanisms were assessed at the selected concentrations. As shown in figures 3A-B, treated cells displayed slightly higher sub-G1 populations compared with non-treated cells (HepG2 non-treated 0.83% vs. treated 2.21%, p = 0.3652; and HuH7 non-treated 0.68% vs. treated 6.93%, p = 0.0105). As shown above (Figure 1B), treated cells displayed lower viability than non-treated cells (Figures 3C-D). However, cytotoxicity levels and caspase activity were similar between treated and non-treated cells (Figures 3C-D), being cytotoxicity considerably higher in HuH7 cell line, compared to HepG2 cells.
 and HuH7 (B) cell lines, non-treated (DMSO) and treated with 5aza-dC and TSA. Cell viability, cytotoxicity and apoptosis of HepG2 (C) and HuH7 (D) cell lines after treatments. The results are presented as relative fluorescence units (RFU) and as relative luminescence units (RLU), compared to non-treated controls. The experiments were performed in triplicate and results correspond to means and the comparison of the differences of the means, between treated and non-treated cells, with 95%% confidence intervals ± SD. p < 0.05 denotes statistical significance. *p < 0.05.")
Cell death and cytotoxicity analysis. Propidium iodide were used to measure the DNA content in HepG2 (A) and HuH7 (B) cell lines, non-treated (DMSO) and treated with 5aza-dC and TSA. Cell viability, cytotoxicity and apoptosis of HepG2 (C) and HuH7 (D) cell lines after treatments. The results are presented as relative fluorescence units (RFU) and as relative luminescence units (RLU), compared to non-treated controls. The experiments were performed in triplicate and results correspond to means and the comparison of the differences of the means, between treated and non-treated cells, with 95%% confidence intervals ± SD. p < 0.05 denotes statistical significance. *p < 0.05.
These results corroborate our observations that treatments with 5aza-dC 1 μM and TSA 100 nM are sub-toxic to the liver cancer cell lines.
Effect of 5aza-dC and TSA on gene promoter methylationThe canonical Wnt/β-catenin signaling pathway plays a critical role in HCC development, being activated in 40-70% of the cases.2,23 Therefore, to analyze the potential of the combination of the demethylating agent and HDAC inhibitor used to modulate the epigenetic alterations of different Wnt/β-catenin pathway antagonists, we evaluated the promoter DNA methylation status near to the transcriptional start site of the genes DKK3, SFRP1, WIF1, CDH1 (codes for E-cadherin) and LINE-1 sequences.
It was found that global methylation levels, measured by LINE-1 sequences analysis, decreased after treatments in both cell lines (Figures 4A-B), being 62.8% vs. 53.6% in HepG2 non-treated vs. treated (p = 0.0037) and 62.7% vs. 43.3% in HuH7 non-treated vs. treated (p = 0.0014).
 and HuH7 cells (B). Methylation levels of each gene were compared between treated (5aza-dC+TSA) and non-treated (DMSO) cells. NT: non-tretaed and T: treated. The experiments were performed in triplicate and results correspond to means and the comparison of the differences of the means, between treated and non-treated cells, with 95°% confidence intervals ± SD. p < 0.05 denotes statistical significance. *p < 0.05, **p < 0.005, ***p < 0.0005.")
Effect of 5aza-dC and TSA on promoter methylation of the Wnt/β-catenin pathway antagonists. Average methylation levels of DKK3, SFRP1, WIF1, CDH1 gene promoters and LINE-1 sequences in HepG2 cells (A) and HuH7 cells (B). Methylation levels of each gene were compared between treated (5aza-dC+TSA) and non-treated (DMSO) cells. NT: non-tretaed and T: treated. The experiments were performed in triplicate and results correspond to means and the comparison of the differences of the means, between treated and non-treated cells, with 95°% confidence intervals ± SD. p < 0.05 denotes statistical significance. *p < 0.05, **p < 0.005, ***p < 0.0005.
Regarding the pathway antagonists, the results revealed differentially methylation patterns between the cell lines, being WIF1 (96.5%, p ≤ 0.0001) and SFRP1 (84.3%, p ≤ 0.0001) hypermethylated in HepG2 and HuH7 cells, respectively, when compared to LINE-1 methylation levels. In the case of CDH1, the gene is essentially unmethylated in both cell lines (Figures 4A-B).
In HepG2 cells, changes in methylation levels after treatments were statistically significant for DKK3 (34.1% vs. 29.9%; p = 0.0137), SFRP1 (60.9% vs. 55.9%; p = 0.0435) and WIF1 (96.5% vs. 94.5%; p = 0.0463) for non-treated vs. treated cells, respectively (Figure 4A). Likewise, in HuH7 cells the treatments induced significant changes in CDH1 (non-treated 4.2% vs. treated 3.4%; p = 0.0141) and WIF1 (non-treated 16.1% vs. treated 13.1%; p = 0.0435) (Figure 4B). Interestingly, for the hypermethylated genes, changes in methylation levels after treatments were negligible compared to changes in global methylation levels, in both cell lines (Figure 4).
These results show that the demethylation effect of the combined treatments did not induce a strong change in the methylation levels of the hypermethylated genes at the doses used, but have the potential to reduce focal and global methylation levels in both cell lines.
Effect of combined treatments on gene expressionIn order to determine the role of epigenetic alterations on the regulation of the expression of the Wnt/β-catenin pathway antagonists, mRNA levels of these genes were analyzed by qRT-PCR.
There was a statistically significant up-regulation of DKK3, SFRP1 and WIF1 expression after treatments (Figure 5), regardless of gene methylation levels, except for DKK3 in HuH7 cell line (Figure 5B). This behavior was also observed for the hypermethylated gene WIF1 in HepG2 cells (2-fold increase p = 0.0006) and SFRP1 in HuH7 cells (1.4-fold increase p = 0.0024) (Figure 5). CDH1 expression revealed a very interesting pattern; it was substantially up-regulated after the combined treatments (HepG2 18.4-fold and HuH7 5.6-fold), even though the gene was essentially unmethylated. These observations drive us to hypothesize that other epigenetic alterations, like histone acetylation, could be also involved in the control of the Wnt/β-catenin pathway antagonist expression, in particular in the case of CDH1 gene. For these reasons, experiments treating the cells with TSA alone were performed (Figure 5C), where we observed up-regulation of CDH1 expression but a lower level than with the combined regimen.
 and HuH7 cells (B), treated with 5aza-dC and TSA. Quantitative analysis of CDH1 mRNA levels in cells treated with TSA alone (C). mRNA level of each gene were compared between treated (5aza-dC+TSA) and non-treated (DMSO) cells and normalized against GAPDH. NT: non-treated and T: treated. The experiments were performed in triplicate and results correspond to means and the comparison of the differences of the means, between treated and non-treated cells, with 95%% confidence intervals ± SD. p < 0.05 denotes statistical significance. * p < 0.05, ** p < 0.005, *** p < 0.0005, ****p < 0.0001.")
Gene expression levels of the Wnt/β-catenin pathway antagonists after combined treatments with 5aza-dC and TSA. Quantitative analysis of DKK3, SFRP1, WIF1 and CDH1 mRNA levels in HepG2 cells (A) and HuH7 cells (B), treated with 5aza-dC and TSA. Quantitative analysis of CDH1 mRNA levels in cells treated with TSA alone (C). mRNA level of each gene were compared between treated (5aza-dC+TSA) and non-treated (DMSO) cells and normalized against GAPDH. NT: non-treated and T: treated. The experiments were performed in triplicate and results correspond to means and the comparison of the differences of the means, between treated and non-treated cells, with 95%% confidence intervals ± SD. p < 0.05 denotes statistical significance. * p < 0.05, ** p < 0.005, *** p < 0.0005, ****p < 0.0001.
The results suggest that even in the absence of a strong demethylating effect, the epigenetic modifier drugs are able to induce a significant expression of the pathway antagonists.
Effects of the epigenetic modifiers drugs on pathway activityTo establish the effect of the up-regulation of the pathway antagonists, it was looked at the expression of the Wnt/β-catenin target gene c-MYC by qRT-PCR.
As shown in figure 6, treatments induced a significant reduction of c-MYC mRNA levels (HepG2 0.259 fold-decrease, p = 0.0272 and HuH7 0.122 fold-decrease, p = 0.0425). These results suggest that treatments with 5aza-dC and TSA reduced the transcriptional activity of the pathway.
 and nontreated (DMSO) cells and normalized against GAPDH. NT: non-treated and T: treated. The experiments were performed in triplicate and results correspond to means and the comparison of the differences of the means, between treated and non-treated cells, with 95%% confidence intervals ± SD. p < 0.05 denotes statistica significance. *p < 0.05.")
Effects of the epigenetic modifiers drugs on Wnt/β-catenin pathway activity. Quantitative analysis of the Wnt/β-catenin pathway target gene c-MYC mRNA levels in the liver cancer cell lines. mRNA levels of c-MYC gene were compared between treated (5aza-dC+TSA) and nontreated (DMSO) cells and normalized against GAPDH. NT: non-treated and T: treated. The experiments were performed in triplicate and results correspond to means and the comparison of the differences of the means, between treated and non-treated cells, with 95%% confidence intervals ± SD. p < 0.05 denotes statistica significance. *p < 0.05.
As shown above, CDH1 expression after treatments is strongly up-regulated (Figure 5); then, in order to describe the expression and subcellular localization of E-cadherin and β-catenin proteins, confocal microscopy experiments were performed. As shown in figure 7A, in HepG2 cells there is a strong re-localization of β-catenin from the cytoplasmic and nuclear compartments to the cytoplasmic membrane, as well as a reduction in the expression of the protein. Regarding E-cadherin, it was observed a strong up-regulation in the expression of the protein (Figure 7A), which agrees with the qRT-PCR results (Figure 5A). In HuH7 cells, there is colocalization of β-catenin and E-cadherin in the cytoplasmic membrane of the non-treated cells (Figure 7B). After those treatments, upregulation of E-cadherin and down-regulation of β-catenin is observed; likewise, the intensity of the colocalization (yellow staining) was reduced in treated cells, confirming the reduction of β-catenin expression (Figure 7B).
 and HuH7 (B) cell lines. Alexa fluor 555-labeled β-catenin in red, Alexa fluor 488-labeled E-cadherin in green, TO-PRO-3-iodide nuclear staining in blue and the merge between β-catenin and E-cadherin in yellow. The experiments were performed in triplicate.")
Effects of combined treatments on β-catenin and E-cadherin expression and sub-cellular localization. Representative images of immunofluorescence detection of β-catenin and E-cadherin proteins in HepG2 (A) and HuH7 (B) cell lines. Alexa fluor 555-labeled β-catenin in red, Alexa fluor 488-labeled E-cadherin in green, TO-PRO-3-iodide nuclear staining in blue and the merge between β-catenin and E-cadherin in yellow. The experiments were performed in triplicate.
These results suggest that combined treatments induce the decrease of β-catenin levels and increase of E-cadherin expression.
CDH1knock-down counteracts the effects of combined treatments in the modulation of the Wnt/β-catenin pathway transcriptional activityAs shown above, both CDH1 expression levels and E-cadherin protein levels are up-regulated after treatments. Then, in order to demonstrate the functional relevance of the control of E-cadherin to the overall regulation of the Wnt/β-catenin pathway, the expression of c-MYC was evaluated after knock-down of CDH1 (codes for E-cadherin) expression by siRNA. First, we confirmed the knockdown of CDH1 in 5aza-dC and TSA treated (HepG2 0.42 fold-decrease, p = 0.0377 and HuH7 0.8 fold-decrease, p = 0.0005) and non-treated cells (HepG2 0.41 folddecrease, p = 0.0236 and HuH7 0.52 fold-decrease, p = 0.0262) (Figures 8A-B). Secondly, the expression of c-MYC in knocked-down CDH1 cells was measured. As shown, in figures 8C-D, the overall gene expression levels of c-MYC is higher in CDH1 siRNA cells, compared to cells transfected with non-target siRNA, both in HepG2 (non-treated 1.16 fold-increase, p = 0.0006 and treated 1.08 fold-increase, p = 0.088) and HuH7 (non-treated 1.19 fold-increase, p = 0.0543 and treated 1.18 fold-increase, p = 0.2759).
 and HuH7 (B) cell lines, after treatment with 15nM of siRNA non-targeting (siNT) or pool siRNAs against CDH1 (siCDH1). mRNA level of CDH1 gene were compared between treated (5aza-dC+TSA) and non-treated (DMSO) cells and normalized against GAPDH. Quantitative analysis of c-MYC mRNA levels in HepG2 (C) and HuH7 (D) cell lines, after treatment with 15nM of siRNA non-targeting (siNT) or pool siRNAs against CDH1 (siCDH1). mRNA level of c-MYC gene were compared between treated (5aza-dC+TSA) and non-treated (DMSO) cells and normalized against GAPDH. ns: non statistically significant. The experiments were performed in triplicate and results correspond to means and the comparison of the differences of the means, between treated and non-treated cells, with 95°% confidence intervals ± SD. p < 0.05 denotes statistica signifcance. *p < 0.05, **p < 0.005, ***p < 0.0005.")
CDH1 silencing counteracts the effects of the treatment in the regulation of pathway transcriptional activity. Quantitative analysis of CDH1 mRNA levels in HepG2 (A) and HuH7 (B) cell lines, after treatment with 15nM of siRNA non-targeting (siNT) or pool siRNAs against CDH1 (siCDH1). mRNA level of CDH1 gene were compared between treated (5aza-dC+TSA) and non-treated (DMSO) cells and normalized against GAPDH. Quantitative analysis of c-MYC mRNA levels in HepG2 (C) and HuH7 (D) cell lines, after treatment with 15nM of siRNA non-targeting (siNT) or pool siRNAs against CDH1 (siCDH1). mRNA level of c-MYC gene were compared between treated (5aza-dC+TSA) and non-treated (DMSO) cells and normalized against GAPDH. ns: non statistically significant. The experiments were performed in triplicate and results correspond to means and the comparison of the differences of the means, between treated and non-treated cells, with 95°% confidence intervals ± SD. p < 0.05 denotes statistica signifcance. *p < 0.05, **p < 0.005, ***p < 0.0005.
These results suggest that E-cadherin is an important regulator of the Wnt/β-catenin pathway transcriptional activity.
Antitumoral effects of 5aza-dC and TSATo evaluate the antitumoral properties of the treatments with 5aza-dC and TSA, cells were treated at the selected concentrations to perform two tests with different experimental approaches.
First, clonogenic assays were performed to determine the capability of the cells to form colonies. As shown in figures 9A-B, the combined treatments induced a significant 2 to 3-fold decrease in the ability of forming colonies (HepG2 p = 0.0412 and HuH7 p = 0.0025). Similar results were obtained with TSA alone (HepG2 p = 0.0461 and HuH7 p = 0.0018) (Figures 9C-D).
 and untreated (DMSO) HepG2 (A), and HuH7 (B) cell lines. Colony formation of treated (TSA) and untreated (DMSO) HepG2 (C), and HuH7 (D) cell lines. The images were analyzed to quantify the colony area with ImageJ, using the plugin Colony Area.21 The experments were performed in triplicate and results correspond to means and the comparison of the differences of the means, between treated and non-treated cells, with 95%% confidence intervals ± SD. p < 0.05 denotes statistical significance. *p < 0.05, **p < 0.005, ***p < 0.0005.")
Effects of treatments over the clonogenic properties of the liver cancer cell lines. Colony formation of treated (5aza-dC+TSA) and untreated (DMSO) HepG2 (A), and HuH7 (B) cell lines. Colony formation of treated (TSA) and untreated (DMSO) HepG2 (C), and HuH7 (D) cell lines. The images were analyzed to quantify the colony area with ImageJ, using the plugin Colony Area.21 The experments were performed in triplicate and results correspond to means and the comparison of the differences of the means, between treated and non-treated cells, with 95%% confidence intervals ± SD. p < 0.05 denotes statistical significance. *p < 0.05, **p < 0.005, ***p < 0.0005.
On the other hand, wound-healing were done to explore if treatments could influence the migration of the cell lines after an injury stimulus. In the case of HepG2 (Figure 10A), treated and non-treated cells showed significant migration differences (open area, non-treated vs. treated: 61.8% vs. 69%, p = 0.0209). Likewise, HuH7 non-treated cells migrated into the wound faster than treated cells (Figure 10B), leading to wound closure in non-treated cells (open area, non-treated vs treated: 0.7% vs. 10.8%, p = 0.0006). Similar results were obtained with TSA alone in HepG2 (open area, non-treated vs. TSA treated: 76.8% vs. 81.3%, p = 0.0461) and HuH7 cells (open area, non-treated vs. treated: 0% vs. 17.6%, p ≤ 0.0001) (Figures 10C-D).
 and untreated (DMSO) HepG2 (A), HuH7 (B) cell lines. Cell migration behavior of treated (TSA) and untreated (DMSO) HepG2 (C), HuH7 (D) cell lines. The images were analyzed to quantify the wound area (expressed as open area), using an approach of automatic segmentation based on region growing algorithm.22 The experiments were performed in triplicate and results correspond to means and the comparison of the differences of the means, between treated and non-treated cells, with 95%% confidence intervals ± SD. p < 0.05 denotes statistical significance. *p < 0.05, **p < 0.005, ***p < 0.0005.")
Effects of treatments over the migratory properties of the liver cancer cells. Cell migration behavior of treated (5aza-dC+TSA) and untreated (DMSO) HepG2 (A), HuH7 (B) cell lines. Cell migration behavior of treated (TSA) and untreated (DMSO) HepG2 (C), HuH7 (D) cell lines. The images were analyzed to quantify the wound area (expressed as open area), using an approach of automatic segmentation based on region growing algorithm.22 The experiments were performed in triplicate and results correspond to means and the comparison of the differences of the means, between treated and non-treated cells, with 95%% confidence intervals ± SD. p < 0.05 denotes statistical significance. *p < 0.05, **p < 0.005, ***p < 0.0005.
All together, these results suggest that the combination of the epigenetic modifier drugs, reduce the tumoral properties of the cell lines independent of their genetic and epigenetic backgrounds.
DiscussionLike genetic lesions, epigenetic alterations play major roles in cancer development. They may be involved not only in progression, but may also be constituted as the initial mechanism in the carcinogenesis process, favoring the emergence and establishment of genetic alterations, that promotes cell transformation mechanisms.24,25
5aza-dC and TSA combination have been previously used to test its antitumoral properties, showing an important induction of apoptosis and cell proliferation inhibition;26,27 however, higher drugs concentrations were used, when compared with our treatment outline. This is important because low-dose treatment is more similar to the clinical situation, in order to avoid high cytotoxicity rates. Tsai, et al. (2012), shown that demethylating agents at low non-acute toxic doses, decreases DNA methylation of both CpG island and non-CpG island-containing genes, changing gene expression patterns that impact key cellular regulatory pathways.28 But the effects of HDAC inhibitors when used as monotherapy against solid tumors has been disappointing,13 suggesting the need of combinatorial therapies with other epigenetic modifiers drugs and/or chemotherapeutic agents.
In our analysis, it was observed a clear methylation pattern, being WIF1 and SFRP1 hypermethylated in HepG2 and HuH7 cells, respectively. Interestingly, for these genes, the changes in methylation levels after treatments were negligible compared to changes in global methylation levels (Figure 4). The association of Polycomb complexes and/or basic Helix-Loop-Helix transcription factors to WIF1 and SFRP1 promoters, which has been previously involved as negative regulators of drug-induced DNA demethylation,29 could explain these observations.
Remarkably, we observed a significant up-regulation of DKK3, SFRP1 and WIF1 mRNA levels after treatments (Figure 5). Moreover, CDH1 expression was substantially up-regulated, even though the methylation level of the gene prior to treatments was less than 5%. These observations are supported by previous works, showing a stronger effect on the re-expression of the antagonists, with 5aza-dC and TSA combination.30–32 Additionally, recent evidence has pointing out the involvement of 5aza-dC and TSA in the generation of 5-hydroxymethylcytosine,33,34 which has been correlated with increased gene expression levels in the liver.35
Our results drive us to hypothesize that other epigenetic alterations could be also involved in the control of the Wnt/β-catenin pathway antagonist expression in liver cancer cells, particularly in the case of CDH1 gene. To test this hypothesis, we performed experiments treating the cells with TSA alone (Figure 5C), where we observed upregulation of CDH1 expression but a lower level than with combined treatments. In the specific context of CDH1, it is known that Snail mediates the down-regulation of E-cadherin expression by the recruitment of the mSin3A/HDAC1/HDAC2 complex to CDH1 gene promoter.36 Arzumanyan, et al., 2012 showed the recruitment of mSin3A and HDAC1 to CDH1 gene promoter in HepG2 cells. Likewise, they treat the cells with TSA and observed the restoration of histone H3 acetylation and E-cadherin overexpression.37 On the other hand, E-cadherin expression has been shown to be up-regulated by miR-373 in liver cancer.37 Moreover, miR-373 expression has been shown to be controlled by DNA methylation and to be restored by treatment with 5aza-dC along or in combination with TSA.38 These observations, together with our results, support our hypothesis that other epigenetic mechanisms, like histone deacetylation and/or miRNA regulation, are also involved in the control of Wnt/β-catenin pathway antagonist expression.
We report that treatments with 5aza-dC and TSA induce the reduction and/or re-localization of β-catenin and increase of E-cadherin levels (Figure 7). Reduced β-catenin expression following epigenetic modifier drugs treatment,39–41 or by ectopic reconstitution of pathway antagonist proteins10,42 has been reported; as well as β-catenin re-localization from the nuclear compartment to the cytoplasmic membrane.10,41,43 In an interesting paper recently published by Huels, et al. (2015), the authors demonstrated in an in vivo model, that E-cadherin levels in the cell determines the threshold that β-catenin must exceed in order to cause transformation,44 confirming why E-cadherin overexpression interferes with Wnt-dependent gene expression.45
Additionally, it was measured the expression of c-MYC, which has been used as marker of pathway activation in liver cancer.10,42,46 As shown in figure 6, c-MYC expression is significantly reduced in cells after treatments. These results agree with previous reports of lower expression of c-MYC in the presence of Wnt/β-catenin pathway antagonists independent of the cancer model.10,39,40,42,46 Importantly, our results suggest that pathway regulation is mediated by the re-expression of antagonist proteins, like E-cadherin, even in the context of mutations like CTNNB1 gene deletion in HepG2 cells or TP53 point mutations in HuH7 cells, that has been implicated in β -catenin accumulation and Wnt/β-catenin pathway transcriptional activation.14,47 These observations agree with previous reports, which had set out the Wnt/β-catenin pathway regulation when the antagonists are present, even in a pathway activation background;40,42,44,48 these findings can be explained by the fact that E-cadherin has the ability to sequester both wild-type and mutant β-catenin, whereby homozygous loss of function of APC and/or homozygous activating mutations in CTNNB1 gene are needed to overcome the threshold established by E-cadherin, in order to drive pathway activation.44
As shown above, E-cadherin expression after treatments is strongly up-regulated, both at mRNA (Figure 5) and protein levels (Figure 7). Then, to demonstrate the relevance of E-cadherin in pathway regulation, we looked at the expression of c-MYC, after knocking-down CDH1 expression. Our results suggest that E-cadherin is an important regulator of the Wnt/β-catenin pathway transcriptional activity, since in cells exposed to CDH1 siRNA, c-MYC expression is higher (Figure 8). Several reports support these observations, confirming the key role of E-cadherin in pathway regulation.43,45,49 In the specific context of liver cancer, E-cadherin repression has been suggested as a critical event during cancer development, since it has been observed the silencing of CDH1 expression by epigenetic mechanisms mediated by hepatitis B and hepatitis C virus.37,50 Likewise, in HCC it has been reported a significant negative correlation of E-cadherin with several Wnt target genes,44 highlighting that not only β-catenin alterations, but also E-cadherin alterations, are critical for Wnt/β-catenin pathway activation and tumor transformation.
Finally, to explore the functional effects of the Wnt/β-catenin pathway regulation by 5aza-dC and TSA, clonogenic and wound healing assays were performed. As shown in figures 9 and 10, the migratory and clonogenic capabilities of the cells were reduced with treatments. These observations, supports the potential of 5aza-dC and TSA to reduce the tumoral properties of the cells, through the up-regulation of E-cadherin that leads to the modulation of the canonical Wnt/β-catenin pathway in liver cancer cell lines with different genetic and epigenetic backgrounds.
ConclusionsThe development of epigenetic modifiers drugs, like 5aza-dC and TSA, that target specific chromatin regulator proteins involved in the establishment of epigenetic alterations, has become a principal concern in cancer research. In our study, we showed the potential of the combination of these epigenetic modifier drugs to modulate the canonical Wnt/β-catenin pathway in epithelial-derived hepatoma cell lines with different genetic and epigenetic backgrounds through the up-regulation of E-cadherin, reducing the tumoral properties of the cells. These observations are important because we were able to modulate pathway activity, without ectopic expression of antagonist proteins and/or the use of specific pathway inhibitors, even in a pathway activation background. However, further research needs to be conducted, particularly in preclinical in vivo models to determine the potential of this treatment regimen for the management of liver cancer.
Abbreviations- •
5aza-dC: 5-aza-2’-deoxycytidine.
- •
CDH1: cadherin-1.
- •
c-MYC: v-myc avian myelocytomatosis viral oncogene homolog.
- •
CTNNB1: catenin, cadherin-associated protein, beta 1.
- •
DKK3: dickkopfWNT signaling pathway inhibitor-3.
- •
DMSO: dimethyl sulfoxide.
- •
DNMTs: DNA methyltransferases.
- •
HCC: hepatocellular carcinoma.
- •
HDACs: histone deacetylases.
- •
mRNA: messenger RNA.
- •
qRT-PCR: quantitative real-time PCR.
- •
SFRP1: secreted frizzled-related protein-1.
- •
TP53: tumor protein p53.
- •
TSA: trichostatin A.
- •
WIF1 : WNT inhibitory factor-1.
This work was supported by grant P10242 from “Dirección de Investigaciones, Instituto Tecnológico Metropolitano”, grant E1740 from “Estrategia para la Sostenibilidad 2013-2014, Universidad de Antioquia.” D. Uribe received a doctorate scholarship from the Colombian Government “Departamento Administrativo de Ciencia, Tecnología e Innovación-Colciencias” and from the International Agency for Research on Cancer (IARC), during an internship in the Epigenetics Group of the IARC (Lyon-France).


