


Graft failure and postoperative mortality are the most serious complications after liver transplantation. The aim of this study is to establish a prognostic scoring system to predict graft and patient survival based on serum transaminases levels that are routinely used during the postoperative period in human cadaveric liver transplants.
Patients and methodsPostoperative graft failure and patient mortality after liver transplant were analyzed from a consecutive series of 1299 patients undergoing cadaveric liver transplantation. This was correlated with serum liver function tests and the rate of reduction in transaminase levels over the first postoperative week. A cut-off transaminase level correlating with graft and patient survival was calculated and incorporated into a scoring system.
ResultsAspartate-aminotransferase (AST) on postoperative day one showed significant correlation with early graft failure for levels above 723U/dl and early postoperative mortality for levels above 750U/dl. AST reduction rate (day 1 to 3) greater than 1.8 correlated with reduced graft failure and greater than 2 with mortality. Alanine-aminotransferase (ALT) reduction in the first 48h post transplantation also correlated with outcomes.
ConclusionA scoring system with these three variables allowed us to classify our patients into three groups of risk for early graft failure and mortality.
Liver function tests are carried out routinely following liver transplantation and are used as a marker of liver damage following preservation and peri-operative ischaemia reperfusion (IR) injury [1]. The shortage of organs for transplant and the increasing use of marginal grafts including donors after circulatory death (DCD) organs have resulted in an increased incidence of IR injury and poor initial graft function [2]. Prognostic markers of early graft function have therefore become increasingly important to allow risk stratification for postoperative management. In addition the increasing use of marginal grafts has led to a focus on new methods of graft preservation such as hypothermic [3,4] and normothermic [5–7] machine perfusion and extracorporeal membrane oxygenation ECMO [8]. The introduction of these methods into clinical practice requires clear evidence that they reduce organ preservation injury, improve early graft function, reduce postoperative complications and improve outcome.
The aspartate-aminotransferase (AST) level following liver transplant has been shown to correlate with graft survival in experimental models of liver transplant [9] and our group has recently correlated early post-transplant serum transaminase levels with the incidence of post-transplant complications and the early graft and patient survival [10]. Gaffey and colleagues demonstrated that graft preservation injury assessed on a post reperfusion liver biopsy correlated with the level of serum transaminases in the postoperative blood tests but in this study serum transaminase levels were not able to predict the presence or absence of reperfusion injury on an individual patient basis [1].
Many studies have analyzed factors associated with initial poor graft function or primary non-function and have suggested that serum transaminases are good indicators of reperfusion injury [1,11,12]. Furthermore, transaminase level have been used and validated as an endpoint for the definition of early graft dysfunction [13]. However no studies have produced a clinically useful algorithm to allow the routinely available post-transplant serum transaminase levels to be used to predict early graft and patient survival [14–16].
The aim of this study was to develop a clinically useful scoring system that can identify patients at high risk of early graft dysfunction and postoperative mortality by analysis of routine postoperative liver function tests and outcome in a large, single centre cohort of patients undergoing liver transplant.
2Materials and methodsWe retrospectively analyzed the consecutive series of patients undergoing liver transplantation at the Royal Free Hospital from October 1988 to March 2012. Data on the donors, the retrieval procedure, organ preservation, recipient characteristics and post transplant outcomes was retrieved from the database for analysis.
2.1Donors’ characteristicsCollected data included donor sex and age, donor intensive treatment unit (ITU) stay, inotrope requirements, donation after circulatory or brain death (DCD/DBD), cause of death, graft quality reported by the retrieval team (subjective assessment after inspection and classified as healthy, mildly fatty, moderately fatty or severely fatty), warm and cold ischaemia times and type of perfusion fluid used.
2.2Retrieval process and graft benchworkAs per national protocol, organ harvesting takes place by retrieval teams from specialized centres. Retrograde cannulation and perfusion of the liver graft via the infra-renal aorta or iliac arteries is the standard retrieval approach. Additional cannulation and perfusion via the portal vein is commonly performed. University of Wisconsin (UW) solution is the perfusion fluid used as per national protocol and cold storage in ice has been the standard technique in this series. More novel techniques including normothermic perfusion or ECMO are not included in the current data. Warm ischaemia time (WIT) and cold ischaemia time (CIT) were included in the analysis. WIT is the time from cessation of blood perfusion to the organ to the start of cold perfusion. This time differs between DBDs (time from aortic clamping to cold perfusion) and DCDs (time from donors systolic blood pressure is below 50mmHg and/or oxygen saturation below 70% to cold perfusion). CIT is the time from the start of the cold perfusion of the donor organ to the time of warm blood reperfusion in the recipient for both DBD and DCD.
Graft benchwork was always performed by the implantation team under cold preservation solution and considered as part of the CIT. UW solution was washed out with human albumin solution (5% HAS) either during the bench work or prior to the graft reperfusion in the recipient.
2.3Recipients’ characteristicsPatients’ demographics included age, gender, body mass index (BMI), co-morbidities and liver diseases (main and secondary diagnosis). MELD and UKELD scores were calculated.
2.4Transplantation techniqueType of implantation, surgical technique and intraoperative events were recorded. Both piggy-back technique and cava replacement technique are routinely used and whole liver grafts, split grafts and reduced size grafts were included. Types of biliary reconstruction have also been documented.
2.5Postoperative managementAll patients underwent intensive clinical review in the early postoperative period along with regular assessment of systemic haemodynamics, drain outputs, inotrope requirements, ventilatory support and urine output. Requirement of renal replacement therapy (whether required or not) was recorded as a variable, as well as serum creatinine levels. Days in ITU and days ventilated were also recorded.
Daily bloods samples were obtained to monitor full blood count, liver function, renal function and clotting screening.
2.6Early graft failure and mortalityGraft failure within 30 days was considered as the lack of function of the implanted liver that resulted in re-transplantation or death. National criteria for retransplantation establish primary non function if two of the following criteria are present: AST>10,000, INR>3.0, arterial lactate>3mmol/l, and absence of bile production [17]. Postoperative 30 day patient mortality was recorded along with cause of death.
2.7Statistical analysisDonors’ and recipients’ variables as outlined were correlated with the main dependent variables, graft failure and mortality within 30 days post-transplant. Dichotomous categorical variables were examined for correlation with the aforementioned outcomes using Fisher's exact test. Categorical variables with more than two groups were examined using the chi square test. Medians of scale variables were compared across early graft failure and early mortality using the Mann–Whitney U test. Those variables that demonstrated statistically significant correlation in unifactorial analysis were further assessed in multifactorial analysis using logistic regression. A p value less than 0.05 were considered statistically significant. Two-tailed comparisons were consistently used where applicable.
Levels of AST and ALT on a daily basis for the first postoperative week were individually correlated with the dependant variables individually. In addition to correlating levels of individual liver function tests with outcome, we also investigated the significance of the trend in sequential post-operative transaminase levels using the following analysis:
- •
Peak transaminases levels on postoperative day one (POD1).
- •
Early rate of AST reduction (ASTRed1): AST levels on POD1 divided by AST levels on POD3).
- •
Late rate of AST reduction (ASTRed2): AST levels on POD1 divided by AST levels on POD7).
- •
ALT3dir is the ALT levels’ direction on POD 3 (increase vs. decrease), which was identified on bar charts as a potential predictor of outcomes and was included as an independent variable.
Classification analysis was conducted for scale predictors that demonstrated statistically significant correlation (p<0.05) in multifactorial analysis. In order to produce two groups per predictor, as the simplest classification output, a cut-off value was determined using ROC curve with regards to each outcome. Cut-off values were chosen as the value with the equal-most Sensitivity and Specificity. The created categories were assessed for statistically significant correlation with the respective outcomes.
2.8Scoring systemThose variables that demonstrated statistical correlation (p<0.05) in the multivariate analysis were included in the scoring system, with 0 points assigned to the favourable group (AST1<cut-off point, ASTRed1>cut-off point and ALT3 decrease) and 1 point assigned to the non-favourable group (AST1>cut-off point, ASTRed1<cut-off point and ALT3 increase). Overall score was calculated by the sum of predictors’ points.
Statistical processing of data was conducted using SPSS v20 software (IBM Corporation, USA).
3ResultsA total of 1299 consecutive patients undergoing liver transplant at the Royal Free Hospital in London, UK were included in the analysis.
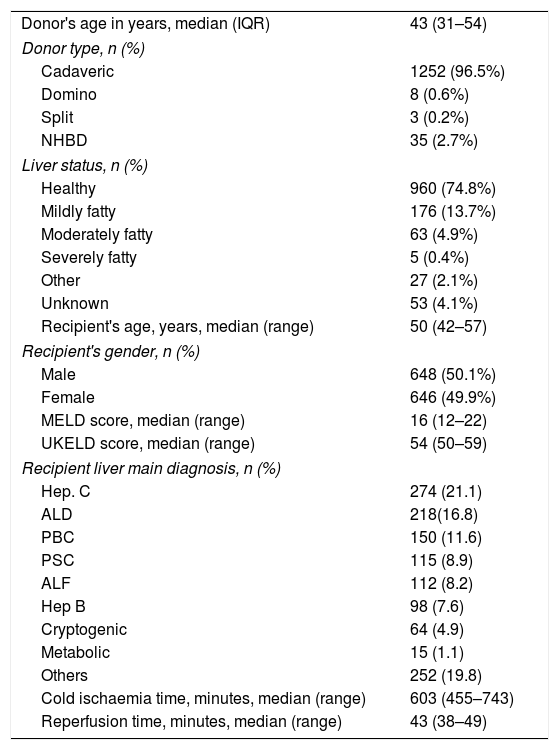
3.1DonorsMain epidemiological data on donors is summarized in Table 1. Equal distribution is observed in terms of gender. The median age of the donors was 43 years. Main characteristics of grafts and ischaemia time are documented in Table 2.
Donors’ and recipients’ characteristics.
| Donor's age in years, median (IQR) | 43 (31–54) |
| Donor type, n (%) | |
| Cadaveric | 1252 (96.5%) |
| Domino | 8 (0.6%) |
| Split | 3 (0.2%) |
| NHBD | 35 (2.7%) |
| Liver status, n (%) | |
| Healthy | 960 (74.8%) |
| Mildly fatty | 176 (13.7%) |
| Moderately fatty | 63 (4.9%) |
| Severely fatty | 5 (0.4%) |
| Other | 27 (2.1%) |
| Unknown | 53 (4.1%) |
| Recipient's age, years, median (range) | 50 (42–57) |
| Recipient's gender, n (%) | |
| Male | 648 (50.1%) |
| Female | 646 (49.9%) |
| MELD score, median (range) | 16 (12–22) |
| UKELD score, median (range) | 54 (50–59) |
| Recipient liver main diagnosis, n (%) | |
| Hep. C | 274 (21.1) |
| ALD | 218(16.8) |
| PBC | 150 (11.6) |
| PSC | 115 (8.9) |
| ALF | 112 (8.2) |
| Hep B | 98 (7.6) |
| Cryptogenic | 64 (4.9) |
| Metabolic | 15 (1.1) |
| Others | 252 (19.8) |
| Cold ischaemia time, minutes, median (range) | 603 (455–743) |
| Reperfusion time, minutes, median (range) | 43 (38–49) |
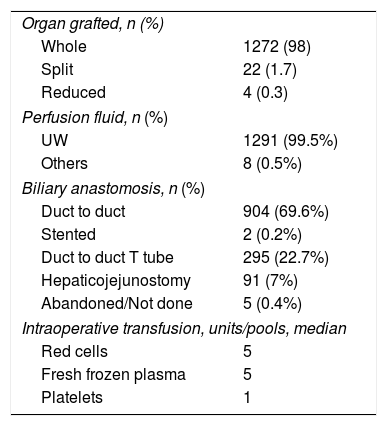
Transplantation procedure characteristics.
| Organ grafted, n (%) | |
| Whole | 1272 (98) |
| Split | 22 (1.7) |
| Reduced | 4 (0.3) |
| Perfusion fluid, n (%) | |
| UW | 1291 (99.5%) |
| Others | 8 (0.5%) |
| Biliary anastomosis, n (%) | |
| Duct to duct | 904 (69.6%) |
| Stented | 2 (0.2%) |
| Duct to duct T tube | 295 (22.7%) |
| Hepaticojejunostomy | 91 (7%) |
| Abandoned/Not done | 5 (0.4%) |
| Intraoperative transfusion, units/pools, median | |
| Red cells | 5 |
| Fresh frozen plasma | 5 |
| Platelets | 1 |
The median age of the recipients was 50 years (interquartile range [IQR] 42–57). The main indication for transplantation was hepatitis C related cirrhosis followed by alcoholic liver disease. Together these represented 38% of the series (Table 1).
Cava replacement has been the most common technique used for whole graft liver implantation (717 cases, 55.2%). The bile duct reconstruction most commonly used was end-to-end choledocho-choledochal anastomosis without the use of stents (904 cases 69.6%) or with T tubes (295 cases, 22.7%).
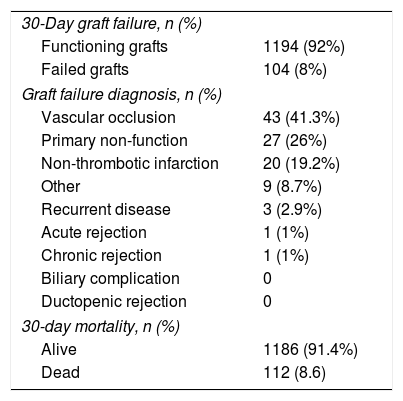
3.3Postoperative outcomes. Graft and patient survivalTable 3 summarizes main postoperative outcomes in terms of 30-day mortality and graft failure. Overall there was an 8.6% mortality and an 8% rate of graft failure. Vascular occlusion was the main reason for graft loss (41.3%), the vast majority (96%) being hepatic artery thrombosis (HAT) followed by portal vein thrombosis (4%).
Main postoperative outcomes.
| 30-Day graft failure, n (%) | |
| Functioning grafts | 1194 (92%) |
| Failed grafts | 104 (8%) |
| Graft failure diagnosis, n (%) | |
| Vascular occlusion | 43 (41.3%) |
| Primary non-function | 27 (26%) |
| Non-thrombotic infarction | 20 (19.2%) |
| Other | 9 (8.7%) |
| Recurrent disease | 3 (2.9%) |
| Acute rejection | 1 (1%) |
| Chronic rejection | 1 (1%) |
| Biliary complication | 0 |
| Ductopenic rejection | 0 |
| 30-day mortality, n (%) | |
| Alive | 1186 (91.4%) |
| Dead | 112 (8.6) |
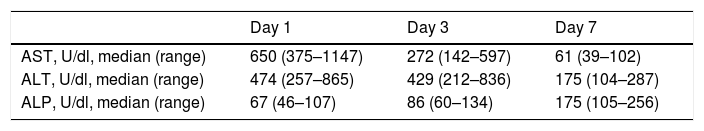
Generally there was a peak of AST and ALT on POD1 followed by a progressive reduction with AST reducing before ALT. ALP showed an overall increase in levels during the first postoperative week (Table 4).
1. Postoperative 30-day graft failure/early graft failure (EGF).
Comparing transaminase levels between patients with and without EGF showed that those developing EGF had higher AST and ALT levels overall on the studied days (POD 1, 3, 5, and 7). Failed grafts had rising ALT levels on day 3 whereas functioning grafts had a decreasing ALT. Alkaline Phosphatase levels increased over the first week independent of subsequent graft function. Regarding the new estimated variables (AST reduction 1), EGF group demonstrates lower reduction rates compared to the non-EGF group.
Multivariate analysis of these independent variables (Fig. 1) demonstrated a significant correlation between EGF and AST1, AST7, ALT7, ALP3, ASTred1 and ALT3dir (p<0.05). Subsequent analysis of these variables by ROC-curve analysis identified a cut-off value for the optimal sensitivity and specificity to predict EGF for all these predictors and the variables were categorized in two groups based on that value (Fig. 2).
 and AST reduction rate 2 (POD7 versus POD1).")
Postoperative liver enzymes trend and comparison between EGF group and Functioning Graft Group. Black: EGF group. Grey: functioning graft group. A: AST levels on POD1, POD3 and POD7 B: ALT levels on POD1, POD3 and POD7. C: ALP levels on POD1, POD3 and POD7D: AST reduction rate 1 (POD3 versus POD1) and AST reduction rate 2 (POD7 versus POD1).
 in the multivariate analysis. A: AST1; B: AST7; C: ALT7; D: ALP3; E: ASTred1.")
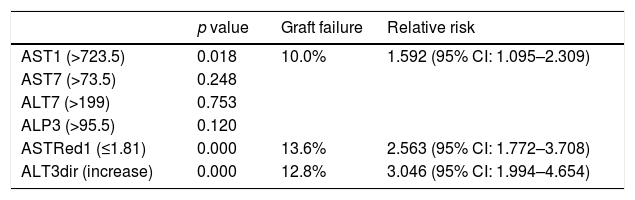
Further multivariate analysis of the categorized variables confirmed statistical significance for AST1, ASTRed1 and ALTdir for EGF. Being the cut-off point for AST1, 723U/dl (relative risk (RR) 1.592 (95% CI: 1.095–2.309) p=0.018) and the cut-off point for ASTRed1 1.81 (RR 2.563 (95% CI: 1.772–3.708), p<0.001) (Table 5). The association between the optimal cut off levels for the transaminases and the risk of graft failure is shown in Fig. 3 and Table 5.
Transaminase measures and incidence of graft failure for those statistically significant.
| p value | Graft failure | Relative risk | |
|---|---|---|---|
| AST1 (>723.5) | 0.018 | 10.0% | 1.592 (95% CI: 1.095–2.309) |
| AST7 (>73.5) | 0.248 | ||
| ALT7 (>199) | 0.753 | ||
| ALP3 (>95.5) | 0.120 | ||
| ASTRed1 (≤1.81) | 0.000 | 13.6% | 2.563 (95% CI: 1.772–3.708) |
| ALT3dir (increase) | 0.000 | 12.8% | 3.046 (95% CI: 1.994–4.654) |

EGF comparison for the categorized groups. Percentages of failed grafts. Comparison between the new categorized variables based on the estimated cut-off value. A: AST1>723.5 vs AST1<=723.5. B: AST7>73.5 vs AST7<=73.5. C: ALT7>199 vs ALT7<=199. D: ALP3>95.5 vs ALP3<=95.5. E: ASTRed1>1.81 vs ASTRed1<=1.81. F: ALT3 decrease vs ALT3 increase.
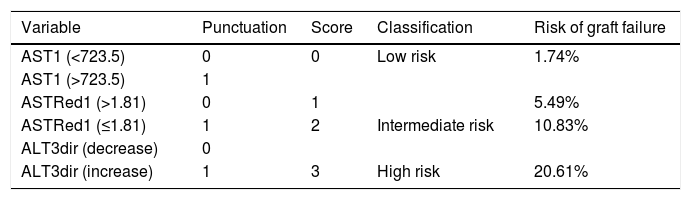
As a result of this categorization a scoring system was developed in which 1 point was allocated to poor prognosis measurements for any individual recipient. Based on this, a classification system for predicting EGF can be structured, which would have 3 categories with associated outcomes as shown in Table 6 and Fig. 4.
Suggested scoring, clinical significance and interpretation for 30-day graft failure. p=0.000 (regarding correlation of scoring and EGF).
| Variable | Punctuation | Score | Classification | Risk of graft failure |
|---|---|---|---|---|
| AST1 (<723.5) | 0 | 0 | Low risk | 1.74% |
| AST1 (>723.5) | 1 | |||
| ASTRed1 (>1.81) | 0 | 1 | 5.49% | |
| ASTRed1 (≤1.81) | 1 | 2 | Intermediate risk | 10.83% |
| ALT3dir (decrease) | 0 | |||
| ALT3dir (increase) | 1 | 3 | High risk | 20.61% |

2. Postoperative 30-day mortality/Early postoperative mortality (EPM):
Similar results to EGF were observed in the trend of the transaminases levels when 30-day mortality is analyzed. However AST levels were higher in those with EPM than EGF. ALT levels showed an increase on day 3 compared with day 1 levels and the early AST reduction rate (ASTRed1) is lower in the group of EPM.
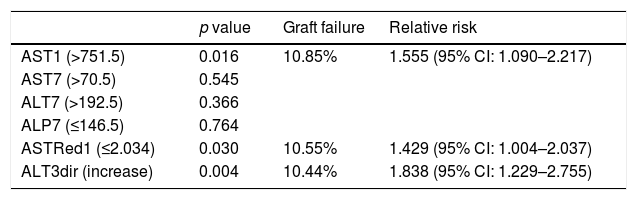
After bivariate and multivariate analysis, AST1, AST7, ALP7, ASTRed1 and ALT3Dir showed significant correlation with EPM (Fig. 5). A categorization of these variables was carried out based on the cut-off point obtained from the ROC-curve (Fig. 6), the final relative risk analysis confirmed again the relevance of AST1, ASTRed1 and ALT3Dir. Being, on this occasion, the cut-off value for AST1 751U/dl and 2.03 the ASTRed1 rate (Table 7 and Fig. 7).
 and AST reduction rate 2 (POD7 versus POD1).")
Postoperative liver enzimes trend and comparison between EPM group and alive patients’ group. Black: EPM group. Grey: alives group. A: AST levels on POD1, POD3 and POD7. B: ALT levels on POD1, POD3 and POD7. C: ALP levels on POD1, POD3 and POD7. D: AST reduction rate 1 (POD3 versus POD1) and AST reduction rate 2 (POD7 versus POD1).
 in the multivariate analysis. A: AST1; B: AST7; C: ALT7; D: ALP7; E: ASTred1.")
Statistical significance of categorized predictors, respective mortality rates and relative risks.
| p value | Graft failure | Relative risk | |
|---|---|---|---|
| AST1 (>751.5) | 0.016 | 10.85% | 1.555 (95% CI: 1.090–2.217) |
| AST7 (>70.5) | 0.545 | ||
| ALT7 (>192.5) | 0.366 | ||
| ALP7 (≤146.5) | 0.764 | ||
| ASTRed1 (≤2.034) | 0.030 | 10.55% | 1.429 (95% CI: 1.004–2.037) |
| ALT3dir (increase) | 0.004 | 10.44% | 1.838 (95% CI: 1.229–2.755) |

EPM comparison for the categorized groups. Percentages of EPM. Comparison between the new categorized variables based on the estimated cut-off value. A: AST1>751.5 vs AST1<=751.5. B: AST7>70.5 vs AST7<=70.5. C: ALT7>192.5 vs ALT7<=192.5. D: ALP7>146.5 vs ALP7<=146.5. E: ASTRed1>2.034 vs ASTRed1<=2.034. F: ALT3 decrease vs ALT3 increase.
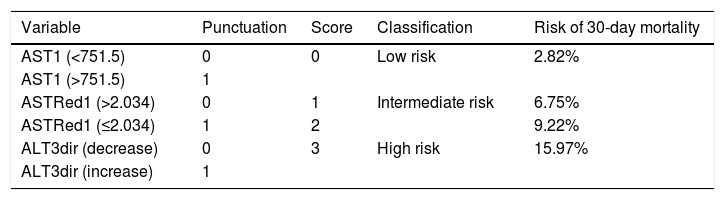
As a result of this categorization a scoring system was developed in which 1 point was allocated to each poor prognosis measurements. For any individual recipient we could then suggest a risk of EPM based on 3 categories with associated outcomes as shown in Table 8 and Fig. 8.
Suggested scoring, clinical significance and interpretation for 30-day mortality. p=0.000 (regarding correlation of score with 30-day mortality).
| Variable | Punctuation | Score | Classification | Risk of 30-day mortality |
|---|---|---|---|---|
| AST1 (<751.5) | 0 | 0 | Low risk | 2.82% |
| AST1 (>751.5) | 1 | |||
| ASTRed1 (>2.034) | 0 | 1 | Intermediate risk | 6.75% |
| ASTRed1 (≤2.034) | 1 | 2 | 9.22% | |
| ALT3dir (decrease) | 0 | 3 | High risk | 15.97% |
| ALT3dir (increase) | 1 |

This study developed a clinically relevant scoring system for predicting graft and patient survival following liver transplantation based on routinely performed liver function tests. There have been many previous attempts to predict early graft function based on routine laboratory parameters. Despite this no clinically useful scoring systems have been achieved. The previous studies have, however, also demonstrated that the initial peak of AST correlates with the severity of IR injury but these studies have failed to correlate this with patients and graft survival using a static observation of AST levels and a retrospective assessment of IRI [1,6,11,12,18,19]. Olthoff and colleagues validated previous definitions of early allograft dysfunction based on transaminases levels [13]. The aim of that study was however the validation of a definition that could be used as endpoint in future trials and not for clinical application. We understand the result of our analysis is potentially useful in clinical practice and in comparison with the definition by Olthoff et al., it can identify patients at risk of mortality and graft failure on postoperative day 2 versus postoperative day 7 [13].
This analysis reassures that exclusive assessment of the net number of transaminases levels, despite being AST1 and AST3 independent prognosis factor, results insufficient for the global evaluation of the graft function, specially nowadays when the use of extended criteria donors is expanding and hence the accepted risk of more severe IR injury [10].
Variables used in this scoring system are the “Maximum” level of AST on postoperative day 1, its “Reduction” rate in the following 48h and whether ALT is increasing or decreasing on postoperative day 3 (“Direction”): The “MaDiRe” test (maximum, direction and reduction of liver function tests). These were selected following analysis of a wide variety of potential predictors included in the routine post-transplant blood tests.
The prognostic significance of AST levels on postoperative day 1 have been reported by others [11,12,18,19] whereas the other two variables included in our prognostic scoring system (ASTRed1 and ALTDir) have not previously been identified as independent predictors of graft and patient survival following liver transplantation. After the initial peak of transaminases on day 1 a reduction of the levels AST to around half of the initial value (ASTRed1>2.034 and ASTRed1>1.8) and the simple reductions of the levels of ALT (ALTdir) are independent good prognostic factors for graft failure and mortality. These parameters represent the dynamic changes in transaminase levels after liver transplantation and are likely to reflect the grafts ability to recover from preservation and IR injury at implantation. They highlight the importance of sequential changes in transaminases as indicators of recovery of graft function or the development of EGF and EPM.
The importance in the sequential changes in the transaminase levels as important predictive factors to outcome (ASTRed1 and ALT3Dir) have important clinical implications as a rapid AST reduction may herald a good prognosis even on the background of an initial high AST value. As an example, a graft with an AST1 of 3.000U/dl would be considered by some clinical criteria as indicative of primary non-function. However, based on the proposed scoring system the initial AST value would represent only one aspect of the scoring system and with a, favourable ASTRed1 and ALTDir, the patient would be classified as low risk for EGF and EPM.
Other scoring models have demonstrated a correlation between EGF, bilirubin levels and MELD scores [16]. However this is limited in value as the MELD score includes bilirubin level as a predictor [20]. Also creatinine levels and the use of clotting supportive therapy may act as confounding factors [21]. Additionally this model did not include preoperative recipient's and donor's factors that may also modify MELD score and bilirubin levels in postoperative day 1 [21]. In this same line some studies have suggested the prognostic value of factor V levels on postoperative days 2 and 5 [22,23]. However, factor V levels are not routinely used in most transplant centres.
The majority of prognostic models based on routine postoperative blood tests have included a measure of the livers ability to synthesize clotting factors as measured by the prothrombin time (PT). However the use of PT has a major limitation as the level is reduced by the postoperative administration of fresh frozen plasma for correction of bleeding or coagulopathy in the early postoperative period [6,11,12,18,19].
An alternative to blood tests to determine graft and patient survival following liver transplant, is the use of Dynamic Liver Function Tests such as the LiMAx test (maximal enzymatic liver function capacity). However LiMax is not routinely available and its measurement is modified by the use of inotropes. In addition it has not been found to be reliable in the diagnosis of postoperative vascular events, a principal cause of graft failure and patient mortality. In this sense, the original published data has not been subsequently reproduced [24].
In addition to the ease of use of our suggested prognostic scoring system the timing of its application is important. A scoring system which is dependent on multiple laboratory tests taking until the end of the first postoperative week is not going to be useful as a basis for implementing change in clinical management, the fundamental requirement of a prognostic scoring system [12,25,26]. Our prognostic model, the MaDiRe Test, can be calculated on the morning of the 3rd postoperative day (48–72h post-transplant). This will allow intensive investigation for a cause of acute graft dysfunction, which may not have been apparent clinically and will allow early medical and surgical intervention for major postoperative complications including a change to immunosuppression, anticoagulation and antibiotic therapy. Early recognition of patients at risk is the starting point in prevention of any complications leading to graft dysfunction. The MaDiRe Test can be rapidly applied in all patients on a routine basis, to increase awareness on higher likelihood for adverse outcomes.
Though usefulness needs to be proved, a scoring system represents a simplified depiction of biological events. Selection of certain factors may omit some others. Classification of scaled variables confers a risk of missing statistically significant correlations or “inventing” one without clinical relevance.
Besides, there is no established method for determining cut-off values, and each available approach carries advantages and disadvantages. However, the above limitations are accepted with a view to create an easy to assess and simple to apply scoring system. To overcome these limitations and the potential errors the proposed scoring system may carry, further studies to validate it in independent samples/populations is strongly advised. Once validated it may represent a very useful and reproducible tool for early assessment of patients at risk of 30-day graft failure and 30-day mortality
Relevance of the early classification is that some strategies of the current practice can be modified in order to avoid these life-threatening complications. Closer monitoring of the liver flow, septic screening and/or modification on the anticoagulation or immunosuppressant regimen for those patients at risk may reduce the progression of a vascular occlusion or early rejection, which may lead to the graft and/or patient loss.
5ConclusionAs a conclusion, AST1, ALT3dir and ASTRed1 can be used as early predictors for assessment of risk of EGF and EPM. The combination of these tests can produce a simple system based on routine tests. Once validated in another data set, it can help in classifying patients in different risk groups.
Conflict of interestThe authors have no conflicts of interest to declare.


