


Vitamin D plays a role in the immune system, however studies regarding this are scarce. This study aimed to evaluate the nutritional status of vitamin D in patients with Common Variable Immunodeficiency (CVID) or Ataxia–Telangiectasia (A–T) and to relate it to body composition, inflammatory and bone metabolism markers.
Patients and methodsThis is a cross-sectional and controlled study involving 24 patients of both sexes (59.3% male), aged 8–56 years, with CVID (n=15) or A–T (n=9). The following variables were evaluated: body mass index (BMI), 25-hydroxyvitamin D (25 (OH) D), hepatic profile, parathormone, calcium, phosphorus, alkaline phosphatase, interleukin 6 and high-sensitivity C-reactive protein.
ResultsThe median age was 26.0 years. A deficiency of 25 (OH) D was found in four A–T patients (44%) and two CVID patients (13%). Nine patients with CVI (60%) and six with A–T (66.7%) were overweight and underweight, respectively. There was a negative correlation between vitamin D and fat mass in the CVID group, and vitamin D and BMI in the A–T group. Vitamin D was negatively associated with the percentage of total fat among the patients (β – 0.842, 95% CI: −1.5–0.17, p=0.015), R2=0.21, after adjusting for sex and age.
ConclusionVitamin D deficiency occurred in a quarter of the patients although there was no difference between the patient and the control group; without association with bone and inflammation biomarkers. The percentage of fat and BMI were negatively associated with the concentrations of 25 (OH) D.
Primary Immunodeficiencies (PID) are a group of rare diseases, characterized by defects in B and T cells, affecting humoral immunity and specific cellular response, in addition to defects in cytokine or cytokine signaling pathways, defects in phagocytosis, and complement defects.1,2
Common Variable Immunodeficiency (CVID) is the second most common primary immunodeficiency after IgA deficiency. The prevalence of CVID in the world is approximately 1:25,000–50,000 people.2 The disease is characterized by hypogammaglobulinemia, reduced serum immunoglobulin concentrations, and other changes in the immune response, which comprise the functions of differentiation and activation of B and T lymphocytes. These patients have recurrent infections (mostly respiratory and/or enteric).3,4
Ataxia–telangiectasia (A–T) is an autosomal recessive neurodegenerative disease that progresses with ataxia, telangiectasia, variable degrees of immunodeficiency, decreased immunoglobulins subclasses, pulmonary infections, mitochondrial dysfunction, exacerbation of oxidative stress, and increased risk for the development of diabetes and dyslipidemias.5 The disease results from mutations in the ataxia–telangiectasia mutated (ATM) gene, responsible for the activation of hundreds of proteins involved in DNA damage repair and cell cycle regulation. The estimated prevalence is one per 100,000 live births.6
Studies on vitamin D have become frequent in the general population, with publications highlighting its high deficiency prevalence in several countries, including Brazil. At the same time, studies emphasize the role of vitamin D in several functions other than bone-related, such as the modulation of the immune system, adipogenesis, control of the proliferation of tumor cells and activities in the cardiovascular system.7 In the immune system, its functions include the modulation of macrophages, monocytes, dendritic cells and B and T cells.8 It should be emphasized that the literature addressing vitamin D in patients with CVID and A–T is scarce. It can be justified since they are rare diseases, besides, only in recent years has vitamin D started to be considered crucial for the immune system proper function. Most studies on this population have only assessed vitamin D status, not relating it to genetic mutations, body composition nor phototype investigation.9–11
This study aimed to evaluate the vitamin D blood levels of patients with CVID and A–T, relating them to body composition, inflammatory and bone metabolism markers.
Material and methodsIn a cross-sectional controlled study, carried out from March to September 2016, we evaluated 24 patients of both sexes (59.3% male), aged 8–56 years, with CVID (n=15) or A–T (n=9), based on the diagnostic criteria of the European Society for Immunodeficiency (ESID).12 All patients received regular treatment with intravenous immunoglobulin.
The control group consisted of 24 healthy individuals, from the city of Sao Paulo – Brazil, paired with patients by age and sex.
At the time of sample collection, none of the subjects presented with acute infection, vitamin supplementation or had used steroids for at least three months.
The study was approved by the Research Ethics Committee of the Federal University of São Paulo. Informed consent was obtained from all the subjects and those responsible. None of the participants in the study had their personal data exposed. All participants received the results of their exams; and, in the case of abnormal results, the participant was referred to treatment.
Data collectionThe sociodemographic-clinical characteristics data collected were sex, age, pubertal staging, income and sunscreen use using a structured and standardized questionnaire.
Clinical assessment was performed through physical examination, including pubertal staging of adolescents (method proposed by Tanner),13,14 anthropometric exam15 and level of physical activity evaluated by the IPAQ (International Physical Activity Questionnaire) short version.16 The nutritional status was evaluated using the body mass index (BMI)15,17 and body fat mass percentage.18–20
For the pediatric population on the study, the body fat mass percentage was determined by the equation proposed by SLAUGHTER (1988), using the sum of tricipital and subscapular skinfolds, and later classified according to that proposed by DEURENBERG (1990).18,19
For the adult population the body fat mass percentage was determined by the sum of the four skinfolds (triceps, subscapular, bicipital and suprailiac) and classified according to LOHMAN (1992).20
Waist-to-height ratio (WHR),21 fat body mass (kg) and lean body mass (kg) were calculated for all subjects.
Patients with A–T who were unable to remain in the supine position had their weight measured on a scale for wheelchair users and the height obtained in a recumbent position, with patients lying flat and firm, with inextensible tape scaled in millimeters.
Laboratory assessmentAn aliquot of 20mL of blood was collected by a peripheral venous puncture in the morning, after a 12-hour fast, to obtain the biochemical data. The following parameters were evaluated:
- •
25-Hydroxyvitamin D (25 (OH) D) determined by Electrochemiluminescence22: values below 20μg/dL were considered deficient, values from 21 to 29μg/dL were considered insufficient and equal to or greater than 30μg/dL were considered sufficient;
- •
C-reactive protein (CRP) (marker of inflammatory and infectious process): reference values below 3.0mg/L;
- •
Interleukin 6 (IL6) (marker of inflammatory process) according to manufacturer's data: reference values below 3.4pg/mL;
- •
Alkaline phosphatase (Kinetic colorimetric) (liver function and bone marker): reference values below 240U/L;
- •
Parathormone (PTH) (Electrochemiluminescence) (bone marker): reference values from 25 to 65pg/mL;
- •
Aspartate Aminotransferase (AST) (Kinetic UV) (liver function): reference values below 40U/L;
- •
Alanine Aminotransferase (ALT) (Kinetic UV) (liver function): reference values below 40U/L;
- •
Gamma GT (GGT) (Enzymatic Kinetic) (liver function): reference values below 38U/L;
- •
Phosphorus (Molybdate UV) (bone marker). According to the manufacturer's data: reference values from 3.4 to 6.2mg/dL;
- •
Colorimetric Calcium (Arsenazo III). According to the manufacturer's data: reference values of 8.5–10.5mg/dL.
The device used was Cobas® 6000 analyzer series, fully automated, produced by Roche® Labs.
Statistical analysisStatistical analyses were conducted using STATA® version 13.0. A 5% statistical significance level was used (p<0.05).
Normally distributed quantitative data were compared using the t test; non-normally distributed data were compared using the Mann–Whitney test. Qualitative variables were analyzed using the Chi-squared test or Fisher's exact test. Pearson's correlation analysis was tested between the outcome and other continuous variables among the group of patients.
Univariate linear regression analyses were performed to evaluate the factors associated with the nutritional status of vitamin D only among the patients, with the outcome being vitamin D and the independent variables: sociodemographic (sex, age, income), body composition (body mass index, abdominal circumference and skinfolds), biochemical tests (hepatic and bone metabolism profile). There was no statistically significant difference (p=0.150) in vitamin D among the patients. Therefore, we chose to put them in a single group (N=24). Significant variables with p<0.10 entered the multiple linear regression model.
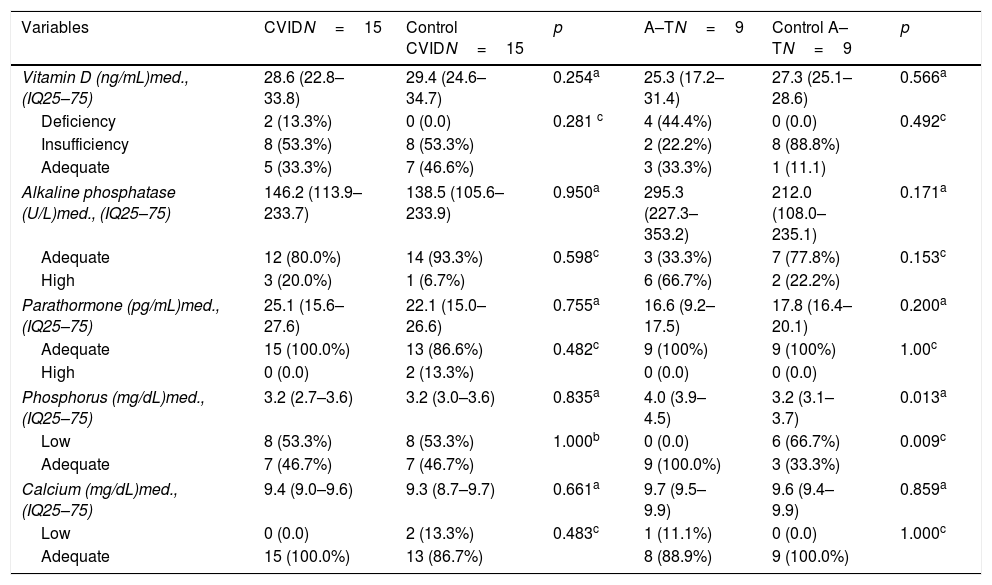
ResultsVitamin D deficiency was found in 44.4% (4/9) and 13.3% (2/15) of patients with A–T and CVID and 22.2% (2/9) and 53.3% (8/16) of insufficiency, respectively. None of the participants in the control group had a deficiency, but 66.6% (16/24) of vitamin D insufficiency was observed (Table 1).
Biochemical markers for bone metabolism of the groups of patients with common variable immunodeficiency and ataxia–telangiectasia and controls.
| Variables | CVIDN=15 | Control CVIDN=15 | p | A–TN=9 | Control A–TN=9 | p |
|---|---|---|---|---|---|---|
| Vitamin D (ng/mL)med., (IQ25–75) | 28.6 (22.8–33.8) | 29.4 (24.6–34.7) | 0.254a | 25.3 (17.2–31.4) | 27.3 (25.1–28.6) | 0.566a |
| Deficiency | 2 (13.3%) | 0 (0.0) | 0.281 c | 4 (44.4%) | 0 (0.0) | 0.492c |
| Insufficiency | 8 (53.3%) | 8 (53.3%) | 2 (22.2%) | 8 (88.8%) | ||
| Adequate | 5 (33.3%) | 7 (46.6%) | 3 (33.3%) | 1 (11.1) | ||
| Alkaline phosphatase (U/L)med., (IQ25–75) | 146.2 (113.9–233.7) | 138.5 (105.6–233.9) | 0.950a | 295.3 (227.3–353.2) | 212.0 (108.0–235.1) | 0.171a |
| Adequate | 12 (80.0%) | 14 (93.3%) | 0.598c | 3 (33.3%) | 7 (77.8%) | 0.153c |
| High | 3 (20.0%) | 1 (6.7%) | 6 (66.7%) | 2 (22.2%) | ||
| Parathormone (pg/mL)med., (IQ25–75) | 25.1 (15.6–27.6) | 22.1 (15.0–26.6) | 0.755a | 16.6 (9.2–17.5) | 17.8 (16.4–20.1) | 0.200a |
| Adequate | 15 (100.0%) | 13 (86.6%) | 0.482c | 9 (100%) | 9 (100%) | 1.00c |
| High | 0 (0.0) | 2 (13.3%) | 0 (0.0) | 0 (0.0) | ||
| Phosphorus (mg/dL)med., (IQ25–75) | 3.2 (2.7–3.6) | 3.2 (3.0–3.6) | 0.835a | 4.0 (3.9–4.5) | 3.2 (3.1–3.7) | 0.013a |
| Low | 8 (53.3%) | 8 (53.3%) | 1.000b | 0 (0.0) | 6 (66.7%) | 0.009c |
| Adequate | 7 (46.7%) | 7 (46.7%) | 9 (100.0%) | 3 (33.3%) | ||
| Calcium (mg/dL)med., (IQ25–75) | 9.4 (9.0–9.6) | 9.3 (8.7–9.7) | 0.661a | 9.7 (9.5–9.9) | 9.6 (9.4–9.9) | 0.859a |
| Low | 0 (0.0) | 2 (13.3%) | 0.483c | 1 (11.1%) | 0 (0.0) | 1.000c |
| Adequate | 15 (100.0%) | 13 (86.7%) | 8 (88.9%) | 9 (100.0%) | ||
Comparing the other biochemical variables between the groups, we observed a statistically significant difference between A–T and control, concerning phosphorus (Table 1).
There was no significant difference between patients and controls, respectively, according to sex (male: 59.3 vs. 59.3%), age in years (median: 26 (17.0–35.5)), pubertal stage (post-pubertal: n/total 79.2 vs. 79.2%), economic status (3min wages: 45.8 vs. 50.0%) and uses sunscreen (no: 83.3 vs. 100.0%).
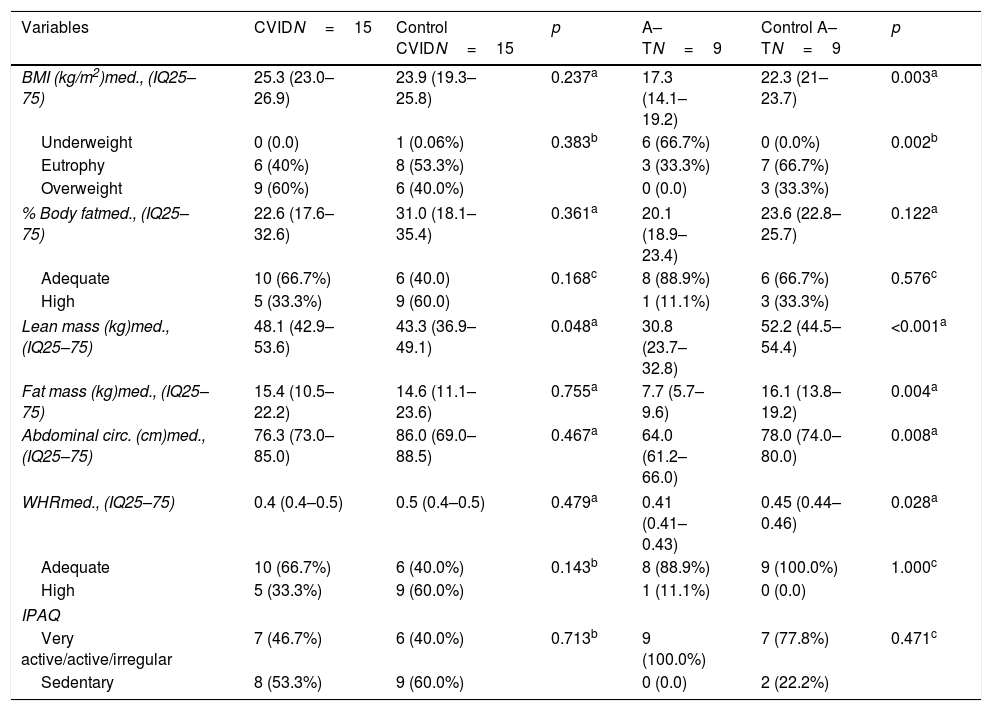
In the analysis of the nutritional status of the CVID group, overweight was observed in 60% (9/15) of the patients. In the A–T group, 66.6% (6/9) of patients had low weight, with a statistically significant difference between A–T and control group (Table 2).
Body composition and physical activity frequency of the groups of patients with common variable immunodeficiency and ataxia–telangiectasia and controls.
| Variables | CVIDN=15 | Control CVIDN=15 | p | A–TN=9 | Control A–TN=9 | p |
|---|---|---|---|---|---|---|
| BMI (kg/m2)med., (IQ25–75) | 25.3 (23.0–26.9) | 23.9 (19.3–25.8) | 0.237a | 17.3 (14.1–19.2) | 22.3 (21–23.7) | 0.003a |
| Underweight | 0 (0.0) | 1 (0.06%) | 0.383b | 6 (66.7%) | 0 (0.0%) | 0.002b |
| Eutrophy | 6 (40%) | 8 (53.3%) | 3 (33.3%) | 7 (66.7%) | ||
| Overweight | 9 (60%) | 6 (40.0%) | 0 (0.0) | 3 (33.3%) | ||
| % Body fatmed., (IQ25–75) | 22.6 (17.6–32.6) | 31.0 (18.1–35.4) | 0.361a | 20.1 (18.9–23.4) | 23.6 (22.8–25.7) | 0.122a |
| Adequate | 10 (66.7%) | 6 (40.0) | 0.168c | 8 (88.9%) | 6 (66.7%) | 0.576c |
| High | 5 (33.3%) | 9 (60.0) | 1 (11.1%) | 3 (33.3%) | ||
| Lean mass (kg)med., (IQ25–75) | 48.1 (42.9–53.6) | 43.3 (36.9–49.1) | 0.048a | 30.8 (23.7–32.8) | 52.2 (44.5–54.4) | <0.001a |
| Fat mass (kg)med., (IQ25–75) | 15.4 (10.5–22.2) | 14.6 (11.1–23.6) | 0.755a | 7.7 (5.7–9.6) | 16.1 (13.8–19.2) | 0.004a |
| Abdominal circ. (cm)med., (IQ25–75) | 76.3 (73.0–85.0) | 86.0 (69.0–88.5) | 0.467a | 64.0 (61.2–66.0) | 78.0 (74.0–80.0) | 0.008a |
| WHRmed., (IQ25–75) | 0.4 (0.4–0.5) | 0.5 (0.4–0.5) | 0.479a | 0.41 (0.41–0.43) | 0.45 (0.44–0.46) | 0.028a |
| Adequate | 10 (66.7%) | 6 (40.0%) | 0.143b | 8 (88.9%) | 9 (100.0%) | 1.000c |
| High | 5 (33.3%) | 9 (60.0%) | 1 (11.1%) | 0 (0.0) | ||
| IPAQ | ||||||
| Very active/active/irregular | 7 (46.7%) | 6 (40.0%) | 0.713b | 9 (100.0%) | 7 (77.8%) | 0.471c |
| Sedentary | 8 (53.3%) | 9 (60.0%) | 0 (0.0) | 2 (22.2%) | ||
The A–T patients had a median of lean mass (kg), median fat mass (kg), abdominal circumference and waist-to-height ratio (WHR) significantly lower in comparison to controls. On the other hand, the CVID group had greater lean mass compared to the control (Table 2).
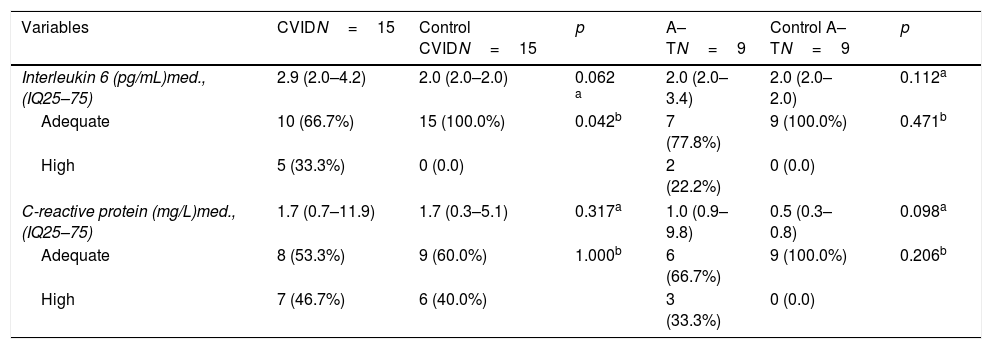
Among the CVID, there was a statistically significant difference regarding interleukin 6 (Table 3).
Biochemical markers of the inflammatory profile of the groups of patients with common variable immunodeficiency and ataxia–telangiectasia and controls.
| Variables | CVIDN=15 | Control CVIDN=15 | p | A–TN=9 | Control A–TN=9 | p |
|---|---|---|---|---|---|---|
| Interleukin 6 (pg/mL)med., (IQ25–75) | 2.9 (2.0–4.2) | 2.0 (2.0–2.0) | 0.062 a | 2.0 (2.0–3.4) | 2.0 (2.0–2.0) | 0.112a |
| Adequate | 10 (66.7%) | 15 (100.0%) | 0.042b | 7 (77.8%) | 9 (100.0%) | 0.471b |
| High | 5 (33.3%) | 0 (0.0) | 2 (22.2%) | 0 (0.0) | ||
| C-reactive protein (mg/L)med., (IQ25–75) | 1.7 (0.7–11.9) | 1.7 (0.3–5.1) | 0.317a | 1.0 (0.9–9.8) | 0.5 (0.3–0.8) | 0.098a |
| Adequate | 8 (53.3%) | 9 (60.0%) | 1.000b | 6 (66.7%) | 9 (100.0%) | 0.206b |
| High | 7 (46.7%) | 6 (40.0%) | 3 (33.3%) | 0 (0.0) | ||
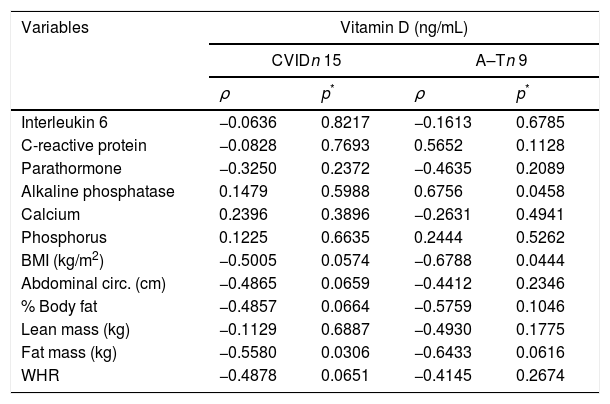
The A–T group showed values for hepatic profile markers significantly higher than the control, with AST (p<0.001), ALT (p=0.016) and GGT (p=0.024). When analyzing the correlation between vitamin D and biochemical variables and body composition in the A–T group, we observed a significant and negative correlation with body mass index (r=−0.678, p=0.044). In the CVI group, a negative correlation was found between vitamin D and fat mass (kg) (r=−0.5580, p=0.0306) (Table 4).
Correlation between vitamin D concentrations and biochemical and body composition variables of patients with primary immunodeficiency or patients with ataxia–telangiectasia.
| Variables | Vitamin D (ng/mL) | |||
|---|---|---|---|---|
| CVIDn 15 | A–Tn 9 | |||
| ρ | p* | ρ | p* | |
| Interleukin 6 | −0.0636 | 0.8217 | −0.1613 | 0.6785 |
| C-reactive protein | −0.0828 | 0.7693 | 0.5652 | 0.1128 |
| Parathormone | −0.3250 | 0.2372 | −0.4635 | 0.2089 |
| Alkaline phosphatase | 0.1479 | 0.5988 | 0.6756 | 0.0458 |
| Calcium | 0.2396 | 0.3896 | −0.2631 | 0.4941 |
| Phosphorus | 0.1225 | 0.6635 | 0.2444 | 0.5262 |
| BMI (kg/m2) | −0.5005 | 0.0574 | −0.6788 | 0.0444 |
| Abdominal circ. (cm) | −0.4865 | 0.0659 | −0.4412 | 0.2346 |
| % Body fat | −0.4857 | 0.0664 | −0.5759 | 0.1046 |
| Lean mass (kg) | −0.1129 | 0.6887 | −0.4930 | 0.1775 |
| Fat mass (kg) | −0.5580 | 0.0306 | −0.6433 | 0.0616 |
| WHR | −0.4878 | 0.0651 | −0.4145 | 0.2674 |
Concerning the multiple linear regression analysis, vitamin D was negatively associated with the percentage of total fat among patients (n=24) (β – 0.842, 95% CI: 1.5–0.17, p=0.015), R2=0.21, after adjusting for sex and age, data not shown in tables.
DiscussionThis study found vitamin D deficiency in patients with A–T and CVID, respectively. Such findings were similar to those observed in a study previously published by the same group.9
In a retrospective study involving 52 A–T subjects aged from 2 to 26.2 years old, 23 patients had their vitamin D tested. 12/23 (52.2%) were vitamin D deficient and 5 (21.7%) had vitamin D insufficiency.23
In this study, we did not evaluate bone mineral density since the evaluation requires exposure to ionizing radiation. Immobility associated with low sun exposure and reduced concentrations of 25 (OH) D may contribute to increased risk of fractures. Studies in experimental animals show that atm −/− mice show reduced bone mass associated with hypogonadism and a direct effect of ATM protein on the differentiation of osteoblasts.24,25
Given the participation of vitamin D in osteoporosis prevention, mortality due to the disease and the high risk of malignancy of A–T patients,25 monitoring of 25 (OH) D concentrations and supplementation, when necessary, is extremely important.
Deficiency of 25 (OH) D was observed less frequently in patients with CVID. In a study conducted in Turkey, vitamin D deficiency was observed in 13/22 (59%).26
Patients with CVID who participated in this study had no malabsorption syndrome, additionally a recent study found vitamin deficiency in three patients (case report) in the absence of enteropathy and clinical signs compatible with malabsorption syndrome. Vitamin D receptor expression was lower in peripheral blood mononuclear cells and hair follicles compared to the control group. Such findings may contribute to the dysregulation of inflammation, autoimmunity accompanying these patients, or even increase the risk of fractures and neoplasms.10
This study found a negative correlation between vitamin D and fat mass (kg) for CVID and with BMI for A–T. There was also a negative association found between vitamin D concentrations and percentage of body fat in the total number of patients (n=24), even after adjustment for age and sex. A recently published systematic review highlighted the negative correlation between vitamin D and fat mass.27
Studies on body composition in A–T are rare. In a sample of fourteen A–T, six (42.8%) showed malnutrition, despite adequate energy intake. In the findings, malnutrition has a clinical deterioration proportional to the advancement of age.28
The findings of lean mass and fat mass below the control group are expected in A–T patients, since infections are frequent, with a consequent increase in energy demand, and physical and physiological changes due to the disease progression are the factors that contribute to the disease malnutrition.29 Dysphagia, a consequence of neurodegeneration and uncoordinated deglutination, may lead to choking and aspiration pneumonia which also contribute to malnutrition.30
A study with 46 A–T in the United Kingdom found vitamin D deficiency and insufficiency in 12/46 (26%) and 22/46 (48%), respectively. The author justified the finding not only due to low sun exposure but also as a consequence of malnutrition.11 This may also be one of the causes of the deficiency observed by us since most of our A–T patients were malnourished.11
Studies of body composition in CVID patients are also scarce. A study with 24 patients, 18 CVID, and six other agammaglobulinemia patients found that 8/24 (33.3%) had a high BMI and that 17/24 (70.8%) patients had high fat percentage.31
This study found similar results regarding body composition since the patients with CVID had higher values of lean mass and fat mass when compared to the control group.
IL-6 concentrations were higher in patients with CVID compared to controls, which was not observed for CRP. The increased production of interleukins is typical of chronic diseases, especially those involving the immune system's defects.32 In this particular case, considering obesity as a moderate but chronic inflammatory state, a clinical picture is complete, in which the disease itself, in parallel with a condition of obesity, aggravates the inflammatory state.
Deficient serum concentrations of 25 (OH) D have been found in obese. In obesity, the liver and adipose tissue have an increased in volume; thus, reduced vitamin D levels may reflect their solubility in cells, and the body's vitamin D supply is regular. One questions whether the findings of vitamin D deficiency are the cause or the consequence of obesity.33
In describing the association between vitamin D concentrations and the body composition of patients with PID, this pioneering study had some limitations, such as 25 (OH) D collections performed at different seasons of the year and the lack of phototype investigation. Genetic mutation tests were not performed. Therefore, it was not possible to address whether the vitamin D deficiency had any relation to the primary disease itself.
In order to gain a better understanding of the relationship between vitamin D and the immune system, more studies should be made on this topic, including analyzing the phototype and performing genetic tests.
In conclusion, vitamin D deficiency was found only in the group of patients and was more prevalent among A–T. No correlation was found between serum vitamin D concentrations and bone and inflammatory biochemical markers, only with body composition. There was an inverse association of 25 (OH) D concentrations with body fat concentration.
Considering the importance of vitamin D for actions related to the immune system, we emphasize the importance of monitoring serum 25 (OH) D concentrations and vitamin supplementation, when necessary, for patients with CVID and A–T, since they may have deficiency of this vitamin.
Conflict of interestNothing to declare.
This study was financed in part by the Coordenação de Aperfeiçoamento de Pessoal de Nível Superior – Brasil (CAPES).
