


Cognitive impairment (CI) in bipolar disorder (BD) significantly impacts overall functioning and quality of life. A better understanding of the neurobiological mechanisms associated with CI is needed. Studies on neurodegenerative diseases, such as Alzheimer's and Parkinson's diseases, have revealed promising findings related to retinal thickness alterations using optical coherence tomography (OCT).
Similarly, retinal differences between healthy controls and individuals with BD or schizophrenia have been described. This study explores the utility of OCT in discerning retinal changes possibly associated with CI in BD to enhance our understanding of the biological markers of BD and provide additional information to neuropsychological testing.
Material and methodsOptical coherence tomography (OCT) was employed to measure retinal thickness in the macular ganglion cell layer (GCL), inner plexiform layer (IPL), retinal nerve fiber layer (RNFL), and peripapillary RNFL (pRNFL) in 50 individuals with bipolar disorder (BD). Associations with cognitive impairments were analyzed using cross-validated Random Forest models.
ResultsThe analysis revealed significant associations between retinal thinning in various segments of the macular GCL, IPL, and RNFL and cognitive impairment (CI) in BD, with particular relevance to executive function deficits (AUC>0.8).
ConclusionsThinning of the GCL, IPL, and RNFL was significantly associated with worse cognitive performance in individuals with BD. Similar patterns have been observed in schizophrenia, highlighting an innovative and promising field for research and clinical application.
Bipolar disorder (BD) is a brain disorder and one of the most debilitating mental illnesses, with an overall prevalence ranging from 0.8% up to 2%.1 Cognitive impairment (CI) stands out as a significant and challenging aspect of the illness.2 The neurobiological underpinnings of CI in BD have been investigated for years, driven by the heterogeneity in its incidence rate and clinical signs across the course of the disease. For instance, approximately 30–50% of individuals with BD show normal neuropsychological functioning during euthymic periods, while others exhibit substantial cognitive deficits or a greater risk of developing dementia.3 The neurobiological mechanisms underlying CI have been extensively studied, mainly through neuroimaging modalities, which have provided a better understanding of the possible neuroanatomical underpinnings.4 Among other cognitive domains, attention, executive functions, and memory dysfunctions have been related to neuroanatomical findings, such as reduced gray matter, decreased hippocampal volume, increased ventricular size, and white matter changes.4–6 In addition, functional neuroimaging modalities have described that CI is suggested to be associated with disruptions in neural activity within the prefrontal cortex, dorsal prefrontal regions of the default mode network, and thalamic pathways.7 These findings have provided valuable insights into the biological mechanisms that may be associated with CI in individuals with BD. However, further research is needed to identify biomarkers of CI in BD, ideally using scalable methodologies.
The retina is a tissue that shares embryological, anatomical, and physiological properties with the brain.8 In fact, the retina has often been described as a window to the brain.9 Optical coherence tomography (OCT) is a simple and fast imaging modality used to measure the thickness of retinal layers. Unlike brain regions, the retina can also be studied non-invasively and in much greater detail, with a resolution of a few micrometers.10 Research focused on the potential of the retina for early detection, prediction, or as a new biomarker for many systemic diseases is growing rapidly. Promising results have been reported in diseases involving neuroinflammation and neurodegeneration.11 For example, Zhou et al. recently used 1.6 million unlabeled retinal images to generate, using advanced artificial intelligence techniques, a predictive model of systemic disorders such as heart failure and myocardial infarction, showing promising results.12
OCT has emerged as a promising tool for mental disorders. For instance, significant thinning of the peripapillary tetinal nerve fiber layer (pRNFL) has been described, particularly in schizophrenia (SZ). In addition, macular GCL and IPL thinning has also been reported in SZ and BD.13,14 Furthermore, multimodal structural and electrophysiological retinal alterations in individuals with SZ have recently been associated with disease duration, severity, and individual genetic risk.15
The relationship between CI and retinal thickness has primarily been described in neurodegenerative diseases such as Alzheimer's Disease (AD), mainly focusing on the thinning of the RNFL. For instance, recent studies have described an association between early stages of AD or even mild CI in healthy subjects with significant thinning of the RNFL, which has shown a relationship with neuroimaging changes in brain regions related to AD, such as the entorhinal cortex, lingual gyrus or the hippocampus.16 Therefore, the OCT has been proposed as a potential biomarker of CI in neurodegenerative diseases such as AD.16 However, the retina's role as a biomarker for cognitive performance in mental disorders is scarce. Thinning in various macular segments of RNFL, GCL, and IPL in individuals with SZ has been associated with poorer performance in memory, visuospatial functions, verbal fluency, and attention in neurocognitive evaluations.17,18 Instead, research on cognitive deficits and their relationship with retinal layers in BD individuals is missing.
This study aims to assess whether OCT measures could be associated with cognitive impairment in BD. As a secondary objective, we investigate whether differences in retinal thickness exist between patients with BD and healthy controls. Our primary hypothesis is that retinal thickness may serve as a potential biomarker for CI in BD, thereby contributing to the development of future early detection tools for assessing cognitive impairment in individuals with BD.
MethodsSample collectionWe conducted an observational and cross-sectional study involving clinical and neuropsychological evaluations and retinal thickness measurements using OCT with a cohort of 50 BD patients (BD). For the secondary endpoint, we assessed a comparison group of 50 healthy controls (HC) group. Participants were recruited from January 2020 to January 2022. In full compliance with the Declaration of Helsinki II, the study received the approval of Hospital Universitario Araba Ethics Committee (September 20th, 2019, Certificate No. 2019-036). All participants gave their prior written consent for the study protocol.
Inclusion and exclusion criteriaThe participants ranged from 18 to 65 years and were proficient in Spanish. Participants in the BD group were euthymic patients from the Psychiatry Department of Hospital Universitario Araba with a diagnosis of BD type I or II.19 The presence and absence of diagnoses were confirmed with the structured clinical interview for the Diagnostic and Statistical Manual 5 (SCID). To ensure euthymia, participants did not meet the criteria for an acute mood state as per SCID. Additionally, they did not score>10 points on the 17-item Hamilton Depression Rating Scale (HAM-D) or >10 points on the Young Mania Rating Scale (YMRS), criteria based on the findings of previous meta-analyses.20 Exclusion criteria for all participants included a clinical diagnosis of intellectual disability, a past medical history of head injury with loss of consciousness, physical illnesses affecting mental health, inflammatory disease, neurodegenerative disease, hypertension, and diabetes. All participants had no psychiatric comorbidities other than tobacco use, measured by DSM-5.19 Alcohol consumption was allowed, provided there was no abuse or dependence.19
Ophthalmological inclusion criteria for all participants required corrected visual acuity (CVA) of 20/50 or better (measured using a Snellen chart, equivalent to +0.4 in LogMar) in each eye and intraocular pressure (IOP)<21mmHg. Exclusion criteria were carefully defined to ensure that participants had no conditions that could alter the retinal structure. These criteria included significant refractive errors (>5 diopters of spherical equivalent refraction or 3 diopters of astigmatism), IOP≥21mmHg, ocular media opacities, and any concomitant eye diseases, such as a history of glaucoma or retinal disease. Additionally, systemic conditions known to impact the visual system, including diabetic retinopathy, optic neuropathies, neurodegenerative diseases, and vascular issues, were also grounds for exclusion. These criteria align with established standards used in studies on retinal health in BD, ensuring methodological consistency with prior research in this area.21
The HC group participants had no past medical history or evidence of ocular, psychiatric, or neurological diseases. They met the same ophthalmologic exclusion criteria as the BD group. For the study, both eyes of each participant were measured.
Clinical assessmentAll participants underwent an initial clinical evaluation using the DSM-5 Structured Clinical Interview19 conducted by the psychiatry research team at Hospital Universitario Araba. The following anthropometric and sociodemographic variables were collected: Age, gender, body mass index (BMI), presence or absence of metabolic syndrome using diagnostic criteria,22 tobacco and alcohol use, and socioeconomic status based on the Hollingshead scale with ranks #1 and #2 were considered low status, rank #3, medium status and ranks #4 and #5, high status.23 Finally, information was collected on whether the patients were under treatment with lithium, antipsychotics, anxiolytics, or other mood stabilizers. Clinical measurements and hetero-administered scale scores were obtained for each study participant, including the number of manic and depressive episodes and scores on the YMRS and the HAM-D.
Neuropsychological assessmentNeuropsychological evaluations were conducted for patients with BD by qualified investigators. Executive functions were first evaluated using the Stroop test, which assesses selective attention and the ability to inhibit cognitive interference,24 and the Computerized Version of the Wisconsin Card Sorting Test (WCST), extensively used to measure other executive functions such as cognitive flexibility, working memory, and inhibitory control.25 Aftweeards, memory and learning processes were evaluated using the Complutense Verbal Learning Test (TAVEC), the Spanish version of the California Verbal Learning Test (CVLT).26 Since our interest was to detect CI, we dichotomized these measures and established the median of the sample scores as the cutoff point, as done in previous studies.27 Values above the median were considered normal, while values below were considered affected. In Table S1 of the supplementary data shows the established cutoff points for each section.
Retinal thickness measurement using OCTRetinal thickness measurements were performed using OCT with a SPECTRALIS HRA+OCT device (Heidelberg Engineering, Heidelberg, Germany). The device operates at a scanning frequency of 40kHz and a scanning depth of 1.8mm, with an axial resolution of 7μm (3.5μm/pixel) and a lateral resolution of 14μm. The Heidelberg Eye Explorer software (version 1.9.10) was employed for data analysis and visualization. The retinal nerve fiber layer (RNFL), ganglion cell layer (GCL), and inner plexiform layer (IPL) thicknesses were measured in nine regions as defined by the ETDRS chart at the macular level: Central (C), Inner Nasal (IN), Outer Nasal (ON), Inner Superior (IS), Outer Superior (OS), Inner Temporal (IT), Outer Temporal (OT), Inner Inferior (II), and Outer Inferior (OI). For streamlined data analysis, the inner and outer segments of each region were combined into 5 segments: Central (C), Nasal (N), Temporal (T), Superior (S), and Inferior (I). Additionally, global measurements of peripapillary nerve fiber layer thickness (pRNFL) were considered, with data collected from both eyes.
Statistical analysisIn our statistical analysis, we first aimed to examine retinal differences between BD and HC to validate previous findings.13,28 We began by comparing OCT parameters between the 2 groups using independent samples t-tests. Prior to this, the Kolmogorov–Smirnov test confirmed that the analyzed variables followed a normal distribution, allowing for the application of t-tests. To account for potential confounding variables, including age, sex, BMI, and the presence of metabolic syndrome, we adjusted for these factors within the t-test analysis. Statistical significance was set at p<0.05, and effect sizes were calculated to quantify the size of the observed differences.
Subsequently, we directed our attention toward assessing CI within the BD group. We used a 10-fold cross-validation strategy, categorizing the overall BD sample into a training and test subsample 10 times, ensuring all individuals are part of a test subsample once. We created a Random Forest (RF) model in each cross-validation fold using the training subsample data. We then used this model to classify CI in the test subsample.
The primary metric for assessing the discriminant capacity of the RF was the AUC (area under the ROC curve), considering the model discriminant if AUC>0.70. The AUC provides a guide on the quality of the discrimination model, though a precise value of AUC that ensures good discrimination has not been agreed upon in the literature.29,30 A quick review reported in De Hond et al.,30 showed that a cutoff value of 0.7 is considered by many authors as a fair discrimination ability. Nevertheless, this criterion depends on the statistical properties of the classifier. When carrying out some analysis aiming to assert the quality of the cutoff value, authors usually assume underlying Gaussian distributions,29 which is not applicable to random forest classifiers. Hence, we assume that the AUC>0.7 indicates a moderate-to-fair discrimination quality. Additionally, we evaluated the F1 score, a robust measure balancing sensitivity and specificity, and accuracy as an immediate goodness-of-fit measure. To determine whether the association of the selected OCT measures with CI was positive or negative, post hoc analysis by multivariate logistic regression was conducted. Confounding variables included age, sex, BMI, and metabolic syndrome.
To analyze the relevance of each OCT measure in the model, we saved the RF importance measure based on the Gini index at decision nodes where the measure participated from each cross-validation fold. We combined these importance measures for the ten folds by averaging the Gini indices.
For secondary analyses, we compared the sociodemographic variables of the sample between the BD group and the HC group using Student's t-test, with p<0.05 considered statistically significant results.
The data were analyzed using the stand-alone JASP system implemented in R, which depends on the RF packages for JASP (https://jasp-stats.org)/R software.
The TRIPOD31 criteria were followed to ensure comprehensive and transparent reporting of our model. The detailed checklist and its application in our study are in Table S2 of the Supplementary Material. The data supporting this study findings are available on request from the corresponding author.
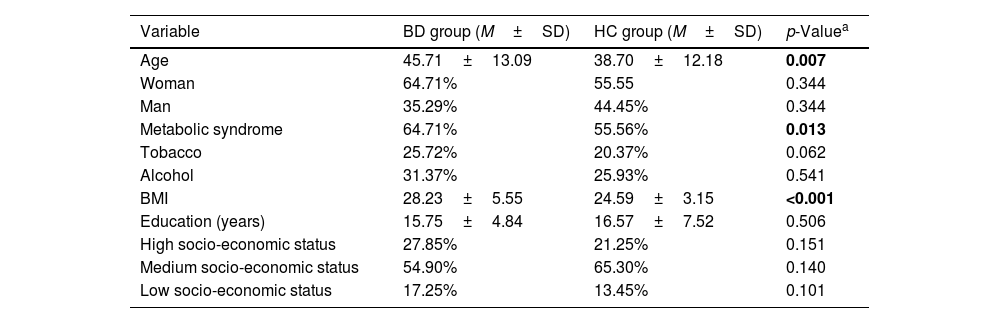
ResultsSample descriptionTable 1 displays the results for the sociodemographic variables studied. Significant differences were found between BD and HC in age (p=0.007), metabolic syndrome (p=0.013), and BMI (p<0.001). Regarding neuropsychological measures in the BD group, the mean Stroop Interference score was 51.88±6.3. For the Wisconsin Card Sorting Test, the BD group exhibited the following mean scores: Total Errors (47.1±7.43), Perseverative Responses (48.63±9.15), and Perseverative Errors (48.61±10.83). Regarding drug use, 70.05% of individuals from the BD group were treated with lithium, 15.68% with valproic acid, 52.94% with benzodiazepines, and 56.86% with antipsychotics.
Sociodemographic outcomes of the sample.
| Variable | BD group (M±SD) | HC group (M±SD) | p-Valuea |
|---|---|---|---|
| Age | 45.71±13.09 | 38.70±12.18 | 0.007 |
| Woman | 64.71% | 55.55 | 0.344 |
| Man | 35.29% | 44.45% | 0.344 |
| Metabolic syndrome | 64.71% | 55.56% | 0.013 |
| Tobacco | 25.72% | 20.37% | 0.062 |
| Alcohol | 31.37% | 25.93% | 0.541 |
| BMI | 28.23±5.55 | 24.59±3.15 | <0.001 |
| Education (years) | 15.75±4.84 | 16.57±7.52 | 0.506 |
| High socio-economic status | 27.85% | 21.25% | 0.151 |
| Medium socio-economic status | 54.90% | 65.30% | 0.140 |
| Low socio-economic status | 17.25% | 13.45% | 0.101 |
Note: Test statistics for a Student's t-test.
Significant thinning was observed in the ganglion cell layer (GCL) and inner plexiform layer (IPL) in BD patients vs HCs. In the GCL, differences were identified in the Right Nasal (HC, 92.41±6.03μm, BD, 87.49±9.03μm, p=0.025), Left Nasal (HC, 92.41±7.58μm, BD, 89.12±8.56μm, p=0.045), Left Inferior (HC, 87.5±6.01μm, BD, 82.8±9.07μm, p=0.022), and Right Temporal (HC, 87.2±7.7μm, BD, 83.24±10.47μm, p=0.038) regions. In the IPL, significant thinning was observed in the Right Nasal (HC, 74.28±4.94μm, BD, 71.55±6.41μm, p=0.016), Right Temporal (HC, 76.22±4.59μm, BD, 72.61±6.36μm, p=0.016), and Left Temporal (HC, 74.89±4.54μm, BD, 71.8±6.24μm, p=0.022) regions. The full results of retinal thickness measures are detailed in Table S3 of the supplementary data.
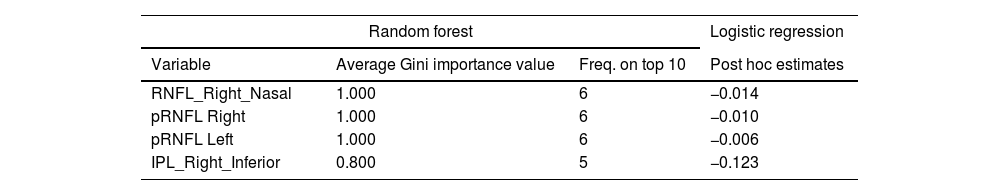
Random Forest (RF) analysis identified RNFL Right Nasal, pRNFL Center in both eyes and IPL Right Inferior as the most relevant OCT measures distinguishing BD patients from HCs (Fig. 1). These measures demonstrated a significant association, with performance metrics indicating AUC>0.8, F1>0.7, and Test Accuracy>0.7 across all cross-validation folds. The RF model also highlighted the relative importance of these variables based on the Gini index, emphasizing their role in classifying individuals with BD. Post hoc logistic regression further confirmed that thinner measurements in these layers were associated with BD diagnosis. The importance of these variables and the mean classification performance are shown in Table 2.
, inner plexiform layer (IPL), retinal nerve fiber layer (RNFL) and peripapillary areas of the Retinal Nerve Fiber Layer (pRNFL) that showed significant thinning in patients with bipolar disorder vs healthy participants after Random Forest analysis. AUC>0.8 F1>0.7 Test Accuracy>0.7.")
Macular areas of the ganglion cell layer (GCL), inner plexiform layer (IPL), retinal nerve fiber layer (RNFL) and peripapillary areas of the Retinal Nerve Fiber Layer (pRNFL) that showed significant thinning in patients with bipolar disorder vs healthy participants after Random Forest analysis. AUC>0.8 F1>0.7 Test Accuracy>0.7.
Retinal regions associated with bipolar disorder patients compared with healthy controls identified by RF. Average Gini Importance of the variables identified by Random Forest in the top 10 in the validation and test replicates. Corresponding estimates in the post hoc logistic regression analysis. Mean classification performance results over 10 validation folds.
| Random forest | Logistic regression | ||
|---|---|---|---|
| Variable | Average Gini importance value | Freq. on top 10 | Post hoc estimates |
| RNFL_Right_Nasal | 1.000 | 6 | −0.014 |
| pRNFL Right | 1.000 | 6 | −0.010 |
| pRNFL Left | 1.000 | 6 | −0.006 |
| IPL_Right_Inferior | 0.800 | 5 | −0.123 |
| Mean (standard deviation) classification performance over 10 validation folds. | |
|---|---|
| Test accuracy | 0.748 SD (0.055) |
| AUC | 0.809 SD (0.055) |
| F1 SCORE | 0.747 SD (0.055) |
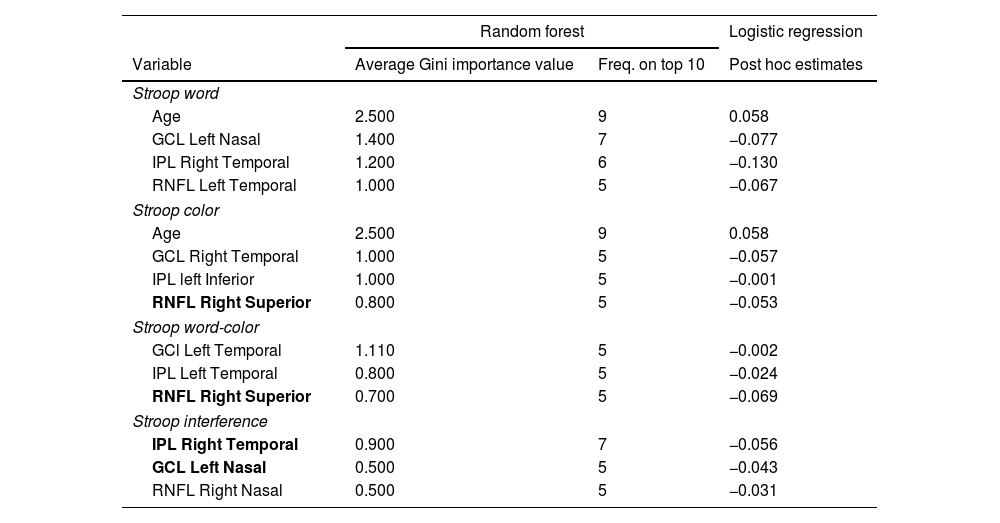
Thinning of different areas of the macular GCL, IPL, and RNFL, as shown in Fig. 2a, demonstrated a significant association with lower scores in the Stroop test. No significant areas were found in the pRNFL. Table 3 shows the importance of the variables, and the mean classification of the RF model is presented; GCL Left Nasal, IPL Right Temporal, and RNFL Right Superior are mentioned twice among the different sections of the Stroop test. Temporal areas of the GCL and IPL of both eyes were also identified as important variables in different test sections. Age is the most important variable in 2 sections of the Stroop test. All results demonstrate significant mean classification performance (Test Accuracy, AUC, and F1>0.7).
, inner plexiform layer (IPL), retinal nerve fiber layer (RNFL), and apillary retinal nerve fiber layer (pRNFL) associated with lower Stroop test performance by BD group identified by Random Forest. Test Accuracy AUC and F1>0.7. Lower panel Fig. 2b: Significant thinning areas of the macular ganglion cell layer (GCL), inner plexiform layer (IPL), retinal nerve fiber layer (RNFL), and peripapillary retinal nerve fiber layer (pRNFL) associated with lower Wisconsin test performance by BD group identified by Random Forest. Test Accuracy>0.7 AUC>0.8 and F1>0.7.")
Upper panel Fig. 2a: Significant thinning areas of the macular ganglion cell layer (GCL), inner plexiform layer (IPL), retinal nerve fiber layer (RNFL), and apillary retinal nerve fiber layer (pRNFL) associated with lower Stroop test performance by BD group identified by Random Forest. Test Accuracy AUC and F1>0.7. Lower panel Fig. 2b: Significant thinning areas of the macular ganglion cell layer (GCL), inner plexiform layer (IPL), retinal nerve fiber layer (RNFL), and peripapillary retinal nerve fiber layer (pRNFL) associated with lower Wisconsin test performance by BD group identified by Random Forest. Test Accuracy>0.7 AUC>0.8 and F1>0.7.
Retinal regions associated with lower Stroop test performance in bipolar disorder patients identified by RF. Estimates in post hoc logistic regression analysis. Mean RF classification performance results over 10 validation runs.
| Random forest | Logistic regression | ||
|---|---|---|---|
| Variable | Average Gini importance value | Freq. on top 10 | Post hoc estimates |
| Stroop word | |||
| Age | 2.500 | 9 | 0.058 |
| GCL Left Nasal | 1.400 | 7 | −0.077 |
| IPL Right Temporal | 1.200 | 6 | −0.130 |
| RNFL Left Temporal | 1.000 | 5 | −0.067 |
| Stroop color | |||
| Age | 2.500 | 9 | 0.058 |
| GCL Right Temporal | 1.000 | 5 | −0.057 |
| IPL left Inferior | 1.000 | 5 | −0.001 |
| RNFL Right Superior | 0.800 | 5 | −0.053 |
| Stroop word-color | |||
| GCl Left Temporal | 1.110 | 5 | −0.002 |
| IPL Left Temporal | 0.800 | 5 | −0.024 |
| RNFL Right Superior | 0.700 | 5 | −0.069 |
| Stroop interference | |||
| IPL Right Temporal | 0.900 | 7 | −0.056 |
| GCL Left Nasal | 0.500 | 5 | −0.043 |
| RNFL Right Nasal | 0.500 | 5 | −0.031 |
| Mean (standard deviation) classification performance over 10 validation folds. | |
|---|---|
| Stroop word | |
| Test accuracy | 0.770 SD (0.106) |
| AUC | 0.729 SD (0.108) |
| F1 score | 0.767 SD (0.104) |
| Stroop color | |
| Test accuracy | 0.718 SD (0.159) |
| AUC | 0.715 SD (0.135) |
| F1 score | 0.718 SD (0.150) |
| Stroop word-color | |
| Test accuracy | 0.790 SD (0.120) |
| AUC | 0.728 SD (0.110) |
| F1 score | 0.791 DE (0.120) |
| Stroop interference | |
| Test accuracy | 0.730 SD (0.082) |
| AUC | 0.775 SD (0.133) |
| F1 score | 0.725 SD (0.084) |
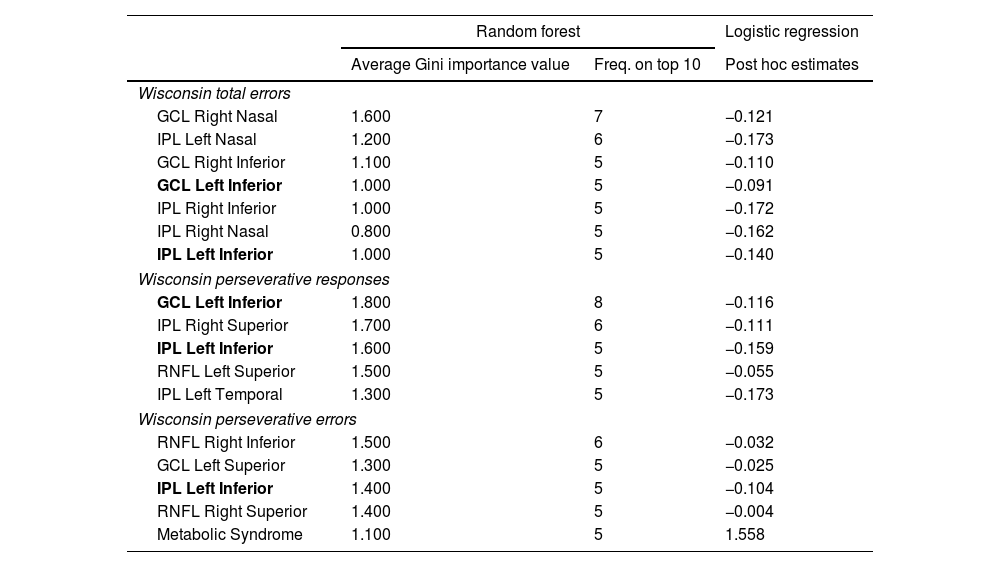
Thinning of different macular GCL, IPL, and RNFL areas, as shown in Fig. 2b, demonstrated a significant association with lower scores in the WCST. No significant areas were found in the pRNFL. All results exceed a threshold of 0.7, with AUCs consistently exceeding 0.8, indicating a robust discriminant capacity. IPL Left Inferior was consistently present across all 3 test sections, while GCL Left Inferior was present in two sections, highlighting their relevance (Table 4). Thinning of the IPL Temporal, Inferior, and Nasal segments was significant in both eyes and the superior RNFL and Inferior GCL segments in different sections of the Test. Metabolic syndrome appears as one of the important variables in the last section of the test.
Retinal regions associated with lower Wisconsin test performance in bipolar disorder patients identified by Random Forest. Estimates in post hoc logistic regression analysis. Average classification performance results over 10 validation runs.
| Random forest | Logistic regression | ||
|---|---|---|---|
| Average Gini importance value | Freq. on top 10 | Post hoc estimates | |
| Wisconsin total errors | |||
| GCL Right Nasal | 1.600 | 7 | −0.121 |
| IPL Left Nasal | 1.200 | 6 | −0.173 |
| GCL Right Inferior | 1.100 | 5 | −0.110 |
| GCL Left Inferior | 1.000 | 5 | −0.091 |
| IPL Right Inferior | 1.000 | 5 | −0.172 |
| IPL Right Nasal | 0.800 | 5 | −0.162 |
| IPL Left Inferior | 1.000 | 5 | −0.140 |
| Wisconsin perseverative responses | |||
| GCL Left Inferior | 1.800 | 8 | −0.116 |
| IPL Right Superior | 1.700 | 6 | −0.111 |
| IPL Left Inferior | 1.600 | 5 | −0.159 |
| RNFL Left Superior | 1.500 | 5 | −0.055 |
| IPL Left Temporal | 1.300 | 5 | −0.173 |
| Wisconsin perseverative errors | |||
| RNFL Right Inferior | 1.500 | 6 | −0.032 |
| GCL Left Superior | 1.300 | 5 | −0.025 |
| IPL Left Inferior | 1.400 | 5 | −0.104 |
| RNFL Right Superior | 1.400 | 5 | −0.004 |
| Metabolic Syndrome | 1.100 | 5 | 1.558 |
| Mean (standard deviation) classification performance over 10 validation folds. | |
|---|---|
| Wisconsin total errors | |
| Test accuracy | 0.770 SD (0.067) |
| AUC | 0.819 SD(0.070) |
| F1 score | 0.770 SD (0.068) |
| Wisconsin perseverative responses | |
| Test accuracy | 0.740 SD (0.070) |
| AUC | 0.819 SD (0.070) |
| F1 score | 0.746 SD (0.073) |
| Wisconsin perseverative errors | |
| Test accuracy | 0.700 SD (0.067) |
| AUC | 0.765 SD (0.094) |
| F1 score | 0.691 SD (0.062) |
Finally, the TAVEC test outcomes present data with limited practical utility. The model performance metrics (F1 score, AUC, and Test Accuracy) occasionally fall below the 0.6 threshold, suggesting a diminished association. Detailed results are available in Table S4 of the Supplementary data.
DiscussionIn this study, we used OCT to investigate the relationship between retinal thickness and CI in individuals with BD. Our findings revealed significant correlations between thinning in specific segments of the GCL, IPL, and RNFL at the macular level and poorer cognitive performance, particularly in executive functions.
As far as we know, this is the first study ever conducted on the associations between OCT and cognition in BD, aligning with the growing recognition of OCT utility in studying diseases directly related to cognition, such as AD. In AD research, retinal thickness studies have shown promising results, highlighting OCT potential as an early detection biomarker.16 Regarding mental disorders, recent research has identified a relationship between greater severity of SZ, including worse cognition, and retinal layer thinning, particularly in the IPL and RFNL.15 In that study, no differences were observed between individuals diagnosed with SZ and those with schizoaffective disorder. Therefore, thinning associated with severity and worse executive function could be related to a broader and transdiagnostic phenotype. The significance of our findings, demonstrating a relationship between retinal thinning and impaired executive function, remains to be elucidated. To this date, different neuroimaging modalities conducted in euthymic individuals with BD have described brain changes such as decreased brain activity in the prefrontal, ventral and dorsal regions, hippocampus and cingulate cortex, associated with impaired executive functions.32–34 In our study—which was also exclusively conducted on euthymic BD individuals—we have successfully identified that the thinning of the GCL, IPL and RNFL in various segments at the macular level is also related to executive function impairment (Fig. 2). Therefore, one hypothesis could be that changes in the retina in BD individuals with CI may reflect changes at cerebral level, as described in other CI-related systemic conditions or diseases.35,36 For instance, the recent Rhineland study35 described a robust association between various structures, such as brain volume, gray matter, and the hippocampus, with both the outer and inner retina. Conversely, recent research by Boudriot et al.15 found no correlation between gray or white matter brain structures and retinal thickness. This suggests that while brain and retinal alterations may share unknown underlying causes, they appear to be independent processes.37 Further research is needed to elucidate the plausible biological connection between structural and functional changes seen on the MRI and retinal changes in patients with CI in BD, as well as the role of factors such as inflammation.15
The results from this study were independent of the age of the patients with BD. Nevertheless, age emerged as a significant variable with heightened discriminatory capacity for cognitive performance in patients with BD, as evidenced in various sections of the neuropsychological assessments, even when accounted for as a confounding variable. In line with our results, recent studies have described that retinal atrophy, especially shown by the thinning of the RNFL and GCL+IPL layers, occurs at an increased rate in schizophrenia spectrum disorders, potentially reflecting accelerated aging.38,39 The study by Domagala et al.,38 found in their post hoc analyses that macular thickness diminished with age in patients with a diagnosis of SZ but not in controls. Blose et al.39 found a similar association between age in patients diagnosed with SZ and macular thickness, especially in GCL-IPL layers, that was not seen in controls. Numerous studies have detailed an elevated risk of cognitive-related conditions associated with aging in individuals with BD.40 These results regarding retinal thinning and its relationship with cognitive functions and age continue to offer hope for possibly including OCT use as a promising biomarker for CI in BD in early stages, as is already being done in numerous neurodegenerative diseases.16,36
Another variable that showed significant importance in our results was the presence of metabolic syndrome. Although it was also accounted for as a confounding variable in our study, it emerged as a significant factor influencing the Random Forest model for the Wisconsin Test section. Alongside the different macular areas of the RNFL, GCL and IPL, metabolic syndrome showed a significant association with patients who performed poorly on the Wisconsin Test. Notably, Kurtulmus et al.,41 described that IPL thinning was associated with increased BMI and decreased HDL levels in SZ, further suggesting a link between retinal structural changes and metabolic health. Recently, the ENIGMA Bipolar Disorder group reported that BD and obesity are associated with reduced cortical thickness.42 Earlier studies have found a link between metabolic syndrome and poorer cognitive performance in BD patients, especially in executive functions.43 These findings underscore the need for further research to determine whether retinal thickness is also more adversely affected in BD patients with metabolic syndrome, akin to its influence at the cortical level.
In addition, our study replicated the thinning of the pRNFL in both eyes and the nasal segment of the RNFL at the macular level, demonstrating discriminative capacity in distinguishing patients with BD from HCs. Similarly, this discriminatory ability is evident in the lower segment of the IPL in the right eye (Fig. 1). These findings support prior research, such as the recent meta-analysis by Prasannakumar et al.,13 which reports a significant thinning of the GCL-IPL layers at the macular level and the pRNFL in BD patients vs HCs.
In line with our findings, we believe OCT could be an additional tool for studying cognition biomarkers in BD. As a non-invasive and high-resolution imaging modality, it can be more acceptable for people with mental diseases vs other imaging modalities.44 Using OCT as an early detection tool for CI represents a significant challenge. It could enable the detection of patients at higher risk of CI by detecting subtle changes not observable in standard assessments related to cognitive function. Additionally, the OCT could enhance the precision of monitoring disease progression and treatment responses, thus paving the way for a more individualized medicine. In this context, the potential implementation of a staging system that considers both clinical aspects and innovative biological biomarkers, such as those provided by OCT, could help identify patients with a heightened vulnerability to CI or even identify those patients with a higher risk of developing dementia, condition already described as more prevalent in BD individuals.3 Our research advocates for this technique due to its simplicity, cost-effectiveness, and the absence of absolute contraindications vs classical neuroimaging modalities. However, a deeper understanding of OCT potential functions requires further research.
Our study has some limitations that should be acknowledged. As an initial exploration with a cross-sectional design and a relatively small sample size, our findings would benefit from further validation in longitudinal studies with larger, more diverse cohorts. Although we have considered several confounding factors, future research could enhance the robustness of these findings by considering additional variables, such as tobacco use and variations in pharmacological treatments.
In conclusion, this study highlights the potential of OCT as a non-invasive tool for investigating retinal changes associated with poorer executive function in BD. Our findings indicate that retinal thinning in specific macular layers may reflect underlying neurobiological processes associated with cognitive performance in this population. These results encourage further longitudinal studies to validate these associations and explore the biological mechanisms underlying these retinal changes, such as inflammation or shared pathophysiological factors. In clinical practice, we believe OCT could complement existing tools to improve the understanding and monitoring of cognitive impairment in BD, particularly by identifying individuals at risk of cognitive impairment. Its non-invasive design and relative cost-effectiveness make it an attractive option for broader clinical implementation, especially in psychiatric populations. In research, OCT offers an opportunity to explore transdiagnostic biomarkers of cognitive impairment, providing insights into shared mechanisms across mental health and neurodegenerative conditions. Future work should focus on integrating OCT findings with neuroimaging and other biological markers to advance the understanding of cognitive impairment and support the development of targeted, personalized interventions in BD.
FundingThis study had been funded by Instituto de Salud Carlos III through projects PI18/01055PI15/00789 (Co-funded by European Regional Development Fund/European Social Fund. Investing in your future) PI21/00713 and PI23/01367; the Basque Foundation for Health Innovation and Research (BIOEF); Networking Center for Biomedical Research in Mental Health (CIBERSAM) and the University of the Basque Country (GIC18/107).
Declaration of competing interestNone declared.
None declared.
The followings are the supplementary data to this article: