metricas
covid
Spanish Journal of Psychiatry and Mental Health Breaking down processing speed: Motor and cognitive insights in first-episode ps...
Journal Information
Visits
662
Original
Full text access
Available online 7 July 2024
Breaking down processing speed: Motor and cognitive insights in first-episode psychosis and unaffected first-degree relatives
Visits
662
Ángel Yorca-Ruiza,b, Rebeca Magdaleno Herreroa,b, Víctor Ortiz García de la Fozb,d, Nancy Murillo-Garcíaa,b, Rosa Ayesa-Arriolab,c,d,
Corresponding author
rayesa@humv.es

Corresponding author.
a Department of Molecular Biology, Faculty of Medicine, University of Cantabria, Santander, Spain
b Department of Psychiatry, Valdecilla Biomedical Research Institute, Santander, Spain
c Faculty of Psychology, National University of Distance Education (UNED), Madrid, Spain
d Biomedical Research Networking Center for Mental Health (CIBERSAM), Madrid, Spain
This item has received
Article information
Abstract
Full Text
Bibliography
Download PDF
Statistics
Figures (1)
Tables (4)
Table 1. Demographic variables and processing speed comparisons measures for FEP, parents, siblings, and controls.
Tables
Table 2. Pearson's correlations in processing speed measures for FEP, parents, siblings, and controls.
Tables
Table 3. Factorial analysis for control group.
Tables
Table 4. Goodness-of-fit statistics for confirmatory factor analyses.
Tables
Show moreShow less
Abstract
Introduction

Processing speed (PS) deficits represent a fundamental aspect of cognitive impairment, evident not only in schizophrenia but also in individuals undergoing their first episode of psychosis (FEP) and their unaffected first-degree relatives. Heterogeneity in tests assessing PS reflects the participation of motor and cognitive subcomponents to varying degrees. We aim to explore differences in performance of the subcomponents of PS in FEP patients, parents, siblings, and controls.
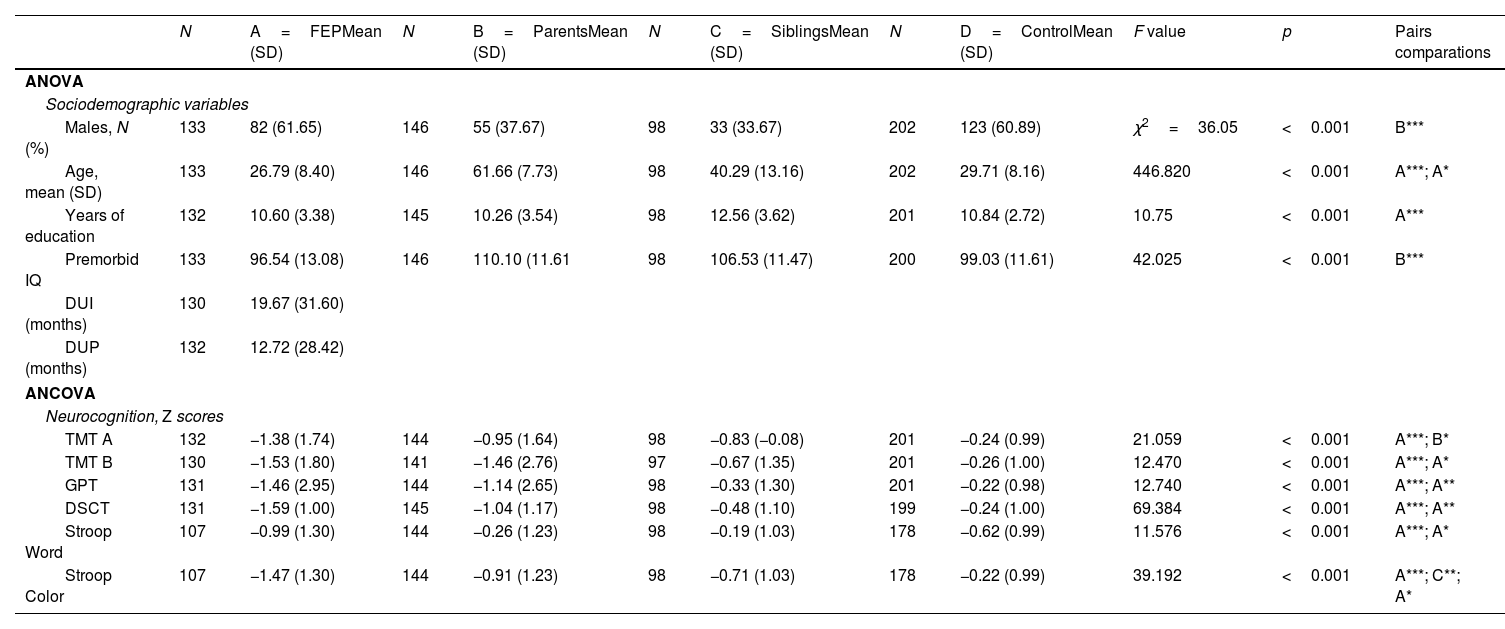
Materials and methods

Results from tests, including Trail Making Test part A and part B, Digit Symbol Coding Test, Grooved Pegboard Test, and Stroop Word and Stroop Color subtests, were obtained from 133 FEP patients, 146 parents, and 202 controls. Exploratory factor analysis (EFA) was employed in controls to establish the structure, followed by confirmatory factor analysis (CFA) to verify if the other groups share this structure.

Results

EFA revealed a two-factor model: Factor 1 for the motor subcomponent and Factor 2 for the cognitive subcomponent. Subsequently, CFA indicated a good fit for the remaining groups with differences in the relationship between the factors.

Conclusions

Differences in the relationships of factors within a common structure suggest the involvement of different compensatory strategies among groups, providing insights into the underlying mechanisms of PS deficits in patients and relatives.

Keywords:
Processing speed
Motor
First-episode psychosis
Cognitive
Dedifferentiation
Confirmatory factor analysis
Family
Full Text
Introduction

Deficits in processing speed (PS) represent a central feature within the spectrum of cognitive impairments observed in individuals with schizophrenia.1,2 This deficiency is not only manifested in patients with chronic schizophrenia but is also observable in those undergoing their first-episode of psychosis (FEP).3–5 Even individuals considered at higher clinical risk for developing this disorder, notably the younger population, exhibit discernible signs of PS deficit.6,7 These deficits have been identified in first-degree unaffected relatives of schizophrenia patients,8–13 thereby implicating a potential hereditary component. Given that PS is recognized as pivotal in overall cognition,14,15 slower PS performance is intrinsically associated with a reduced quality of life and declined functional capacity in the daily activities of the affected individuals.16–18

PS refers to the ability to identify, integrate, and respond quickly to visual and verbal information. It is assessed by tests that measure the efficiency with which a person performs basic.19 Although these tests do not assess higher-level thinking, they do require simple decision-making. Results reflect both speed and accuracy in specific procedures, revealing process automation and efficiency in the early stages of information processing (e.g., visual or auditory discrimination) and speed of decision-making.19,20 The Symbol Coding (SC) subtest from Brief Assessment of Cognition in Schizophrenia (BACS),21 is considered by the MATRICS initiative the gold standard to assess PS in schizophrenia.22 The Digits Symbol (DS), from the WAIS-III Digit Symbol subtest (DS)40 has emerged as one of the most affected in individuals with this disorder.23 However, interpreting deficits observed in tasks like SC solely as indicative of PS proficiency may be misleading, as this task may also depend on a combination of cognitive abilities. Other tests are employed to assess PS, ranging from tasks involving simple motor actions, such as the Grooved Pegboard Test,24 Token Motor Test,25 and parts A and B of the Trail Making Test,26 to more complex assessments such as SC and Stroop Word and Color subtests.27 In this regard, previous research has suggested that performance on this task may depend more on complex cognitive abilities, such as memory and executive function, rather than on mere basic psychomotor speed.28–31

The exploration of the subcomponents that could constitute the PS domain has been previously addressed.29,30 Specifically, neuropsychological research defines all the subprocesses that occur before the initiation of movement as cognitive or response selection and the subprocesses involved in the initiation, coordination, and execution of movement as motor execution.32 Moreover, the literature suggests that slow PS in schizophrenia could be the consequence of dysfunction in the cognitive or response selection stage, where the translation of stimulus-response and decision-making occurs.33–35 This phenomenon has also been observed in unaffected relatives.8–10 However, the results in motor execution are less consistent.1,36

This study aims to explore the differences in the motor and cognitive subcomponents for the PS domain. In order to address this issue, an exploratory factor analysis (EFA) and a confirmatory factor analysis (CFA) were carried out. We postulated that the different subcomponents of PS, will display distinct patterns across FEP patients, parents, siblings, and controls. Among them, patients will present the largest differentiation, and parents and siblings will show less pronounced variations. Understanding these differences could provide insights into the subcomponents influencing in PS and their heritability.

Materials and methodsParticipants

Participants were recruited from two projects: the Program for Initial Phases of Psychosis (PAFIP) and PAFIP-FAMILIAS, both conducted at the University Hospital Marqués de Valdecilla in Cantabria, Spain. FEP patients, were recruited from 2001 to 2018 as part of the PAFIP program and were referred from various mental health services in the region of Cantabria, representing the local community. Further details on recruitment and sample selection are available at Pelayo-Terán et al.37 The total sample for the present study was formed by 579 participants, including 133 FEP, 146 parents, 98 siblings, and 202 healthy control (HC) groups. FEP participants met specific inclusion criteria: they were aged between 15 and 60 years and resided within the study. Diagnoses were confirmed through the use of the Structured Clinical Interview for DSM-IV (SCID-I)38 conducted by an experienced psychiatrist within 6 months of the baseline visit and met diagnostic criteria for schizophrenia (N=61), schizophreniform disorder (N=38), brief psychotic disorder (N=15), psychosis not otherwise specified (N=14), and schizoaffective disorder (N=4). Data were collected on the duration of untreated illness (DUI), defined as the time from the first nonspecific symptom related to psychosis, and duration of untreated psychosis (DUP) defined as the time from the first continuous psychotic symptom to initiation of adequate antipsychotic drug treatment were collected. FEP had not received treatment with antipsychotics or medication administration six weeks before admission. Parents, siblings, and HC participants also met distinct inclusion criteria: they were over 15 years of age, proficient in the Spanish language, and had no psychiatric diagnosis, brain pathology, intellectual disability (according to DSM-IV), or substance use disorders (according to DSM-IV). HC were matched for sex, age, and years of education with the FEP patients. All participants were informed about the characteristics of the study and signed the informed consent document showing their agreement to participate. Approval for both PAFIP and PAFIP-FAMILIAS projects was obtained from the ethics committee (CEIm Cantabria), adhering to international ethical standards (approval numbers NCT0235832 and 2017.247).

Neuropsychological assessment

The evaluation required approximately 90min and was carried out on the same day by the same expert neuropsychologists. All participants, FEP, their first-degree relatives and healthy volunteers completed the following assessment: (1) Rey Auditory Verbal Learning Test (RAVLT)39; (2) WAIS III Digit Symbol subtest (DS)40; (3) Grooved Pegboard Test (GPT)26; (4) Tower of London Test (ToL)41; (5) Rey Complex Figure (RCF)42; (6) Trail Making Test (TMT)43 (Trail A and B); (7) WAIS III digits forward and backward subtests40; (8) WAIS III subtest of Vocabulary of premorbid IQ26; (9) Stroop Test27 (word-color); (10) Eyes Task44; (15) Continuous Performance Test (CPT).45

Statistical analysesData preparation

We have selected those PS tests that include the measurement in time for its fulfillment, thus remaining as follows: psychomotor speed: Trail Making Test part A (TMT A), execution time26; executive functions, cognitive flexibility: Trail Making Test part B (TMT B), execution time26; psychomotor speed: Digit Symbol subtest from WAIS-III, number of completed boxes within a specified time40; Fine motor skill: Grooved Pegboard Test, execution time24; reading processing speed: Stroop Word, total words read27; processing speed: Stroop Color, total designated colors.27 The reaction time subtest of the Continuous Performance Test45 was initially included. However, due to its low factor loading (0.28), we determined that its contribution to the model was limited, and it was subsequently removed. The EFA was then conducted with the tests mentioned in “Methods” section.

Data normality was assessed using the Kolmogorov–Smirnov test in IBM SPSS Statistics version 19.0.46 Based on the results, non-parametric variables were transformed using logarithmic and square root transformations. Participants with missing data were excluded from the analysis. The scores of the TMT A, TMT B, and Grooved Pegboard Test were reversed so that lower scores indicated poorer performance, consistent with the direction of the other scores.

Demographic characteristics and PS measurement analysis

Analysis of variance (ANOVA) was employed to examine differences among groups for variables such as sex, age, years of education, and premorbid IQ. To explore differences between groups in PS assessment, analysis of covariance (ANCOVA) was utilized, with sex, age, and years of education included as covariates to account for potential confounding variables. Post hoc Bonferroni tests were applied in all analyses to discern specific differences between pairs. Furthermore, Pearson correlations were applied among PS measures within each of the groups to explore the relationship between them.

Exploratory factor analysis (EFA)

Statistical Package for Social Science version 19.0 SPSS46 y AMOS47 was used for all analyses. The EFA was conducted on the groups of FEP patients, siblings, parents, and controls intending to identify the same latent cognitive architecture. Principal component analysis followed by Promax rotation was performed, as it is expected that the factors would be correlated. The Kaiser–Meyer–Oklin (KMO) index and Bartlett's test of sphericity were used to assess the suitability of the data for principal component analysis. Furthermore, a screen plot (also known as a sedimentation plot) was visually inspected to determine the number of factors to retain. This plot illustrates the amount of variance explained by each factor as a function of its number. The goal is to identify the point where the decline in explained variance levels off, indicating the optimal number of factors to retain. During the analysis, variables that did not have a factor loading of at least 0.40 in any of the identified factors were excluded. Additionally, factors that consisted of fewer than two variables were eliminated.

Confirmatory factor analysis (CFA)

The factorial model resulting from the EFA obtained in the control group was used to fit the data of the patients, siblings, and parents. The fit was evaluated with two different models, one with a single latent factor and another with two latent factors. Subsequently, each model was assessed using different goodness-of-fit statistics to determine the adequacy of the model. Chi-square (CMIN): compares the differences between observed correlations and the correlations expected according to the model. Lower values indicate a good fit. Chi-square to degrees of freedom ratio (CMIN/DF): Values close to 1 or less than 3 indicate a good fit to the model. Comparative Fit Index (CFI): compares the proposed model with a null model assuming no relationship between variables. A value close to 1 indicates a good fit, with values above 0.90 considered acceptable. Root mean square error of approximation (RMSEA): measures the average discrepancy between observed and estimated correlations of the model, adjusted for the number of degrees of freedom. Values less than 0.005 are considered excellent, between 0.05 and 0.08 indicate a good fit, and values greater than 0.10 suggest a poor fit. Tucker-Lewis Index (TLI): similar to CFI, it compares the proposed model with a null model. TLI values above 0.90 indicate a good model fit. Bentler-Bonett Non-Normed Fit Index (NFI): compares the proposed model with a null model. NFI values above 0.90 indicate a good model fit. Akaike Information Criterion (AIC): a measure of model quality that considers both model fit and complexity. Lower AIC values indicate a better fit. According to the model fit indices, we identified which model – single factor or two factors – best fit the data for each subsample.

ResultsDemographic and PS measures

Ninety-eight percent of the FEP patients were identified as Caucasian. Significant differences were found for age (p<0.001), years of education (p<0.001), and premorbid IQ (p<0.001) (Table 1). FEP patients were younger than their siblings and their parents. Siblings completed more years of education than FEP patients, parents, and HC.

Table 1.

Demographic variables and processing speed comparisons measures for FEP, parents, siblings, and controls.

  N  A=FEPMean (SD)  N  B=ParentsMean (SD)  N  C=SiblingsMean (SD)  N  D=ControlMean (SD)  F value  p  Pairs comparations 
ANOVA
Sociodemographic variables
Males, N (%)  133  82 (61.65)  146  55 (37.67)  98  33 (33.67)  202  123 (60.89)  χ2=36.05  <0.001  B*** 
Age, mean (SD)  133  26.79 (8.40)  146  61.66 (7.73)  98  40.29 (13.16)  202  29.71 (8.16)  446.820  <0.001  A***; A* 
Years of education  132  10.60 (3.38)  145  10.26 (3.54)  98  12.56 (3.62)  201  10.84 (2.72)  10.75  <0.001  A*** 
Premorbid IQ  133  96.54 (13.08)  146  110.10 (11.61  98  106.53 (11.47)  200  99.03 (11.61)  42.025  <0.001  B*** 
DUI (months)  130  19.67 (31.60)                   
DUP (months)  132  12.72 (28.42)                   
ANCOVA
Neurocognition, Z scores
TMT A  132  −1.38 (1.74)  144  −0.95 (1.64)  98  −0.83 (−0.08)  201  −0.24 (0.99)  21.059  <0.001  A***; B* 
TMT B  130  −1.53 (1.80)  141  −1.46 (2.76)  97  −0.67 (1.35)  201  −0.26 (1.00)  12.470  <0.001  A***; A* 
GPT  131  −1.46 (2.95)  144  −1.14 (2.65)  98  −0.33 (1.30)  201  −0.22 (0.98)  12.740  <0.001  A***; A** 
DSCT  131  −1.59 (1.00)  145  −1.04 (1.17)  98  −0.48 (1.10)  199  −0.24 (1.00)  69.384  <0.001  A***; A** 
Stroop Word  107  −0.99 (1.30)  144  −0.26 (1.23)  98  −0.19 (1.03)  178  −0.62 (0.99)  11.576  <0.001  A***; A* 
Stroop Color  107  −1.47 (1.30)  144  −0.91 (1.23)  98  −0.71 (1.03)  178  −0.22 (0.99)  39.192  <0.001  A***; C**; A* 

DUI: duration of untreated illness; DUP: duration of untreated psychosis; TMT A: Trail Making Test part A; TMT B: Trail Making Test part B; DSCT: Digit Symbol Coding Test; GPT: Grooved Pegboard Test.

*

p<0.05.

**

p<0.01.

***

p<0.001.

Table 1 presents the results obtained from the processing PS tests, showing significant differences in all tests: SC (F=69.384, p<0.01); Stroop Color (F=39.192, p<0.01); TMT A (F=21.059, p<0.01); GPT (F=12.740, p<0.01); TMT B (F=12.470, p<0.01); and Stroop Word (F=11.576, p<0.01). The FEP patients obtained the lowest scores in all tests compared to the sibling, parent, and control groups. Post-hoc tests showed that first-degree relatives obtained intermediate scores between the controls and patients, except for the Stroop Color test, where the siblings group scored lower than the other groups.

Additionally, Pearson correlations were conducted to examine the relationship between the different PS tests in each group, as shown in Table 2. The results revealed that in the FEP patient group, there were significant positive correlations between TMT A and TMT B (r=0.625, p<0.001); GPT (r=0.611, p<0.001); and SC (r=0.512, p<0.001). Furthermore, significant correlations were found between TMT B and SC (r=0.531, p<0.001). In the sibling group, a significant correlation was observed between Stroop Color and Stroop Word tests (r=0.597, p<0.001). In the parent group, significant correlations were found between TMT A and TMT B (r=0.506, p<0.001); SC and TMT B (r=0.503, p<0.001); and SC and Stroop Word (r=0.500, p<0.001). Finally, in the control group, significant correlations were obtained between Stroop Word and Stroop Color tests (r=0.594, p<0.001).

Table 2.

Pearson's correlations in processing speed measures for FEP, parents, siblings, and controls.

  TMT A  TMT B  Pegboard  DSCT  Stroop W  Stroop C 
FEP patients
TMT A  .625***  .611***  .512***  .431***  .359*** 
TMT B    .453***  .531***  .321**  .440*** 
GPT      .357***  .158  .356*** 
DSCT        .288**  .447*** 
Stroop Word          .279** 
Stroop Color           
Siblings
TMT A  .388**  .254*  .379***  .208*  .371*** 
TMT B    .124  .366***  .224*  .279* 
GPT      .438***  .253*  .181 
DSCT        .498***  .495*** 
Stroop Word          .597*** 
Stroop Color           
Parents
TMT A  .506***  .323***  .443***  .342***  .333** 
TMT B    .391***  .503***  .406***  .385** 
GPT      .349***  .223*  .262** 
DSCT        .500***  .544** 
Stroop Word          .667** 
Stroop Color           
Controls
TMT A  .446***  .112*  .353***  .260**  .317** 
TMT B    .313***  .404***  .209**  .297** 
GPT      .261***  .111  .103 
DSCT        .230**  .413** 
Stroop Word          .594** 
Stroop Color           

TMT A: Trail Making Test part A; TMT B: Trail Making Test part B; DSCT: Digit Symbol Coding Test; GPT: Grooved Pegboard Test; FEP: first episode of psychosis.

*

p<0.05.

**

p<0.01.

***

p<0.001.

Exploratory factor analysis (EFA)

The EFA (Table 3) was performed using the principal component extraction method with Promax rotation, with the control group as the reference. The adequacy of the data for EFA was examined using Bartlett's test of sphericity, which was significant (χ2=225.41, p<0.001), and KMO measure of sampling adequacy, which was 0.732, indicating that the data were suitable for factor analysis. Two eigenvalues greater than 1 were observed in the analysis, suggesting the presence of two significant factors. The two-factor solution accounted for 62.9% of the total variance, with Factor 1 explaining 45.09% of the variance and Factor 2 explaining 17.85%.

Table 3.

Factorial analysis for control group.

Loadings  Factor
 
TMT B  0.733  0.264 
GPT  0.727  0.120 
DSCT  0.670  0.313 
TMT A  0.571  0.389 
Stroop Word  0.079  0.870 
Stroop Color  0.230  0.852 
Using principal components analysis

TMT A: Trail Making Test part A; TMT B: Trail Making Test part B; DSCT: Digit Symbol Coding Test; GPT: Grooved Pegboard Test. Bold values indicate the highest loadings, highlighting each test's main association with the factors.

The correlation matrix between the variables and factors revealed patterns consistent with the expected theoretical structure. In Factor 1, the TMT A, TMT B, Grooved Pegboard, and SC tests showed significant factor loadings (p<0.05) of .571, .733, .727, and .733, respectively. These results suggest that these tests are closely related and contribute significantly to Factor 1, which could be interpreted as a global measure of PS and motor coordination abilities. On the other hand, in Factor 2, only the Stroop Word and Stroop Color tests showed significant factor loadings (p<0.05) of .870 and .852, respectively. This suggests that these tests share a closer relationship and may reflect a specific component of cognitive inhibition or selective attention ability.

Confirmatory factor analysis (CFA)

Table 4 presents various fit indices for the CFA of the FEP, siblings, parents, and control groups. Comparisons between the one-factor and two-factor models in each group showed a better fit for the two-factor model. The goodness-of-fit indices for the two-factor model indicated values of CMIN p<0.05, CMIN/df less than 3, CFI greater than 0.9, RMSEA below 0.6, TLI greater than 0.9, NFI >0.9, and similar AIC values across all groups. The FEP group differed in CMIN (p=0.01) and TLI (0.87) indices.

Table 4.

Goodness-of-fit statistics for confirmatory factor analyses.

  df  χ2  p  CMIN/df  AIC  CFI  TLI  NFI  RMSEA 
Measurement models
Controls
Two-factor model  13,032  0.111  1,629  51,032  0.981  0.949  0.953  0.035 
One-factor model  55,545  0.000  6,172  91,545  0.820  0.521  0.802  0.100 
Parents
Two-factor model  13,271  0.103  1,659  51,271  0.986  0.964  0.968  0.036 
One-factor model  40,857  0.000  4,540  76,857  0.918  0.809  0.900  0.082 
Siblings
Two-factor model  13,607  0.093  1,701  51,607  0.971  0.923  0.936  0.037 
One-factor model  27,871  0.001  3,097  63,871  0.901  0.769  0.868  0.063 
FEP
Two-factor model  18,794  0.016  2,349  56,794  0.952  0.873  0.923  0.510 
One-factor model  19,248  0.023  2,139  55,248  0.954  0.893  0.921  0.047 

Df: degrees of freedom; AIC: Akaike Information Criterion; CFI: Comparative Fit Index; TLI: Tucker-Lewis Index; NFI: Bentler-Bonett Non-Normed Fit Index; RMSEA: root mean square error of approximation.

In Fig. 1, the two-factor model grouped the TMT A, TMT B, SC, and GPT under Factor 1, and the Stroop Word and Stroop Color tests under Factor 2. The correlation between the two latent factors varied in each group, with higher correlations observed in patients (r=0.92, p<0.05), parents (r=0.82, p<0.05), siblings (r=0.77, p<0.05), and controls (r=0.62, p<0.05).

Fig. 1.

Loading factors for FEP patients, parents, siblings and, control groups. TMT A: Trail Making Test part A; TMT B: Trail Making Test part B; DS: Digit Symbol; GPT: Grooved Pegboard Test.

Standardized loadings between the tests showed differences between the groups. FEP patients had higher loadings in Factor 1 for the TMT A (0.85), TMT B (0.79), and GPT (0.69) tests. The parent's group showed high loadings in Factor 1 for the SC (0.87) and TMT B (0.78), as well as in Factor 2 for both the Stroop Word (0.82) and Stroop Color (0.89) tests. In the siblings group, strong loadings were observed for the SC (0.90) in Factor 1, and for the Stroop Word (0.84) and Stroop Color (0.74) in Factor 2. Finally, in the control group, significant loadings were observed for the TMT B (0.72) and SC (0.72) in Factor 1, and for the Stroop Color (0.92) in Factor 2.

Discussion

In this study, we aimed to identify the underlying structure of a set of PS tests using a comprehensive approach that involved both EFA and CFA. Our sample encompassed patients with an FEP, their first-degree relatives (parents and siblings), and a control group. The results revealed a two-factor structure with good fit indices for each of the groups. The relationship between factors and the observed variables provided us with a detailed insight into how different components of PS might be affected in FEP patients and their first-degree relatives.

The EFA and CFA revealed that the groups shared a similar underlying structure in PS. What truly set these groups apart were the interrelationships between the factors and the observed variables. In particular, we observed a notably high correlation between the motor subcomponent and cognitive subcomponent in the FEP patients’ group, whereas, in the parents and siblings groups, values fell in between those of the patients and controls. The differences in these correlations could refer to the hypothesis of cognitive dedifferentiation, resulting in a loss of functional specialization of various cognitive functions, leading to difficulties in performing different cognitive tasks and increased overlap in the mental processes involved.48 Knowles et al.,29 suggest that cognitive dedifferentiation, considered part of the normal cognitive decline associated with aging, may be present in individuals with schizophrenia. This hypothesis is based on the idea that, during the aging process, biological changes in the brain increase the overlap between specific cognitive abilities. Therefore, patients with schizophrenia may be more susceptible to the cognitive effects of aging than healthy controls.49 Additionally, the neurodevelopmental hypothesis proposes that the pruning of redundant synaptic connections,50 which typically occurs in adolescence to enhance the efficiency and specialization of cortical regions, is aberrant in schizophrenia. This anomaly could contribute to the cognitive deficits observed in childhood and the developmental delay during adolescence in individuals who develop schizophrenia. These findings, previously observed in patients with schizophrenia,29,51 may also be seen to some extent in their first-degree relatives.

The results obtained in the sibling group are consistent with a prior study led by Dickinson et al.,52 where they found intermediate cognitive dedifferentiation between siblings of patients with schizophrenia and controls. The dedifferentiation observed in parents might be more closely associated with hereditary factors than with aging.53,54 Furthermore, age has been controlled as a covariate in the present study. In addition, the dedifferentiation hypothesis is supported by previous research indicating that genetic predisposition plays a significant role in cognitive functioning and may contribute to variations in PS among family members.37,55 A previous study in our group showed a gradient of deficit among patients, relatives, and healthy controls in PS.13 The persistence of dedifferentiation across family relationships suggests that deficits in PS might be related to genetic risk. Each group appears to develop specific compensatory strategies based on the level of impairment to address the different tests,56 suggesting the possibility that patients may have an excessive dependence on prefrontal effortful processing.52 However, further research is needed to explore the specific genetic mechanisms underlying this phenomenon.

The EFA in the control group revealed the existence of two underlying factors in the PS tests. Factor 1 appears to be primarily associated with tests involving visual stimuli and motor responses, labeled as the motor subcomponent due to their pencil-and-paper modality. On the other hand, Factor 2 could be interpreted as related to tests involving visual stimuli and verbal responses, also designated as the cognitive subcomponent. Our results align with those obtained by Woodward et al.55 The study investigates dysfunction in response selection in individuals with schizophrenia, demonstrating that it affects both sensory and motor modalities. Our results would be consistent with the study, as those tests belonging to response selection, such as the DS and the Stroop tests, obtained lower factor loadings in the patient group compared to their siblings, parents, and controls.

Furthermore, in this study, we observed that 6 measures of PS were differently associated in each of the groups. By examining the factorial loadings from the CFA, we could say that the tests composing the cognitive subcomponent present a different motor and cognitive degree involvement in their execution. While tests like GPT could be classified as simple fine motor response tests, the TMT A might increase the cognitive demand by incorporating a number sequencing task, and the TMT B would add executive functions (cognitive flexibility) to the task by alternating between letters and numbers.57,58 Finally, the DS could be labeled as the test with a motor response and a higher cognitive and response selection load due to its multi-component nature.1,59 Patients exhibited higher factor loadings in tests with a greater motor demand, such as TMT A, TMT B, and GPT, and lower factor loadings in tests with a higher cognitive demand, like the DS suggesting that patients perform better in tasks that require simple motor responses compared to tests involving more complex cognitive processes. From the findings related to motor subcomponent, it can be suggested that individuals with FEP may show better performance on tasks involving simple motor responses, as opposed to more complex tasks such as those involving planning time in response, which is consistent with previous studies.60–62 Similarly, the cognitive subcomponent, where the Stroop Word and Stroop Color tests are enclosed, showed that patients had the lowest factor loadings. This could be due to a higher involvement of language-related cognitive processes. Particularly, in the Stroop Color test, participants must name the color of a non-verbal stimulus (“XXXX” in colors), which involves several actions, such as lexical access to name the color and the inhibition of competitive responses, implicating processes that might be related to cognitive sub-processes or response selection.33,35

Additionally, the covariance analyses revealed that the Stroop Color test was the sole task exhibiting significant differences between siblings and controls, suggesting the heritability of deficits in PS, specifically in response selection processes or cognitive sub-processes.10,63 Neuroimaging studies have also described this feature,10,64 providing insights into the underlying neurobiological basis of the deficit. On the other hand, parents, in addition to showing significant differences compared to controls in the Stroop Color test, also exhibited differences in the DS, with the preservation of more motor tests like TMT A and B, where no differences were observed. This could be indicative of a continuum where the severity of the illness correlates negatively with fine motor skills. The literature shows patients with chronic schizophrenia had significantly worse performance in fine motor skills and motor speed measures compared to those with recent-onset psychosis.36 This is consistent with the finding that fine motor control deteriorates when illness progresses.65,66 There is also evidence that fine motor skill distinguishes young individuals at high risk of developing schizophrenia who transition to full psychosis from those who do not.67 In our case, this effect might also be present in first-degree relatives, where good performance in fine motor skills could be interpreted as a protective factor against the severity of symptoms.

Several limitations should be considered in this study. First, the tests used were not specific for motor and cognitive subcomponents but approximations of specific functions. This could be addressed by employing tests such as the Parametric DS68,69 and digitizing tablets70 to assess response selection time more precisely, or tests oriented to measure the motor subcomponent such as the Token Motor Test.25 Second, the absence of verbal fluency measures, which have been linked to PS, could provide relevant information about the relationship between PS and verbal fluency in patients with schizophrenia.28,71 Third, the homogeneity of the sample concerning its origins. It would be interesting in future studies to examine the various subcomponents of PS in other populations. Regarding the participants’ sex, men are highly represented in the patient group, whereas in the relatives group, the majority are women. In future research, it would be interesting to explore potential sex differences underlying motor and cognitive subcomponents in PS.

Previous studies have focused on factor analyses of DS, but this work considers the inclusion of other tests commonly used to assess PS to gain a broader understanding of the underlying processes. The strengths of this study benefit from a large sample size that includes parents, siblings, and FEP patients, allowing us to explore parameters related to kinship and heritability. The presence of PS deficits at early ages and in first-degree relatives could enable the use of this parameter as an early biomarker for schizophrenia, aiding in the identification of high-risk individuals. Considering PS in the assessment and treatment of schizophrenia provides a foundational framework for the development of more specific preventive and effective therapeutic interventions, as well as its applicability to patients through cognitive remediation treatments. The importance of PS cannot be overstated, as it is closely intertwined with overall cognition and functionality, significantly impacting the quality of life for both patients and their caregivers.

Conclusions

The results of the current study suggest that motor and cognitive dedifferentiation can be observed in first-degree relatives of patients with a first episode of psychosis. Furthermore, the uneven involvement of different structural factors suggests the participation of different compensatory strategies among the groups, which could provide insights into the underlying mechanisms of PS. Identifying the specific sub-processes underlying PS would facilitate a more comprehensive exploration of a pivotal domain of cognitive function in schizophrenia.

Funding

The PAFIP-FAMILIES project was funded by the ISCIII (FIS PI17/00221). Rosa Ayesa-Arriola is funded by Miguel Servet contract from the ISCIII (CP18/00003) and predoctoral contract (Ángel Yorca-Ruiz; PFIS: F1/00162) from the Valdecilla Biomedical Research Institute and the University of Cantabria. Rebeca Magdaleno Herrero and Nancy Murillo-García received funding from Grants PREVAL22/03 and BOC49, REF. IDI-13, respectively, from the Fundación Marqués de Valdecilla. In addition ISCIII (PI20/00066, CNS2022-136110, PI23/00076) and IDIVAL (INNVAL20/02, INNVAL23/21) projects have financing in progress.

Authors’ contributions

All the authors have participated and have made substantial contributions to this paper.

AYR: conception, design, statistical analysis, interpretations of results and drafting the article.

RMH and NMG: interpretations of results and revising the article.

VOGF: database management.

RAA: conception, design, interpretations of results, revising the article and resources.

Conflict of interest

The authors have no conflict of interest to declare.

Data availability statement

The data supporting the findings of this article is available upon request from the corresponding author, RAA.

Acknowledgements

The authors wish to thank all “Programa de Atención a Fases Iniciales de Psicosis” (PAFIP) research team, and especially all patients and family members who participated in the study.

References
[1]
D. Dickinson, M.E. Ramsey, J.M. Gold.
Overlooking the obvious: a meta-analytic comparison of digit symbol coding tasks and other cognitive measures in schizophrenia.
Arch Gen Psychiatry, 64 (2007), pp. 532-542
[2]
R. Andersen, B. Fagerlund, H. Rasmussen, et al.
The influence of impaired processing speed on cognition in first-episode antipsychotic-naïve schizophrenic patients.
Eur Psychiatry, 28 (2013), pp. 332-339
[3]
M. Aas, P. Dazzan, V. Mondelli, I. Melle, R.M. Murray, C.M. Pariante.
A systematic review of cognitive function in first-episode psychosis, including a discussion on childhood trauma, stress, and inflammation.
Front Psychiatry, 4 (2014), pp. 182
[4]
H. Fatouros-Bergman, S. Cervenka, L. Flyckt, G. Edman, L. Farde.
Meta-analysis of cognitive performance in drug-naïve patients with schizophrenia.
Schizophr Res, 158 (2014), pp. 156-162
[5]
G. Faber, H.G. Smid, A.R. Van Gool, L. Wunderink, D. Wiersma, R.J. van den Bosch.
Neurocognition and recovery in first episode psychosis.
Psychiatry Res, 188 (2011), pp. 1-6
[6]
I. Kelleher, A. Murtagh, M.C. Clarke, J. Murphy, C. Rawdon, M. Cannon.
Neurocognitive performance of a community-based sample of young people at putative ultra high risk for psychosis: support for the processing speed hypothesis.
Cogn Neuropsychiatry, 18 (2013), pp. 9-25
[7]
E.S. Kappenman, S.J. Luck, A.M. Kring, et al.
Electrophysiological evidence for impaired control of motor output in schizophrenia.
Cereb Cortex, 26 (2016), pp. 1891-1899
[8]
P. Birkett, T. Sigmundsson, T. Sharma, et al.
Reaction time and sustained attention in schizophrenia and its genetic predisposition.
Schizophr Res, 95 (2007), pp. 76-85
[9]
S.A. Meda, M. Bhattarai, N.A. Morris, et al.
An fMRI study of working memory in first-degree unaffected relatives of schizophrenia patients.
Schizophr Res, 104 (2008), pp. 85-95
[10]
N.D. Woodward, B. Waldie, B. Rogers, P. Tibbo, P. Seres, S.E. Purdon.
Abnormal prefrontal cortical activity and connectivity during response selection in first episode psychosis, chronic schizophrenia, and unaffected siblings of individuals with schizophrenia.
Schizophr Res, 109 (2009), pp. 182-190
[11]
L. Schäppi, K. Stegmayer, P.V. Viher, S. Walther.
Distinct associations of motor domains in relatives of schizophrenia patients – different pathways to motor abnormalities in schizophrenia?.
Front Psychiatry, 9 (2018), pp. 129
[12]
B.E. Snitz, A.W. Macdonald, C.S. Carter.
Cognitive deficits in unaffected first-degree relatives of schizophrenia patients: a meta-analytic review of putative endophenotypes.
Schizophr Bull, 32 (2006), pp. 179-194
[13]
Á. Yorca-Ruiz, N. Murillo-García, R. Magdaleno Herrero, et al.
Processing speed in the first episode of psychosis and first-degree relatives: a candidate endophenotype of spectrum schizophrenia disorders.
Neuropsychology, 38 (2024), pp. 357-367
[14]
M. Rodriguez, Y. Zaytseva, A. Cvrčková, et al.
Cognitive profiles and functional connectivity in first-episode schizophrenia spectrum disorders – linking behavioral and neuronal data.
Front Psychol, 10 (2019),
[15]
R.S.E. Keefe, R.M. Bilder, P.D. Harvey, et al.
Baseline neurocognitive deficits in the CATIE schizophrenia trial.
Neuropsychopharmacology, 31 (2006), pp. 2033-2046
[16]
J.S. Brekke, A. Raine, M. Ansel, T. Lencz, L. Bird.
Neuropsychological and psychophysiological correlates of psychosocial functioning in schizophrenia.
Schizophr Bull, 23 (1997), pp. 19-28
[17]
J.M. Gold, R.W. Goldberg, S.W. McNary, L.B. Dixon, A.F. Lehman.
Cognitive correlates of job tenure among patients with severe mental illness.
Am J Psychiatry, 159 (2002), pp. 1395-1402
[18]
A. Malla, J. Payne.
First-episode psychosis: psychopathology, quality of life, and functional outcome.
Schizophr Bull, 31 (2005), pp. 650-671
[19]
T.A. Salthouse.
The processing-speed theory of adult age differences in cognition.
Psychol Rev, 103 (1996), pp. 403-428
[20]
E.E.M. Knowles, A.S. David, A. Reichenberg.
Processing speed deficits in schizophrenia: reexamining the evidence.
AJP, 167 (2010), pp. 828-835
[21]
S. Joy, D. Fein, E. Kaplan.
Decoding digit symbol: speed, memory, and visual scanning.
Assessment, 10 (2003), pp. 56-65
[22]
K.H. Nuechterlein, M.F. Green, R.S. Kern, et al.
The MATRICS consensus cognitive battery, part 1: test selection, reliability, and validity.
Am J Psychiatry, 165 (2008), pp. 203-213
[23]
J. Schaefer, E. Giangrande, D.R. Weinberger, D. Dickinson.
The global cognitive impairment in schizophrenia: consistent over decades and around the world.
Schizophr Res, 150 (2013), pp. 42-50
[24]
J. Tiffin, E.J. Asher.
The Purdue Pegboard: norms and studies of reliability and validity.
J Appl Psychol, 32 (1948), pp. 234
[25]
R.S.E. Keefe, T.E. Goldberg, P.D. Harvey, J.M. Gold, M.P. Poe, L. Coughenour.
The brief assessment of cognition in schizophrenia: reliability, sensitivity, and comparison with a standard neurocognitive battery.
Schizophr Res, 68 (2004), pp. 283-297
[26]
M.D. Lezak.
Neuropsychological Assessment.
3rd ed., (1995),
[27]
C.J. Golden, S.M. Freshwater.
Stroop Color and Word Test.
(1978),
[28]
K.H. Nuechterlein, D.M. Barch, J.M. Gold, T.E. Goldberg, M.F. Green, R.K. Heaton.
Identification of separable cognitive factors in schizophrenia.
Schizophr Res, 72 (2004), pp. 29-39
[29]
E.E.M. Knowles, M. Weiser, A.S. David, et al.
Dedifferentiation and substitute strategy: deconstructing the processing-speed impairment in schizophrenia.
Schizophr Res, 142 (2012), pp. 129-136
[30]
M. Cella, T. Wykes.
Understanding processing speed – its subcomponents and their relationship to characteristics of people with schizophrenia.
Cogn Neuropsychiatry, 18 (2013), pp. 437-451
[31]
G.N. Savla, E.W. Twamley, D.C. Delis, S.C. Roesch, D.V. Jeste, B.W. Palmer.
Dimensions of executive functioning in schizophrenia and their relationship with processing speed.
Schizophr Bull, 38 (2012), pp. 760-768
[32]
K.J. Osborne, S. Walther, S.A. Shankman, V.A. Mittal.
Psychomotor slowing in schizophrenia: implications for endophenotype and biomarker development.
Biomark Neuropsychiatry, 2 (2020), pp. 100016
[33]
N.D. Woodward, B. Duffy, H. Karbasforoushan.
Prefrontal cortex activity during response selection predicts processing speed impairment in schizophrenia.
J Int Neuropsychol Soc, 19 (2013), pp. 782-791
[34]
S. Krieger, S. Lis, B. Gallhofer.
Reaction-times and bioelectrical brain signals of drug-naive schizophrenic first-onset patients in identification and classification tasks.
Acta Psychiatrica Scand, 104 (2001), pp. 42-59
[35]
G. Pellizzer, M. Stephane.
Response selection in schizophrenia.
Exp Brain Res, 180 (2007), pp. 705-714
[36]
S. Sponheim, R. Jung, L. Seidman, et al.
Cognitive deficits in recent-onset and chronic schizophrenia.
J Psychiatr Res, 44 (2010), pp. 421-428
[37]
N. Murillo-García, A. Díaz-Pons, L.M. Fernández-Cacho, et al.
A family study on the first episode of psychosis patients: exploring neuropsychological performance as an endophenotype.
Acta Psychiatr Scand, 145 (2022), pp. 384-396
[38]
M. First, R. Spitzer, M. Gibbon, J. Williams.
Structured Clinical Interview for DSM-IV-TR Axis I Disorders Clinician Version (SCID-CV).
American Psychiatric Press, (2002),
[39]
A. Rey.
L’examen clinique en psychologie.
Presses Universitaires de France, (1964),
[40]
D. Wechsler.
The Wechsler Adults Intelligence Scale.
Psychological Corp., (1997),
[41]
R. Krikorian, J. Bartok, N. Gay.
Tower of London procedure: a standard method and developmental data.
J Clin Exp Neuropsychol, 16 (1994), pp. 840-850
[42]
P.A. Osterrieth.
Le test de copie d’une figure complexe; contribution à l’étude de la perception et de la mémoire.
Arch Psychol, 30 (1944), pp. 206-356
[43]
R.M. Reitan, D. Wolfson.
The Trail Making Test as an initial screening procedure for neuropsychological impairment in older children.
Arch Clin Neuropsychol, 19 (2004), pp. 281-288
[44]
S. Baron-Cohen, S. Wheelwright, T. Jolliffe.
Is there a “language of the eyes”? Evidence from normal adults, and adults with autism or Asperger syndrome.
Vis Cogn, 4 (1997), pp. 311-331
[45]
J. Cegalis, J. Bowlin.
Vigil: Software for the Assessment of Attention.
Forthought, (1991),
[46]
IBM SPSS Statistics for Windows.
IBM C, (2016),
[47]
I.S. Amos.
IBM SPSS Amos. IBM Software Business Analytics, YTD03114-U.
(2012), pp. 1-8
[48]
S.C. Li, U. Lindenberger.
Cross-level unification: a computational exploration of the link between deterioration of neurotransmitter systems and dedifferentiation of cognitive abilities in old age.
Cognitive Neuroscience of Memory, Hogrefe & Huber, (1999), pp. 103-146
[49]
B. Kirkpatrick, E. Messias, P.D. Harvey, E. Fernandez-Egea, C.R. Bowie.
Is schizophrenia a syndrome of accelerated aging?.
Schizophr Bull, 34 (2008), pp. 1024-1032
[50]
I. Feinberg.
Schizophrenia: caused by a fault in programmed synaptic elimination during adolescence?.
J Psychiatr Res, 17 (1982), pp. 319-334
[51]
D. Dickinson, J.D. Ragland, M.E. Calkins, J.M. Gold, R.C. Gur.
A comparison of cognitive structure in schizophrenia patients and healthy controls using confirmatory factor analysis.
Schizophr Res, 85 (2006), pp. 20-29
[52]
D. Dickinson, T.E. Goldberg, J.M. Gold, B. Elvevåg, D.R. Weinberger.
Cognitive factor structure and invariance in people with schizophrenia, their unaffected siblings, and controls.
Schizophr Bull, 37 (2011), pp. 1157-1167
[53]
P. Ghisletta, U. Lindenberger.
Age-based structural dynamics between perceptual speed and knowledge in the Berlin Aging Study: direct evidence for ability dedifferentiation in old age.
Psychol Aging, 18 (2003), pp. 696
[54]
J.D. Koen, M.D. Rugg.
Neural dedifferentiation in the aging brain.
Trends Cogn Sci, 23 (2019), pp. 547-559
[55]
V. Voráčková, P. Knytl, F. Španiel, P. Šustová, J. Renka, P. Mohr.
Cognitive profiles of healthy siblings of first-episode schizophrenia patients.
Early Interv Psychiatry, 15 (2021), pp. 554-562
[56]
J.R. da Cruz, A. Shaqiri, M. Roinishvili, et al.
Neural compensation mechanisms of siblings of schizophrenia patients as revealed by high-density EEG.
Schizophr Bull, 46 (2020), pp. 1009-1018
[57]
C.R. Bowie, P.D. Harvey.
Administration and interpretation of the Trail Making Test.
Nat Protoc, 1 (2006), pp. 2277-2281
[58]
J.A. Periáñez, M. Ríos-Lago, J.M. Rodríguez-Sánchez, et al.
Trail Making Test in traumatic brain injury, schizophrenia, and normal aging: sample comparisons and normative data.
Arch Clin Neuropsychol, 22 (2007), pp. 433-447
[59]
E.E.M. Knowles, M. Weiser, A.S. David, D.C. Glahn, M. Davidson, A. Reichenberg.
The puzzle of processing speed, memory, and executive function impairments in schizophrenia: fitting the pieces together.
Biol Psychiatry, 78 (2015), pp. 786-793
[60]
C. Bervoets, L. Docx, B. Sabbe, et al.
The nature of the relationship of psychomotor slowing with negative symptomatology in schizophrenia.
Cogn Neuropsychiatry, 19 (2014), pp. 36-46
[61]
B.J. Jogems-Kosterman, F.G. Zitman, J.J. Van Hoof, W. Hulstijn.
Psychomotor slowing and planning deficits in schizophrenia.
Schizophr Res, 48 (2001), pp. 317-333
[62]
M. Morrens, W. Hulstijn, J. Van Hecke, J. Peuskens, B.G.C. Sabbe.
Sensorimotor and cognitive slowing in schizophrenia as measured by the Symbol Digit Substitution Test.
J Psychiatr Res, 40 (2006), pp. 200-206
[63]
T.D. Cannon, M.O. Huttunen, J. Lonnqvist, et al.
The inheritance of neuropsychological dysfunction in twins is discordant for schizophrenia.
Am J Hum Genet, 67 (2000), pp. 369-382
[64]
A. Kuha, A. Tuulio-Henriksson, M. Eerola, et al.
Impaired executive performance in healthy siblings of schizophrenia patients in a population-based study.
Schizophr Res, 92 (2007), pp. 50-142
[65]
S. Gold, S. Arndt, P. Nopoulos, D.S. O’Leary, N.C. Andreasen.
Longitudinal study of cognitive function in first-episode and recent-onset schizophrenia.
Am J Psychiatry, 156 (1999), pp. 1342-1348
[66]
M.M. Kurtz, J.C. Seltzer, J.L. Ferrand, B.E. Wexler.
Neurocognitive function in schizophrenia at a 10-year follow-up: a preliminary investigation.
CNS Spectrums, 10 (2005), pp. 277-280
[67]
K.A. Hawkins, R.S. Keefe, B.K. Christensen, et al.
Neuropsychological course in the prodrome and first episode of psychosis: findings from the PRIME North America Double Blind Treatment Study.
Schizophr Res, 105 (2008), pp. 1-9
[68]
P. Bachman, A. Reichenberg, P. Rice, et al.
Deconstructing processing speed deficits in schizophrenia: application of a parametric digit symbol coding test.
Schizophr Res, 118 (2010), pp. 6-11
[69]
A.C. Amaresha, V. Danivas, V. Shivakumar, et al.
Clinical correlates of parametric digit-symbol substitution test in schizophrenia.
Asian J Psychiatr, 10 (2014), pp. 45-50
[70]
K.P. Grootens, L. Vermeeren, R.J. Verkes, et al.
Psychomotor planning is deficient in recent-onset schizophrenia.
Schizophr Res, 107 (2009), pp. 294-302
[71]
W.S. Kremen, L.J. Seidman, S.V. Faraone, T.M. Tsuang.
Is there disproportionate impairment in semantic or phonemic fluency in schizophrenia?.
J Int Neuropsychol Soc, 9 (2003), pp. 79
Copyright © 2024. Sociedad Española de Psiquiatría y Salud Mental (SEPSM)
Download PDF
Article options
Tools