


Due to the high incidence and aggressiveness of breast cancer, understanding specific factors associated with the profile of the disease is necessary. Thus, the study aimed to analyze data from 155 patients with breast cancer, grouping them according to their clinicopathological characteristics, attended at a reference hospital for Oncology, in 2015–2020, in the southwest region of Paraná, Brazil.
Material and MethodsUsing multivariate statistical analysis, sample data were divided into three clusters. The heterogeneity between clusters was obtained by Ward's method. The clinicopathological variables obtained from the patients' medical records were: the presence of intratumoral emboli and lymph nodes, menopausal status, molecular subtype, histological grade, TNM staging of the disease, tumor size, age at diagnóstico, weight, height, and body mass index.
ResultsIt is observed that 70% of the patients were in menopause at diagnóstico, 31.5% had tumors containing emboli, and 41% had positive lymph nodes. The prevalence of Luminal B subtype, intermediate histological grade, and TNM staging II was verified. The prevalence of the disease was higher in women aged over 50 years, representing 66% of cases. The BMI of the patients ranged from 17.63 kg/m2 to 51.26 kg/m2, with 73.55% above 25 kg/m2. Using the spatial distribution of patients, cluster analysis identified the regions with the worst averages of clinicopathological variables and the highest number of cancer cases.
ConclusionThrough the statistical analysis, it was possible to determine the heterogeneity of the data, so the patients were separated into three clusters. When analyzing the obtained clusters, each one of them had specific characteristics.
Debido a la alta incidencia y agresividad del cáncer de mama, es necesario el conocimiento de factores específicos asociados al perfil de la enfermedad. Así, el objetivo del estudio fue analizar datos de 155 pacientes con cáncer de mama, agrupándolas según sus características clínico-patológicas, atendidas en un hospital de referencia en Oncología, en el período 2015–2020, en la región suroeste de Paraná, Brasil.
Material y métodosA partir de la utilización de un análisis estadístico multivariado, los datos de la muestra se dividieron en tres grupos. La heterogeneidad entre clústeres se obtuvo mediante el método de Ward. Las variables clínico-patológicas obtenidas de la historia clínica de las pacientes fueron: presencia de émbolos y ganglios linfáticos intratumorales, estado menopáusico, subtipo molecular, grado histológico, estadificación TNM de la enfermedad, tamaño tumoral, edad al momento del diagnóstico, peso, talla, e índice de masa corporal.
ResultadosSe observa que el 70% de las pacientes se encontraba en menopausia al momento del diagnóstico, el 31,5% tenía tumores con émbolos y el 41% tenía ganglios positivos. Se verificó la prevalencia de subtipo luminal B, grado histológico intermedio y estadificación TNM II. La prevalencia de la enfermedad fue mayor en mujeres mayores de 50 años, lo que representa el 66% de los casos. El IMC de los pacientes osciló entre 17,63 kg/m2 y 51,26 kg/m2, con un 73,55% encima de 25 kg/m2. El análisis de clúster, utilizando la distribución espacial de pacientes, identificó las regiones con los peores promedios de variables clínico-patológicas y el mayor número de casos de cáncer.
ConclusiónA través del análisis estadístico fue posible determinar la heterogeneidad de los datos, por lo que las pacientes fueron separadas en tres grupos. Al analizar los clústeres obtenidos, pudo verificarse que cada uno de ellos presentaba características específicas.
Breast cancer is the most common malignant neoplasm in women.1 Age, over 50 years old, is the most critical risk factor.2 Other determining factors for the development of the disease are genetic, hereditary, late menopause, obesity, sedentary lifestyle, and frequent exposure to ionizing radiation.3,4 Such factors are mainly responsible for the clinicopathological differences found in the literature on breast cancer.5–11
Specific studies involving the Brazilian population point to classic risk factors, such as aging and menopausal status.12,13 Other studies show more complex associations, also observed worldwide, such as the development of tumors with a worse prognosis, such as triple-negative, in obese and overweight women.11,14 Factors such as social vulnerability15 and a history of psychological stress16 have also been reported as possible risks associated with the presence of breast cancer in women living in southern Brazil. However, studies referring to regional risk factors are rare and inconclusive.
In this context, it is intended to categorize, through statistical analysis, possible risk factors for breast cancer, targeting patients in the southwest region of Paraná, Brazil. It is known that mathematical analysis can be a powerful tool to assess patient data, providing reliable associations between variables that often cannot be understood in isolation. Considering that physicians may not be familiar with statistical analysis, such interdisciplinary studies become essential.
Data from breast cancer patients can be analyzed using various mathematical tools. We highlight the multivariate analysis that studies the correlation of two or more variables with different information.17,18 The analysis of these groups can provide relevant information about part of the total sample. In this way, clustering performs a more specific descriptive analysis of the groups within the sample.
It is observed that many studies perform statistical analysis considering correlations of a few variables.5,8–11,19 In this line of study, to categorize possible risk factors identified in women diagnosed with breast cancer, an exploratory data study is presented considering 11 clinicopathological variables.
Materials and methodsSampleThe sequential data used contain information from biopsy samples taken serially from women who had lesions suggestive of breast cancer, visualized by imaging tests and physical examinations, in the period from May 2015 to March 2020. Data confidentiality was maintained following clinical research guidelines. The Institutional Ethics Board approved the study under the number CAAE 35524814.4.0000.0107, including 155 patients with a confirmed breast cancer diagnóstico through biopsy. These patients from the 8th Health Regional of the State of Paraná, which covers 25 municipalities, divided into three regions, were treated at the Oncology hospital in Francisco Beltrão, Paraná, Brazil. Medical records were consulted to obtain data. All patients signed consent, and each protocol followed the principles of medical research involving humans described in the Declaration of Helsinki.
VariablesIn this study, variables with different characteristics and applications are considered. The clinical and pathological variables were used to characterize patients and tumors (breast cancer). The spatial distribution of breast cancer cases in the three regions and municipalities of the 8th Health Region of the State of Paraná was also analyzed. Numbers labeled patients.
Furthermore, 11 clinicopathological variables are used to describe characteristics of the disease, such as the presence of intratumoral emboli, the presence of lymph nodes, the menopausal status, the molecular subtype, the histological grade, the TNM staging of the disease, tumor size (cm), age at diagnóstico (years), weight (kg), height (m) and body mass index (BMI) in (kg/m2).
Histopathological evaluation is essential for the diagnóstico of neoplasia. In this context, for the histological grade variable, the criteria were adopted as being well, moderately, and little differentiated. For molecular subtype, variables were determined as recommended by the St Gallen Consensus.20 The TNM staging variable was classified concerning the stages of the disease as described by the American Joint Committee on Cancer, Breast Cancer Staging System.21
For a better understanding of the work, the variables are classified as:
Binary: intratumoral emboli, lymph node invasion, and menopausal status;
Categorical: molecular subtype, histological grade, and TNM staging;
Quantitative: tumor size, age at diagnóstico, weight, height, and BMI.
Statistical methodsSeveral methodologies analyze characteristics that differentiate the data from a sample, dividing it into clusters.17,18,22 In this article, we used the software R.23 The packages Hmisc24 and Agricolae25 were used to facilitate the interpretation of the analysis performed on the data. Cluster analysis was performed by calculating the Euclidean distance between clinicopathological variables.
Initially, to determine which data are more homogeneous with each other, the Euclidean distance method is used. Next, Ward's hierarchical agglomerative method is used to generate the heterogeneous groups among themselves. The result of the analysis, presented in a dendrogram, helps identify the division of groups, thus generating clusters.
Once the clusters were obtained, the calculation of Spearman's lineal correlation between the variables allowed us to understand the influence that one variable exerts over another, enabling the identification of possible risk factors associated with the groups.26 The Spearman's correlation coefficient varies between −1 and 1, where, to determine the significance of the correlations, the p-value was calculated.
To extract characteristics that distinguish the data from different clusters and calculate the correlation, the test of means was used. This procedure allows us to calculate, for each cluster variable, those that present different significant means and those that are just sample variations.
ResultsApproximately 31% of the patients had tumors containing intratumoral emboli. It is also noted that the presence of positive lymph nodes was observed in 41% of patients and that 70% are classified as menopausal women at diagnóstico.
On average, the patients in this study have a higher frequency of tumors of the Luminal B molecular subtype, intermediate histological grade, moderately differentiated, and a median TNM stage II, with variations between 0 and IV.
The dispersion of tumor size was observed, ranging from 0.9 cm to 15 cm. The average age of patients is 56.6 years, and the prevalence of the disease was higher in women aged over 45 years, representing 75% of cases. The average weight, when diagnosed, was close to 72.5 kg, but one of the patients weighed 120 kg. Furthermore, only 25% of patients had a BMI of less than 24.8 kg/m2.
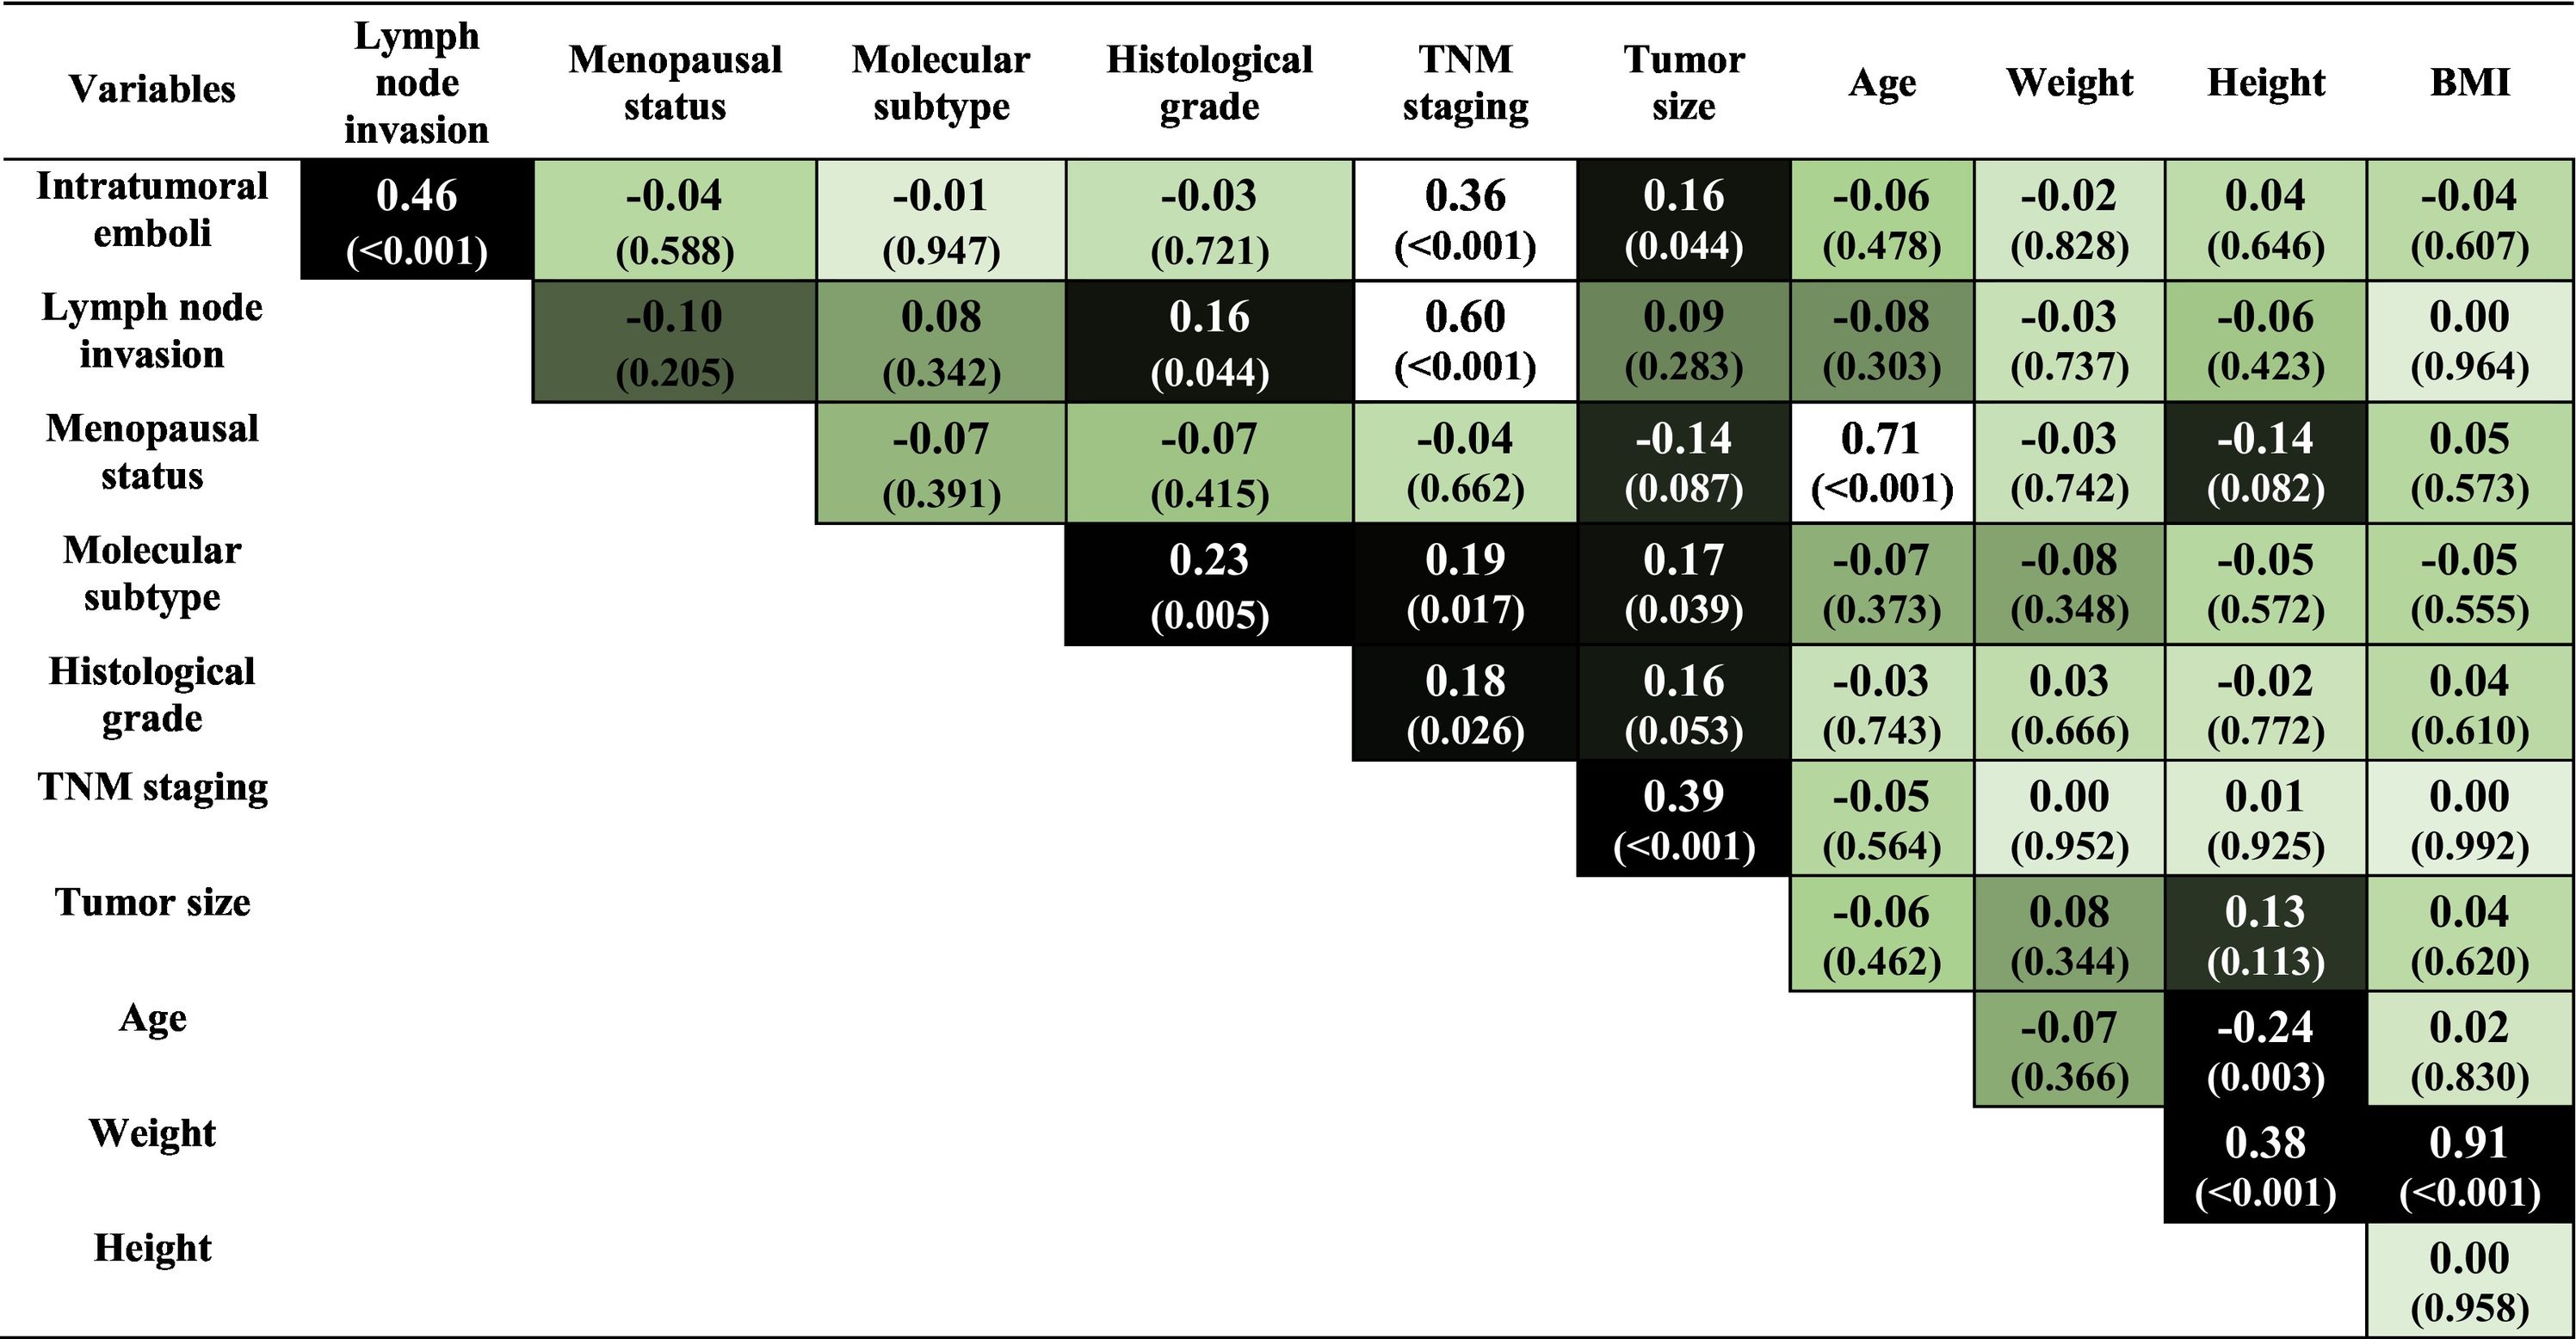
Clinicopathological correlationsChecking the influence that one variable exerts on the other allows a better understanding of the data from a sample, making it possible to identify possible risk factors. Thus, Spearman's lineal correlation is used to estimate the correlation between each pair of variables, evaluating possible connections between clinicopathological variables.
Statistical analysis reveals the existence of significant associations between some of the variables in the sample. These results can be seen through the color map in Table 1, where stronger colors reveal the existence of significant associations (p < 0.01) between the variables.

We should highlight the positive and significant correlations of intratumoral emboli with the presence of lymph node invasion and TNM staging. The formation of intratumoral emboli occurs due to tumor-induced coagulation changes. This event facilitates the spread of the disease, explaining its correlation with lymph node invasion.27
TNM staging variable presents a positive and significant correlation with the lymph node invasion variable. This correlation was also expected, as the TNM staging calculation uses lymph node invasion as one of its parameters. These results show that the mathematical model follows the clinical classification used to establish the TNM staging.
It is noted that the correlations involving the variables presence of intratumoral emboli, lymph node invasion, and TNM staging did not show significant connections with the variables age and BMI, so that the correlations presented describe risk factors independent of age and the patients' body weight at diagnóstico. However, it is known that both age and obesity are considered determinant risk factors. Table 1 shows a positive and robust correlation between menopause and the patient's age. It is an expected association, as women experience hormonal failure with aging. On the other hand, the data do not show a significant correlation between menopause and being overweight.
Due to the heterogeneity of the behavior patterns of the clinical parameters evaluated in breast cancer, it is necessary to analyze the sample data in smaller groups. Thus, probably more specific correlations can be evidenced from the data.
Considering the data from the complete sample, Ward's method resulted in the formation of hierarchical groups by similarities, suggesting a marked reduction in similarity when 2 or 3 clusters are obtained, as shown in Fig. 1. The dendrogram graphically indicates the evolutionary history of the distance matrix; that is, the observations of each group are similar to each other, and each group is heterogeneous compared to the other, so three groups were the ideal choice. In addition to the dendrogram, the fusion test was performed, indicating that the first most significant distance between the groups is found in the third group. Thus, it was decided to keep 3 clusters, denoted by C1, C2, and C3, respectively, even because, clinically, there was a better representation of information about the patients.

From the descriptive means and test of means, Table 2, it appears that clusters C1, C2, and C3 do not show significant differences in the variables intratumoral emboli, presence of lymph node invasion, molecular subtype, grade, TNM staging, tumor size, and height. On the other hand, all clusters show significant differences in the menopausal status, age, weight, and BMI variables, in bold in Table 2. Thus, in our mathematical modeling, the variable menopause, age, and BMI at diagnóstico were selected based on their contribution to characterizing the influence of each variable in breast cancer prognosis.
Descriptive means and test of the means of variables for each cluster.
| Full sample | C1 | C2 | C3 | |
|---|---|---|---|---|
| Number of patients | 155 | 79 | 35 | 41 |
| Binary variables | ||||
| Intratumoral emboli | 0.31 | 0.27 | 0.31 | 0.39 |
| Lymph node invasion | 0.41 | 0.33 | 0.51 | 0.49 |
| Menopausal status | 0.70 | 0.99a | 0.26c | 0.51b |
| Categorical variables | ||||
| Molecular subtype | 2.43 | 2.34 | 2.66 | 2.39 |
| Grade | 1.93 | 1.95 | 1.91 | 1.90 |
| TNM staging | 2.06 | 1.96 | 2.09 | 2.22 |
| Quantitative variables | ||||
| Tumor size (cm) | 3.18 | 3.11 | 3.51 | 3.03 |
| Age (years) | 56.64 | 67.06a | 42.57c | 48.56b |
| Weight (kg) | 72.54 | 68.66b | 62.59c | 88.54a |
| Height (m) | 1.60 | 1.59 | 1.61 | 1.62 |
| BMI (kg/m2) | 28.25 | 27.14b | 24.11c | 33.94a |
Different letters indicate a significant difference between the means of a variable in the different clusters (p < 0.01). This table aims to verify, using a hypothesis test, whether there is a difference between groups depending on the evaluated covariate. In this way, the means of each group are compared, in which equal letters mean that statistically, there is no difference. Otherwise, different letters mean that there are differences between the groups. It is observed that this comparison occurs between groups two by two for each variable analyzed.
In this study, we showed that cluster analysis is an interesting approach to categorizing breast cancer patients according to combined clinicopathological features. This analysis resulted in 3 utterly distinct clusters. C1 was formed by 99% of menopausal women, older, with a mean age of 67 years, and overweight, with a mean BMI of 27.14 kg/m2. C2 included younger women with a mean of 42.57 years; most were not in menopause, had lymph node invasion, and had average weight. C3 was composed of women of middle ages, obese, in menopause, and with lymph node invasion.
Information regarding the categorical and quantitative variables in each cluster is shown in Fig. 2. Note that Fig. 2(a) shows the prevalence of tumors of the Luminal A and B subtypes in C1 and C3 and Luminal B in C2. It means that considering the molecular subtype of breast cancer, C2 has patients with the worst clinical prognosis compared to the others since Luminal B tumors are very aggressive.28
, C2 (black) and C3 (red). (For interpretation of the references to color in this figure legend, the reader is referred to the web version of this article.)")
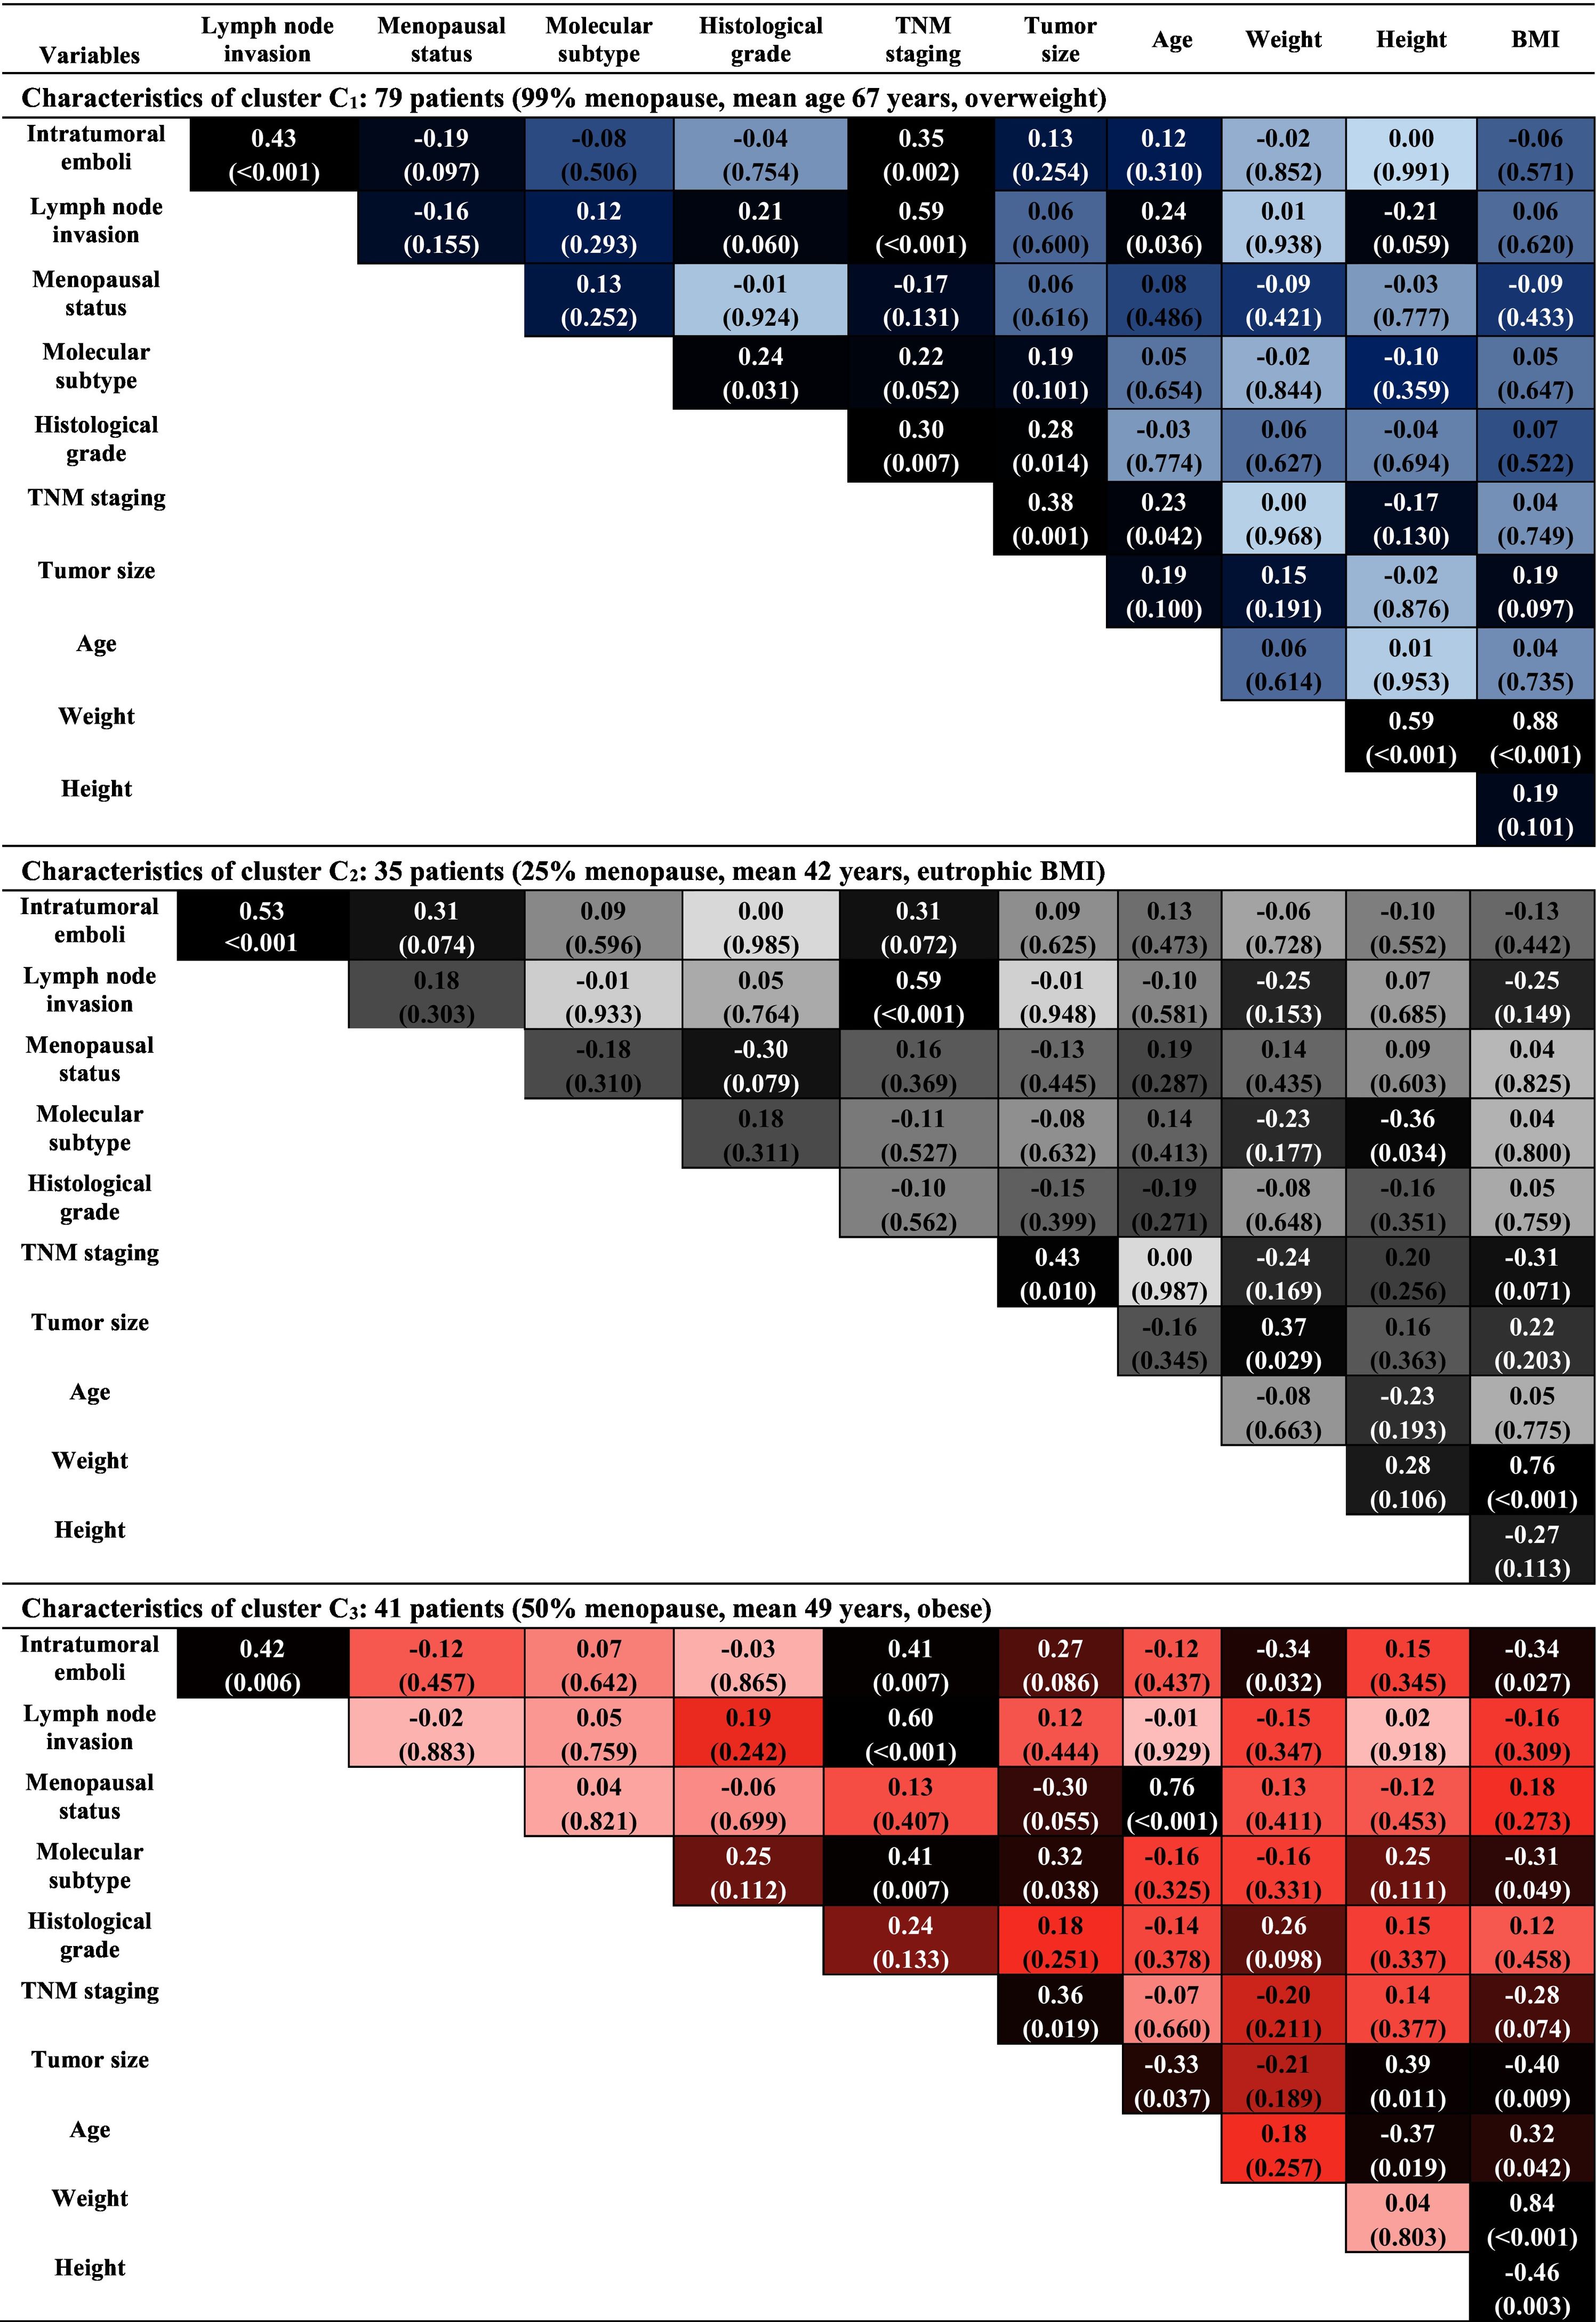
It was observed that with the division of clusters, it was possible to characterize the heterogeneity of behavior between the clinicopathological variables. Quantifying the intensity of the statistical dependence of the set of variables in each cluster will allow us to understand the influence that one variable exerts over another, making it possible to identify possible risk factors associated with the groups.
Thus, from the analysis of each cluster, where stronger colors reveal the existence of significant associations (p < 0.01) between the variables, as shown in Table 3, the data confirm some common characteristics, highlighting the strong correlation between the variables weight and BMI in all clusters, and the correlation between menopausal status and age at diagnóstico, in C3. Similarly, correlations between intratumoral emboli, the presence of lymph node invasion, and TNM staging are present in almost all clusters. It is worth mentioning that, despite these characteristics having already been observed in the data of the complete sample, Table 1, it is now possible to analyze these correlations in the context of the particularities of each cluster. Next, the analysis of each cluster was carried out.

In C1, menopausal, older, and overweight patients, significant correlations between the variables intratumoral emboli, lymph node invasion, and TNM staging are observed. This statement is justified by the analysis of the correlations obtained in Table 3, that is, the correlation of:
(a) intratumoral emboli with lymph node invasion and TNM staging,
(b) TNM staging with lymph node invasion, tumor grade, and size.
It is known that, clinically, the formation of intratumoral emboli occurs due to coagulation alterations induced by tumors, facilitating the process of spreading the disease. Furthermore, the larger the tumor size, the more advanced the TNM stage of the disease is.
In C2, composed of patients aged between 31 and 52 years, most of them not menopausal and with an average BMI of 24.11 kg/m2. There are significant correlations between intratumoral emboli and lymph node invasion, without association with the obesity variable. This statement is justified by the analysis of the correlations obtained in Table 3, that is, the correlation of:
- (a)
intratumoral emboli with lymph node invasion,
- (b)
TNM staging with lymph node invasion and tumor size.
Clinically, these correlations act in favor of the same biological event, which in this case would be favoring tumor spread. In addition, this association has a significant clinical meaning since this cluster is characterized by the incidence of the disease in young women, which gives them a risk of highly aggressive tumors.29 Thus, these women are not in menopause at diagnóstico is another factor of worse prognosis because estrogen acts as fuel for breast cancer.30
In C3, composed of patients considered young, obese, and with a prevalence of TNM staging in stages, II and III, presents a strong correlation between the menopausal status variables and age at diagnóstico, in addition to other correlations previously observed in the preceding clusters. This statement is justified by the analysis of the correlations obtained in Table 3, that is, the correlation of:
- (a)
intratumoral emboli with lymph node invasion and TNM staging,
- (b)
TNM staging with intratumoral emboli, lymph node invasion, and molecular subtype,
- (c)
menopausal status with age at diagnóstico.
Clinically, the strong correlation between the variables menopausal status and age at diagnóstico configures a worse disease prognosis for non-menopausal women. There is no correlation between obesity and variables associated with breast cancer in these data. On the other hand, in the literature, it is observed that obesity is a risk factor for breast cancer and is associated with the occurrence of highly aggressive tumors.31,32
Spatial distribution of clinicopathological variablesTable 4 presents the descriptive means of the variables considered in each cluster for the three regions of the 8th Health Regional of the State of Paraná, that are: Fronteira, Vale do Iguaçu, and Vale do Marrecas. Note that the means of the variables in each region that stand out the most are cluster C2, in bold in Table 4. Although the Vale do Iguaçu region contains the smallest number of patients, those in C2 of this region showed that the youngest patients are in a very advanced stage of the disease, TNM III, with the worst prognosis.
Means of the variables in each cluster for the regions of the 8th Health Regional of the State of Paraná.
| Fronteira | Vale do Iguaçu | Vale do Marrecas | |||||||
|---|---|---|---|---|---|---|---|---|---|
| C1 | C2 | C3 | C1 | C2 | C3 | C1 | C2 | C3 | |
| Number of patients | 30 | 10 | 15 | 17 | 5 | 9 | 32 | 20 | 17 |
| Binary variables | |||||||||
| Intratumoral emboli | 0.30 | 0.40 | 0.47 | 0.18 | 0.40 | 0.33 | 0.28 | 0.25 | 0.35 |
| Lymph node invasion | 0.30 | 0.60 | 0.47 | 0.29 | 0.80 | 0.67 | 0.38 | 0.40 | 0.41 |
| Menopausal status | 0.97 | 0.10 | 0.33 | 1.00 | 0.40 | 0.67 | 1.00 | 0.30 | 0.59 |
| Categorical variables | |||||||||
| Molecular subtype | 2.27 | 2.70 | 2.27 | 2.29 | 2.40 | 2.78 | 2.44 | 2.70 | 2.29 |
| Grade | 1.87 | 2.30 | 1.93 | 1.76 | 1.60 | 1.89 | 2.13 | 1.80 | 1.88 |
| TNM staging | 1.93 | 2.00 | 2.27 | 1.76 | 3.00 | 2.22 | 2.09 | 1.90 | 2.18 |
| Quantitative variables | |||||||||
| Tumor size (cm) | 3.22 | 2.38 | 2.99 | 2.84 | 3.80 | 3.50 | 3.15 | 4.00 | 2.81 |
| Age (years) | 65.60 | 43.00 | 46.87 | 69.59 | 42.40 | 50.44 | 67.09 | 42.40 | 49.06 |
| Weight (kg) | 71.07 | 60.62 | 84.91 | 66.48 | 56.88 | 83.90 | 67.55 | 65.00 | 94.19 |
| Height (m) | 1.59 | 1.59 | 1.62 | 1.58 | 1.62 | 1.61 | 1.60 | 1.62 | 1.63 |
| BMI (kg/m2) | 28.24 | 23.92 | 32.76 | 26.63 | 21.58 | 32.58 | 26.37 | 24.84 | 35.70 |
The means of the variables that stood out among the clusters in the respective regions are shown in bold. Higher mean frequencies of patients who presented the presence of intratumoral emboli and lymph node; higher means for categorical variables Molecular subtype, grad, and TNM staging, configuring worse prognosis. Largest tumor size averages. Lower and higher mean age and BMI, respectively.
Regarding the high frequency of patients who developed the disease in the Vale do Marrecas region, this area is reported as the highest pesticide trade in in Paraná state, and it includes all municipalities in the 8th Health Regional.33 Therefore, knowledge about the spatial distribution of pesticide use can be used as a variable for the prognosis of breast cancer and give a possible interpretation of the data presented in Table 4. Thus, new analyzes are suggested to assess the impacts of extrinsic factors on breast cancer patients, especially environmental factors, health habits, and diet.
ConclusionThe cluster analysis allowed us to identify essential factors in breast cancer and their relationship with characteristics of worse prognosis, such as BMI, TNM staging, the presence of intratumoral emboli, and lymph nodal invasion. Due to the heterogeneity of the clinical parameters evaluated, the sample data was analyzed in smaller groups, which resulted in three hierarchical groups categorized by similarities based on cluster analysis. All groups showed significant differences in menopausal status, age and BMI; therefore, these variables were selected.
Through the statistical analysis, it was possible to determine the heterogeneity of the data, so the patients were separated into three clusters. This analysis identified that the group composed of older, postmenopausal and obese patients with intratumoral emboli, and lymph node invasion, configured characteristics of worse prognosis. As young, non-menopausal, and eutrophic patients who presented intratumoral emboli and lymph node invasion had characteristics associated with the development of tumors with poor clinical prognosis, regardless of obesity. Another group was formed by patients considered young, in menopause, and obese who presented a prevalence of TNM staging in stages II and III, reflecting the failures in the late search for health services for screening the disease at earlier stages. When analyzing the obtained clusters, each one of them had singular characteristics. Thus, with the division of the groups, it was possible to characterize the heterogeneity of characteristics of the clinicopathological variables, especially when considering that BMI is not a classical risk factor used to predict patients' prognosis in breast cancer. Quantifying the intensity of the statistical dependence of the set of variables in each cluster allowed us to understand the influence that one variable exerts over another, enabling the identification of possible risk factors associated with the groups.
FundingThe authors declare that they have not received funding for this study.
Ethical disclosuresAll patients signed consent forms. The study was approved by the Institutional Ethical Committee. The authors have no ethical issues to declare.

