


Current taxonomic systems are based on a descriptive and categorical approach where psychopathological symptoms and signs are caused by a hypothetical underlying mental disorder. In order to circumvent the limitations of classification systems, it is necessary to incorporate new conceptual and psychometric models that allow to understand, analyse and intervene in psychopathological phenomena from another perspective. The main goal was to present a new approach called network analysis for its application in the field of psychopathology. First of all, a brief introduction where psychopathological disorders are conceived as complex dynamic systems was carried out. Key concepts, as well as the different types of networks and the procedures for their estimation, are discussed. Following this, centrality measures, important for the understanding of the network as well as to examine the relevance of the variables within the network were addressed. These factors were then exemplified by estimating a network of self-reported psychopathological symptoms in a representative sample of adolescents. Finally, a brief recapitulation is made and future lines of research are discussed.
Los sistemas taxonómicos actuales se basan en un enfoque categorial, de corte descriptivo, donde los síntomas y signos psicopatológicos son causados por un hipotético trastorno mental subyacente. Con la finalidad de soslayar las limitaciones de los sistemas clasificatorios, se hace necesario incorporar nuevos modelos conceptuales y psicométricos que permitan comprender, analizar e intervenir en los fenómenos psicopatológicos desde otra perspectiva. El objetivo general de este trabajo fue presentar un nuevo enfoque denominado análisis de redes (network analysis) para su aplicación al campo de la psicopatología. En primer lugar se lleva a cabo una breve introducción al análisis de redes, donde se conciben los trastornos psicopatológicos como sistemas complejos dinámicos. A continuación se comentan conceptos clave, los diferentes tipos de redes y los procedimientos para su estimación. Seguidamente se abordan las medidas de centralidad importantes para comprender la estructura de la red así como para examinar la relevancia de las variables dentro de la misma. Posteriormente se ejemplifica todo lo anterior mediante la estimación de una red de síntomas psicopatológicos autoinformados en una muestra representativa de adolescentes. Finalmente, a modo de conclusión, se realiza una breve recapitulación y se comentan posibles líneas de investigación futuras.
Current medical systems such as mental disorders diagnostic and statistical Manual (DSM)1 consider that the symptoms and signs shown by patients originate in a latent cause denominated mental disorder. Depending on the presence or absence of certain symptoms, their covariation and duration, it is possible to infer the existence of hypothetical common cause, i.e., a latent variable or construct.2 Although the underlying mental disorder is invisible to human eyesight, based on some epistemological models it is usually considered to actually exist in nature.3 Nevertheless, in a strict sense what can be observed are certain indicators (such as symptoms and signs) which are supposed to be manifestations of an underlying disorder that causes them. This interpretation, which takes its inspiration from medicine, is known as the common latent model or common cause framework.2 This approach is not free of limitations; for example, as opposed to what is the case in other fields of medicine, it is hard to identify a common cause as a condition which exists independently of its symptoms and also explains the emergence and covariation of the same.4
The common latent cause model is without doubt one of the most widely used ways of explaining mental disorders; however, other interpretations, complementary or otherwise, permit clear understanding of psychopathological disorders as well as other psychological phenomena such as personality traits, and they are possible as well as desirable. For example, it is also possible to think that symptoms and signs are not the emerging manifestations of an underlying disorder, but rather that they are networks of symptoms, dynamic constellations of symptoms that are causally interrelated.2,5 This approach may find expression, for example, in the case of a patient who says that sleep problems are altering his mood. In turn, a state of anhedonia may have a negative impact on his appetite as well as his ability to concentrate, which in turn alters his interpersonal relationships and social and work-related functioning. In this sense, an underlying disorder would not be the common cause of the covariation existing among the symptoms. The symptoms would not reflect a cause but would rather be the cause themselves.4
Modern healthcare systems have been strongly criticised, and there have been many calls for in-depth reconceptualisation.6,7 For example, the latest version of the DSM1 offers only slight advances in reliability and clinical usefulness, while it hardly mentions the critical question of validity. The DSM is based on a phenomenological and description approach that is clearly tautological, and it still excludes etio-pathogenic mechanisms. Additionally, it gives a simplified and incomplete vision of clinical conditions (such as schizophrenia) as something which is discrete and defined according to a mixture of arbitrary inclusion or exclusion criteria and the duration of clinical phenomena.8 Likewise, nor does it consider the phenomenological structure of individuals signs and symptoms, or the relationships that link them and their dependency on the context.9,10 These limitations are thought to hinder the study of mental disorders, as they make it impossible, among other aspects, to improve strategies for prevention and treatment, or to search for etio-pathogenic mechanisms.11 With the aim of avoiding the deficiencies of current nosological systems new classifications have been created, such as the Research Domain Criteria (RDoC),6 and several advances in evaluation and measurement have opened the door to new ways of conceiving and analysing psychopathological phenomena. Network analysis, chaos theory or dynamic systems theory are only a few examples of this.12
Within this research context, the aim of this work was to introduce a new approach for the comprehension and measurement of psychopathological variables, known as network analysis. Firstly there is an introduction to network analysis, after which key concepts are described as well as the differences between different types of networks and procedures for examining them. Measurements of centrality are then explained, as these are important for understanding network structure as well as for examining the importance of the variables it contains. Certain applications in the field of psychopathology are described, after which the example of a specific case is given, estimating and analysing a network of self-informed psychopathological problems in a sample of adolescents. This will allow the reader to determine the degree of utility and possible significance of this approach for use in psychopathology. Finally, as a conclusion, there is a brief summary and possible lines of future research are described.
This work does not examine the problems inherent in the measurement of psychopathological measurements or other aspects in connection with psychometry; for these and other cases the reader may consult previous works.3,13–17 In the same way, it is also possible to consult previous works for a more detailed description of network analysis,2,4,18–20 tutorials2,21,22 and web pages where excellent examples are given, together with papers, software and syntax (http://psychosystems.org/). Readers are recommended, as an introduction, to take their first steps in network analysis using the following application: https://jolandakos.shinyapps.io/NetworkApp/.
The network analysis model in psychopathologyIntroductionNetwork analysis is not new. It has been widely used in other fields, such as in the analysis of social networks (e.g., interpersonal relationships) using graph theory.23,24 However, it seems to have re-emerged with new force in the field of psychopathology thanks to the group of Professor D. Borsboom in Amsterdam University.2,20
Network analysis is a new theoretical approach in the study of psychopathology and other areas such as personality. This approach may lead to alternative ways of analysing data, suggest new ways of modelling and simulating psychopathological processes, as well as opening up new horizons that make it possible to understand and represent psychopathological (and psychological) phenomena in a different way.2,20 Lastly, as some authors remark, it may help to change how psychopathology is understood,4 or at the least to use an alternative viewpoint to conceptualise and rethink psychopathological phenomena. This is basically an attempt to offer new answers to problems in the field of psychopathology which are already classics.
The network model within psychopathology seeks to analyse dynamic interactions, sometimes of a causal type, between symptoms and signs. In this approach underlying latent variables would not be the cause of symptom covariation, and nor would symptoms be interchangeable indicators of an underlying disorder. Symptoms do not therefore reflect underlying mental disorders as they are parts of them.2,20 Symptoms group together because they mutually influence each other, not because they share a latent cause that explains their emergence and covariation. Symptoms have independent causal power and are not mere passive consequences of a common latent cause. This therefore involves looking at psychopathological disorders as a complex dynamic system of symptoms and signs.25 For Borsboom,20 on the basis of this model the notion of mental health would correspond to a stable state in a weakly interconnected network of symptoms, while mental disorders would correspond to stable states of strongly interconnected networks of symptoms.
Basic conceptsNetworks consist of nodes and edges. The nodes represent the objects or variables to be studied. The edges represent the connections between nodes. In network analysis in psychopathology the nodes usually represent symptoms while the edges represent the associations between them. Graphically, nodes are shown as “circles” and the edges are the “lines” connecting them. Nodes may be another type of variable apart from psychopathological symptoms, such as traumatic experiences, substance abuse or daily stress, to mention just a few.26,27 They may also be another type of variable from different analytical levels (such as genetic or psychophysiological).28 The representation of nodes and edges is known as a graph. Such representations may be created using different statistical programs such as R29 and within them using certain packages such as Qgraph.30
Network typesA network is a representation of a set of nodes and edges. Different types of network may be found depending on whether the edges are weighted and/or directed.
Networks may be weighted or unweighted edges. In unweighted edges the symptoms are connected, while in weighted networks there is a value, a weighting and a coefficient which indicates the magnitude of a connection between nodes. This weighting is represented by the thickness of the edge, and the greater the thickness, the stronger is the force of the association. If there is no edge the relationship is 0. The association between two nodes may be positive or negative. A negative relationship is usually shown in red, while a positive one is in green. For example, two nodes within a network may be connected positively (green); as in a patient with psychosis, where there is a relationship between hallucinatory experiences and delirious ideas. On the other hand two symptoms, for example in thought disorder and anhedonia, are connected negatively (red).
Network edges may be directed or undirected. Undirected networks consist of edges or simple lines that connect pairs of nodes. I.e., the coloured lines that join the nodes have no arrows at their ends. This means that although there is a relationship of a certain magnitude, the direction of this relationship is not shown, i.e., whether symptom X causes the activation of symptom Y or vice versa. On the other hand, directed networks allow the direction of prediction to move in both directions. Directed networks consist of edges with arrowed ends that point to the direction of the prediction and perhaps indicate causality.
It is also possible to combine each one of the two types of networks, giving rise to four types: unweighted and undirected, unweighted and directed, weighted and undirected and weighted directed ones. Fig. 1 shows these four types of network.
Network estimation
Networks in psychopathology are unlike those in many other disciplines in one fundamental respect: they need to be estimated. Networks may be estimated by considering: (a) simple correlations; (b) partial correlations, and (c) partial regularised correlations.
Simple correlations, which are also known as association networks, would be the typical graphical representation of Pearson matrices. The partial correlations matrix, which is also known as the concentration network, is used to control false correlations which may arise due to multiple comparisons. In a concentration network conditional correlations are shown in all of the other network nodes. This therefore makes it possible to see the correlation between symptom X and symptom Y, controlling the effect of the rest of the symptoms in the network. Two nodes are connected if and only if there is covariance between them, in a way that cannot be explained by any other node in the network. Network estimation takes place using an algorithm denominated Fruchterman-Reingold. Essentially, this algorithm uses an iterative procedure to locate the most important nodes in the centre of the network, while the weakest nodes are located in its periphery.
This last type of network requires a large amount of data to make it possible to estimate all of its parameters. This is sometimes hard to achieve, so that it is necessary to implement a regularisation procedure that makes it possible to extract a stable network that is easy to interpret and requires fewer parameters to be estimated. In this case it is possible to estimate the network using the Least Absolute Shrinkage and Selection Operator (LASSO) procedure. Regularisation returns a network which uses few edges to explain the structure of covariance in the data. The Graphical-LASSO (G-LASSO) algorithm is a variant of LASSO that makes it possible, among other things, to optimise the calculation of the inverse covariations matrix.
The procedure for network estimation obviously depends on the nature of the data. For example, if they are transversal or longitudinal, or if they have a multi-level structure or not. For cases where the data are of the longitudinal type and/or present a multi-level structure other procedures may be found, such as Graphical-VAR or Multilevel-VAR.31 Likewise, and although this is not covered in this work, it is also possible to find network estimations that use Bayesian statistics.4
Network inference: centrality measurementsSeveral measurements are available to analyse network structure: the distance and length of the shortest trajectory, centrality, connectivity and grouping. The distance and length of the shortest trajectory asks: can symptom X rapidly influence symptom Y? Centrality measurements ask: which is the most important symptom in the network? And connectivity and grouping measurements ask: to what degree are the symptoms properly connected? This section briefly covers centrality measurements. Previous works may be consulted for in-depth analysis of this question.21
Centrality measurements make it possible to analyse the relative importance of a node within the network according to the pattern of connections. Not all nodes are equally important. A node is central if it has lots of connections. A node is peripheral – located in the external part of the network — if it has few connections. To know whether a node is central (important and influential) in the network the following questions are taken into account: (a) degree centrality; (b) strength centrality; (c) closeness centrality, and (d) betweenness centrality. Statistical programs make it possible to generate centrality graphics and tables (see Figs. 3 and 4). These tables and figures give standardised values on force, closeness and/or betweenness of the nodes, offering information on the relative importance of each node in the network.
Apart from centrality measurements, and with the aim of achieving better characterisation of the symptoms in a network, it is also recommended that predictibility32 be analysed. Centrality rates have certain limitations. For example, it is possible that those nodes with the greatest centrality will also be the best targets for intervention, as although centrality is a relative measurement, it is possible that these nodes will share little variance with other nodes, and that therefore intervening in one will have little impact on the nodes close to it. Essentially, predictability makes it possible to determine the practical relevance of connections between nodes, i.e., the degree to which a node is determined by all of its “neighbour” nodes in the network.32
Some applications in the field of psychopathologyAlthough network analysis in psychopathology is a relatively new and developing field, it has already made excellent contributions in the clinical and research areas. For example, depressive symptomology has been analysed,25,33,34 as has psychosis and its relationship with traumatic experiences or environmental impacts,26,35 negative psychotic symptoms,36 substance abuse,37 quality of life,38 post-traumatic stress symptoms,39 comorbidity40 or the relationship between symptoms and disorders based on taxonomic systems,41,42 to mention just a few.
One application where network analysis may prove interesting in the near future is outpatient evaluation using mobile devices (this is known as the experience sampling method or ecological momentary assessment).43,44 This methodology makes it possible to map individuals’ range of emotions, thoughts, experiences and behaviours over time, generally 5–7days, and in different contexts. On the one hand, experiences are analysed longitudinally, while on the other the behaviour of people is examined in their real day-to-day context. Although this methodology has some disadvantages,45 it certainly improves the ecological validity of data. Based on network analysis and using this methodology it is possible to analyse the connectivity between the symptoms of a certain patient, as well as to examine how they evolve over time. Moreover, it would be possible to analyse how the network changes over time (activating or deactivating connections), for example, after an intervention or whether symptoms increase their connectivity or not depending on possible environmental impacts or the “load” of environmental stress (such as traumatic experiences or taking drugs), so that a cascade or chain reaction of effects could be induced in the system that could lead to a mental disorder or an increase in existing vulnerability.
It is in fact already possible to find pioneering studies which attempt to untie outpatient evaluation with network models. For example, Klippel et al.27 examined a network model in different time models of the dynamic relationships between daily stress, momentary thoughts, psychotic experiences and other potentially relevant everyday life contexts. They selected a sample of individuals who varied in terms of their risk of psychosis (e.g., healthy controls, first degree family members of psychotic patients and psychotic patients). The results indicated that a higher risk of psychosis was associated with a higher number of significant connection in the estimated network. Stress occupied a central position in the network, and it has direct and significant connections with future psychotic experiences. Additionally, when the risk of psychosis was higher the variables “loss of control” and “paranoia” played a greater role in influencing other nodes in the network. These finding seem to support the idea that daily stress may play a major role in inducing a cascade of effects that may lead, in this case, to psychotic experiences.
Recently, Van Os and Reininghaus46 and Wigman et al.47 have introduced network models of severity in the field of psychosis. They have also been applied in the field of depression.25 For example, this approach conceives the syndrome of psychosis as dynamic causal networks of mental states with increasing levels of psychopathological severity. It is hypothesised that in the first stage of the disorder the associations between the symptoms are uniformly weak and will not give rise to psychopathology. The expression of the symptoms is more diffuse, and may find phenotypical expression as “general distress syndrome”. Nevertheless, as individuals progress towards more severe symptomatic stages the network gradually changes and specific and stronger associations arise between the symptoms, so that it may surpass a clinical level and lead to a mental disorder.
Severity network models also include the possible effect of stress or socio-environmental “burden” (Fig. 2). The symptoms do not therefore vary independently, but rather mutually affect each other over time in such a way that the connectivity of symptoms increase as the “burden” or the impact of socio-environmental factors grows (for example, see daily stress, traumatic experiences or cannabis consumption, etc.). The connectivity between symptoms may also reduce if protective factors increase or “impacts” and the “burden” of environmental stress diminish. Based on this model, more symptoms are activated as the result of a high level of connectivity between network symptoms. Exposure to additional environmental adversity leads to increased severity of mental states, and this may give rise to a higher probability of transition into a psychotic disorder.25,46,47 In this case, when there is a high degree of environmental exposure, this may create a major disturbance and a “cascade” phenomenon or chain reaction that propagates through the network and may derive in a disorder and associated disability. Another hypothesis is that individuals with a vulnerability to a psychopathological disorder have a more strongly interconnected network of symptoms, as well as a higher probability of transition into a clinical state following and external disturbance. On the other hand, resilient individuals will have a weakly interconnected network of symptoms as well as rapid recovery into a state of balanced mental health following an external perturbation.20
. For example, for individual A at temporal moment 1 the nodes of the network are not very interconnected, and there is a low level of environmental exposure, creating a slight disturbance that does not spread broadly though the network of symptoms, remaining “contained” within the non-clinical domain. At time 2 the connectivity between the symptoms is greater, and the environmental burden is moderate, creating a greater disturbance in the network, even though it does not cross the clinical boundary. At time 3 the degree of environmental exposure or burden is high, creating a major disturbance and a “cascade” phenomenon or reaction that propagates through the network, so that it may lead to a disorder, disability and the need for treatment. Adapted from Borsboom,20 Cramer et al.25 and Van Os y Reininghaus.46")
Network model as a function of severity and stress burden. T: temporal moment. This is a model, so that it has to be seen as a simplification of reality. The node numbers correspond to psychopathological symptoms (such as anhedonia, hallucinations or deliria, etc.). For example, for individual A at temporal moment 1 the nodes of the network are not very interconnected, and there is a low level of environmental exposure, creating a slight disturbance that does not spread broadly though the network of symptoms, remaining “contained” within the non-clinical domain. At time 2 the connectivity between the symptoms is greater, and the environmental burden is moderate, creating a greater disturbance in the network, even though it does not cross the clinical boundary. At time 3 the degree of environmental exposure or burden is high, creating a major disturbance and a “cascade” phenomenon or reaction that propagates through the network, so that it may lead to a disorder, disability and the need for treatment. Adapted from Borsboom,20 Cramer et al.25 and Van Os y Reininghaus.46
Network structure and centrality measurements have clear clinical implications; for example, they make it possible to decide which symptoms are more important in the network, to use the most central symptoms for diagnosis and planning treatment, or to focus treatment on one symptom or the network of symptoms that have the most connections. It is also possible to identify “bridge” symptoms, i.e., one that serves as a connection between two sets of networks and which if treated and intervened may make it possible to control the (hypo) activation of other sub-networks. For Borsboom,20 diagnosis implies identifying networks of symptoms, while treatment involves changing or manipulating the network in three ways, as follows: intervening in symptoms (modifying the state of one or more symptoms), intervening in the external environment (eliminating the cause or the triggers) and intervening in the network (modifying the connections between network nodes, i.e., symptom-symptom). For example, in a patient with a psychotic spectrum disorder in whom an antipsychotic treatment has been implemented, it is possible to consider intervening in their family to modify communication patterns or eliminate substance abuse, and/or to work using cognitive-behavioural techniques that make it possible to face down persecution deliriums to reduce the associated hallucinatory experiences. All of these questions are extremely relevant in clinical practice.
Thus models of networks and outpatient evaluation arise in response to some of the changes demanded by clinical psychology and psychiatry, consisting of a personalised and precise approach that is stage-based, contextual and dynamic (not static).12,48,49
Network analysis in psychopathology: an example in the field of infantile-juvenile mental healthAs an example this section presents a short description of network analysis in psychopathology, more specifically to analyse the problems faced by adolescents in emotional adjustment and behaviour. A sample of 1664 students was involved, with 782 males (47%), belonging to 34 schools and 98 classrooms. Their average age was 16.12years old (DT=1.36, range 14–19years old). Stratified random sampling was performed on groupings at school classroom level in a population of approximately 15,000 selected students in the autonomous community of La Rioja. This research was approved by the Research Ethics Committee of La Rioja (CEICLAR).
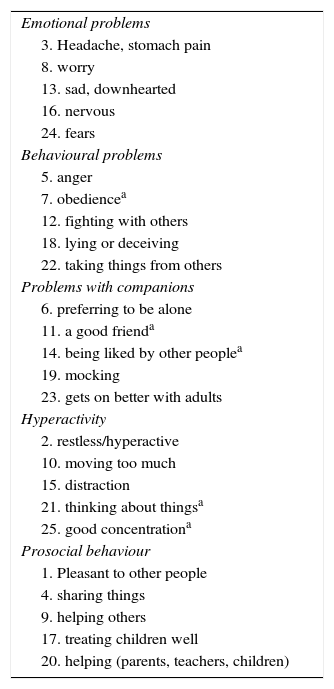
The instrument used was the self-administered version of the Strengths and Difficulties Questionnaire [SDQ]).50 The SDQ has been used to evaluate behavioural and emotional difficulties as well as for psychopathological screening in the infantile-juvenile population.51,52 The SDQ is composed of 25 items, in Likert response format with three options (0: no, never; 1: sometimes; 2: yes, always). The items are grouped in five sub-scales, each of which contains five items: emotional symptoms, behavioural problems, hyperactivity, problems with companions and prosocial behaviour. Higher scores indicate greater emotional and behavioural problems, except for the prosocial behaviour sub-scale, where a lower score corresponds to worse adjustment. The metric properties of the SDQ have been analysed in previous international and national studies.53,54 The SDQ and its correction format can be downloaded from the internet (http://www.sdqinfo.com). Appendix A shows the content of the items.
The network was estimated using the Qgraph30 package within the R55 environment. The estimated network in this work is weighted and undirected. The G-LASSO algorithm is used. Neither predictability nor commonality of the nodes were estimated as this is an introductory example to this field. The results of the estimated network as well as the centrality rates are shown in Figs. 3 and 4. As may be seen, not all of the nodes were equally important. Some nodes occupy a central position, while others are in the periphery. Visual analysis of the network made it possible to find that the majority of nodes are the most strongly connected with those nodes that evaluated the same psychopathological dimension, except for the nodes in the behavioural problems dimension.
.")
Estimated network for mental health indicators in adolescents evaluated using the strengths and difficulties questionnaire. The numbers represent the items in the SDQ (see Appendix A).
.")
Centrality averages for mental health indicators. The numbers correspond to the items in the SDQ (see Appendix A).
As was pointed out above, a node is central if it has lots of connections, and its centrality would basically depend on strength (degree of centrality), closeness and betweenness. Fig. 4 shows the standardised values for strength, closeness and betweenness of all the nodes in the network. All of the scores are in the same measurement scale and are standardised, so that they can be compared to each other. As can be seen in Fig. 3, the indicators with the highest centrality scores in all three aspects were: item 13 of emotional symptoms (“I often feel sad, downhearted or want to cry”), item 19 on problems with companions (“Other people of my age mock me or tease me”), and item 9 of prosocial behaviour (“I help when someone is ill, upset or wounded”). Items 16 (“I get nervous in new situations and easily lose my self-confidence”) and item 5 of behavioural problems (“When I get angry I get very angry and lose control”) also showed their importance in the indicators for betweenness and closeness.
Node 9 specifically evaluates prosocial behaviour and therefore may be considered to be a strength that could be intervened as a protective factor. This node seems to significantly influence the other nodes. Its activation would increase the probability of activating other symptoms. It also has a high degree of centrality for closeness, so that this node would be a good predictor for other nodes in the network. It also has a high level of centrality for betweenness, so that it is a node which stands between another pair of nodes, so that it is well-connected. The same reasoning can be applied to the indicators which evaluate emotional and behavioural difficulties, such as nodes 9 and 13. However, this interpretation is subject to new data supplied by the predictability study, which was not carried out in this study as it is an introduction to the subject.
Based on these results it is possible to gain a better understanding of the structural relationship between the different psychopathological indicators measured by the SDQ in this sample of adolescents. This approach also makes it possible to consider mental health problems as complexes of affective, emotional and behavioural symptoms.
ConclusionThis paper is an introduction to network analysis in psychopathology. It has covered possible problems which underlie the mental disorder model promoted by international classification systems. It has also described the psychopathological conception which underlies the network model, and key concepts have been described, together with different types of networks and procedures for estimating them. It has also presented centrality rates, as well as certain current and future applications which are of great interest for clinical practice. It has also given examples of network analysis by analysing different psychopathological mental health indicators in a representative sample of adolescents.
The networks model seems to be a promising approach as a means of conceptualising psychopathology.56 In fact, some authors believe that network analysis may transform the field of psychopathology to a certain degree4. Research into network analysis is currently in its infancy, so that it is necessary to continue working on the construction of a solid and refutable scientific model for the explanation of mental health.20 This approach seems to be promising as a means of obtaining important information in a series of research fields, such as comorbidity, the clinical importance of certain signs and symptoms, ideographical analysis, the comprehension of etiological mechanisms and the study of risk and protective factors, to mention just a few. Network analysis may therefore play an important role in the comprehension of psychopathological phenomena, overcoming the limitations of the medical model which is based on a common latent cause. It also seems to be a suitable model for the integration of new studies which collect data from multiple levels of analysis, with a translational strategy,57 to detect young people at risk of mental health problems for early intervention58,59 or to study transdiagnostic dimensions. There is no doubt that the comprehension and study of mental disorders is complex, with an infinite number of variables from multiple levels of analysis operate (biological, psychological and social). In any case, whether or not it helps to change the current epistemological and methodological approach to mental disorders, and regardless of whether it complements other approaches or not, at the least network analysis is a new approach based on which it is possible to observe, measure, analyse and comprehend psychopathological phenomena and respond to some of the problems suffered by current psychopathology.
The network model joins other lines of research which are currently growing. These include predictive algorithms,60 artificial intelligence (machine learning),61 personalised medicine62 or the use of new mobile technologies.63 These and other advances faithfully reflect the changes which are occurring in the fields of evaluating, diagnosing and treating psychopathological disorders. When we attempt to make out what will happen in the field of psychopathology in forthcoming years interesting changes can be foreseen. Pay attention, as water only passes once in front of the mill.
FundingThis study was financed by the Spanish Ministry of Science and Innovation (MICINN) (reference number PSI2014-56114-P); by the Instituto Carlos III, the Centro de Investigación Biomédica en Red de Salud Mental (CIBERSAM), and by the 2015 BBVA Foundation for the Support of Researchers and Cultural Creators.
Conflict of interestsThe author has no conflict of interests to declare.
The author would like to thank Professors Alicia Pérez de Albéniz, Marino Pérez, Félix Inchausti and José Muñiz for their remarks on a preliminary version of this paper. He would also like to thank all of the schools for participating in the study, as well as the Education and Health Boards of La Rioja Regional Government.
| Emotional problems |
| 3. Headache, stomach pain |
| 8. worry |
| 13. sad, downhearted |
| 16. nervous |
| 24. fears |
| Behavioural problems |
| 5. anger |
| 7. obediencea |
| 12. fighting with others |
| 18. lying or deceiving |
| 22. taking things from others |
| Problems with companions |
| 6. preferring to be alone |
| 11. a good frienda |
| 14. being liked by other peoplea |
| 19. mocking |
| 23. gets on better with adults |
| Hyperactivity |
| 2. restless/hyperactive |
| 10. moving too much |
| 15. distraction |
| 21. thinking about thingsa |
| 25. good concentrationa |
| Prosocial behaviour |
| 1. Pleasant to other people |
| 4. sharing things |
| 9. helping others |
| 17. treating children well |
| 20. helping (parents, teachers, children) |
Please cite this article as: Fonseca-Pedrero E. Análisis de redes: ¿una nueva forma de comprender la psicopatología? Rev Psiquiatr Salud Ment (Barc). 2017;10:206–215.