To describe a sagittal cephalometric analysis using Power Point Microsoft® Office.
MethodThe digital image of a class I normodivergent 13-year-old female with ideal features and no prior orthodontic treatment was used. The corresponding tracings were made using Power Point (Microsoft® Office) tools.
Mostrar un procedimiento auxiliar en el diagnóstico cefalométrico sagital utilizando el programa Power Point Microsoft® Office.
MétodoSe utilizó la imagen digital de un paciente femenino de 13 años de edad clase I normodivergente con características ideales sin haber recibido tratamiento ortodóntico, los trazos correspondientes se llevaron a cabo usando las herramientas del programa Power Point Microsoft® Office.
In 1838 Henri Geissler built the first vacuum tube used by Johann Wilhelm Hittorf for the study of fluorescence thus observing a electric discharge issued by the negative electrode and naming them cathode rays. In 1870 William Crokees redesigned the tube and Phillip Lenard (1894) detected that the cathode rays penetrated a thin aluminum window. In the year of 1895 Whilhelm Conrad Röentgen discovered the «X» rays, from several experiments he reached the conclusion that the invisible rays, which he called «X», could penetrate bodies and be printed on photographic plates, photographs with «X» rays, subsequently, they were called X-rays. Thanks to this finding a landmark event was the implementation of the «X» rays in the field of medicine. The benefits of this arrived in orthodontics by Hofrat in Germany and H. Broadbent in the United States, who published in 1931 the paper «A new X-ray technique and its application in cephalometrics».1 Years later, the Broadbent-Bolton cefalostat was produced which unified the system for obtaining lateral headfilms thus allowing to take X-rays with the head's actual size (very useful for the study of facial growth) as well as facilitating the cephalometric measurement of «alive» skulls. This brought in consequence several studies of which their outcome reflected in the creation of several cephalometric analysis; Downs (1948), Margolis, Ridel (1950), Steiner, Tweed (1953), Coben, Jenkins (WITS) (1955), Schwarz (1960), Ricketts (1960), Johnston (WITS) (1968), Sassouni, Enlow (1969), Björk-Jarabak (1970), Bimler (1973), Jacobson (WITS) (1975), Legan-Burstone (1980), McNamara (1984), Will Arnett (1993), Fastlicht (2000), just to mention some of the orthodontists who provided their experiences for the development of cephalometric analysis.2–6 Currently the use of technology brings the possibility of including a teleradiography image into a computer making it possible to perform different cephalometric analysis by just pressing a key.
OBJECTIVEThe purpose of this paper is to show a practical method for sagittal cephalometric diagnosis using the Power Point software included in the Microsoft® Office package and used by the vast majority of computer users. The main quality of this method, unlike others, is to promote the formation of diagnostic criteria mainly through visualization, i.e. it is not necessary to perform measurements directly, although it is worth mentioning that it requires prior knowledge of the interpretation of normal values established in cephalometric analysis.
METHODSTo describe how this procedure is performed, we used the digital image of a female, normodivergent Class I patient of 13 years of age with ideal characteristics who had not received any orthodontic treatment. In the photograph, a metal chain that was placed with the purpose of having a reference of a true vertical drop may be observed (Figure 1).
STEP BY STEP PROCEDUREOnce the image is located on the screen of the Power Point software Microsoft® Office, we proceed to draw with the program's tools a line in continuity of the metal chain, as mentioned above, it will serve to indicate the «true vertical» (Figure 2). Then, this line is doubled and the new line is located in the subnasal point (Figures 3 and 5A).
In the subnasal vertical (Sn), we identified the following points: subnasal, prominences of the upper and lower lips, soft tissue point B and soft tissue chin. These references and its normal values were described by Arnett (Figure 4A).7,8 The ideal normal values locate subnasal point over the line at 0mm (Figure 4B); the upper lip prominence 3-4mm in front of the line and the lower lip prominence 0 to 2mm in front of the line. Soft tissue point B is located 5mm behind the line, as does the prominence of the chin by 3mm (Figure 4A).
These normal values can be detected without the need to measure directly so we do the visual exercise and an increase or decrease in these sagittal distances are appreciated at first sight. The lips are catalogued individually as: ideal, with proquelia or retroquelia; soft tissue point B and soft chin, are checked as: ideal, retrusive or protrusive. We continue the analysis by drawing a horizontal line perpendicular to the subnasal vertical, from the cephalometric point Nasion. This line represents the upper facial edge (Figures 5A and B).
We then replicate this horizontal line and move the new line towards the cephalometric reference point menton, in the lowest and middle portion of the mandibular symphysis. This line represents the lower facial edge (Figures 6A and B).
Using the subnasal vertical, we duplicate the vertical line, and with the purpose of distinguishing it easily, we apply a different color. This will be the vertical point «A» line (Figures 7A and B). The possibility of zooming the picture in this program is of utmost usefulness for locating diffuse cephalometric structures, as may be the case of point «A» (Figure 7A).
Once again we create another vertical line, characterize it as dotted and place it tangent to the anterior surface of the most prominent upper incisor (Figures 8A and B).
We then create another vertical line and place it at Nasion, thus having 4 vertical lines (Figure 9).
To interpret the inclination of the upper incisors McNamara9–11 set as a normal value a distance of 4 to 6mm between point «A» vertical and the parallel tangent to the labial surface of the upper incisor (Figure 10). This reference indicates the ideal inclination, while an increase or decrease of this distance suggests proclination or retroclination of the upper incisors (Figure 11).
On the other hand, the sagittal position of the upper incisors is defined as ideal, protrusive or retrusive. In order to determine that, the ends of the vertical lines, i.e. Nasion vertical and subnasal vertical are considered. The ideal position of the line for the upper incisors (dotted) must be in the middle of these two lines (Figure 12) and when the incisor line is not located in this position, we can determine the protrusion or retrusion of the upper incisors (Figure 13).
In general terms, the normal value of the sagittal maxillary ideal relationship regarding the Nasion vertical line for a class I normodivergent malocclusion is 2 ± 2mm.12–14 Ahead of the line, when the value is greater than the norm the maxilla is considered to be protrusive and when it is behind the Nasion vertical line or is less than 2 ± 2mm the maxilla is considered retrusive. The Nasion line also maintains a vertical relationship with the ideal (orthognathic) mandible of 2 ± 2mm. When this distance increases showing the mandible well behind the line it is identified as retrognathic. If the mandible is located very close to the line or ahead of it, it is considered to be prognathic. The Nasion vertical line clearly shows the position of both the mandible as well as that of the maxilla in the sagittal dimension. Figure 14A clearly exemplifies a mandibular retrognathism combined with the ideal sagittal maxillary position. To determine the sagittal intermaxillary relationship, i.e. to determine the Angle class (Class I, II or III), we use the point «A» line because it serves to easily locate the relationship of points «A» and «B». Figure 14B exemplifies the abovementioned showing a class I relationship.
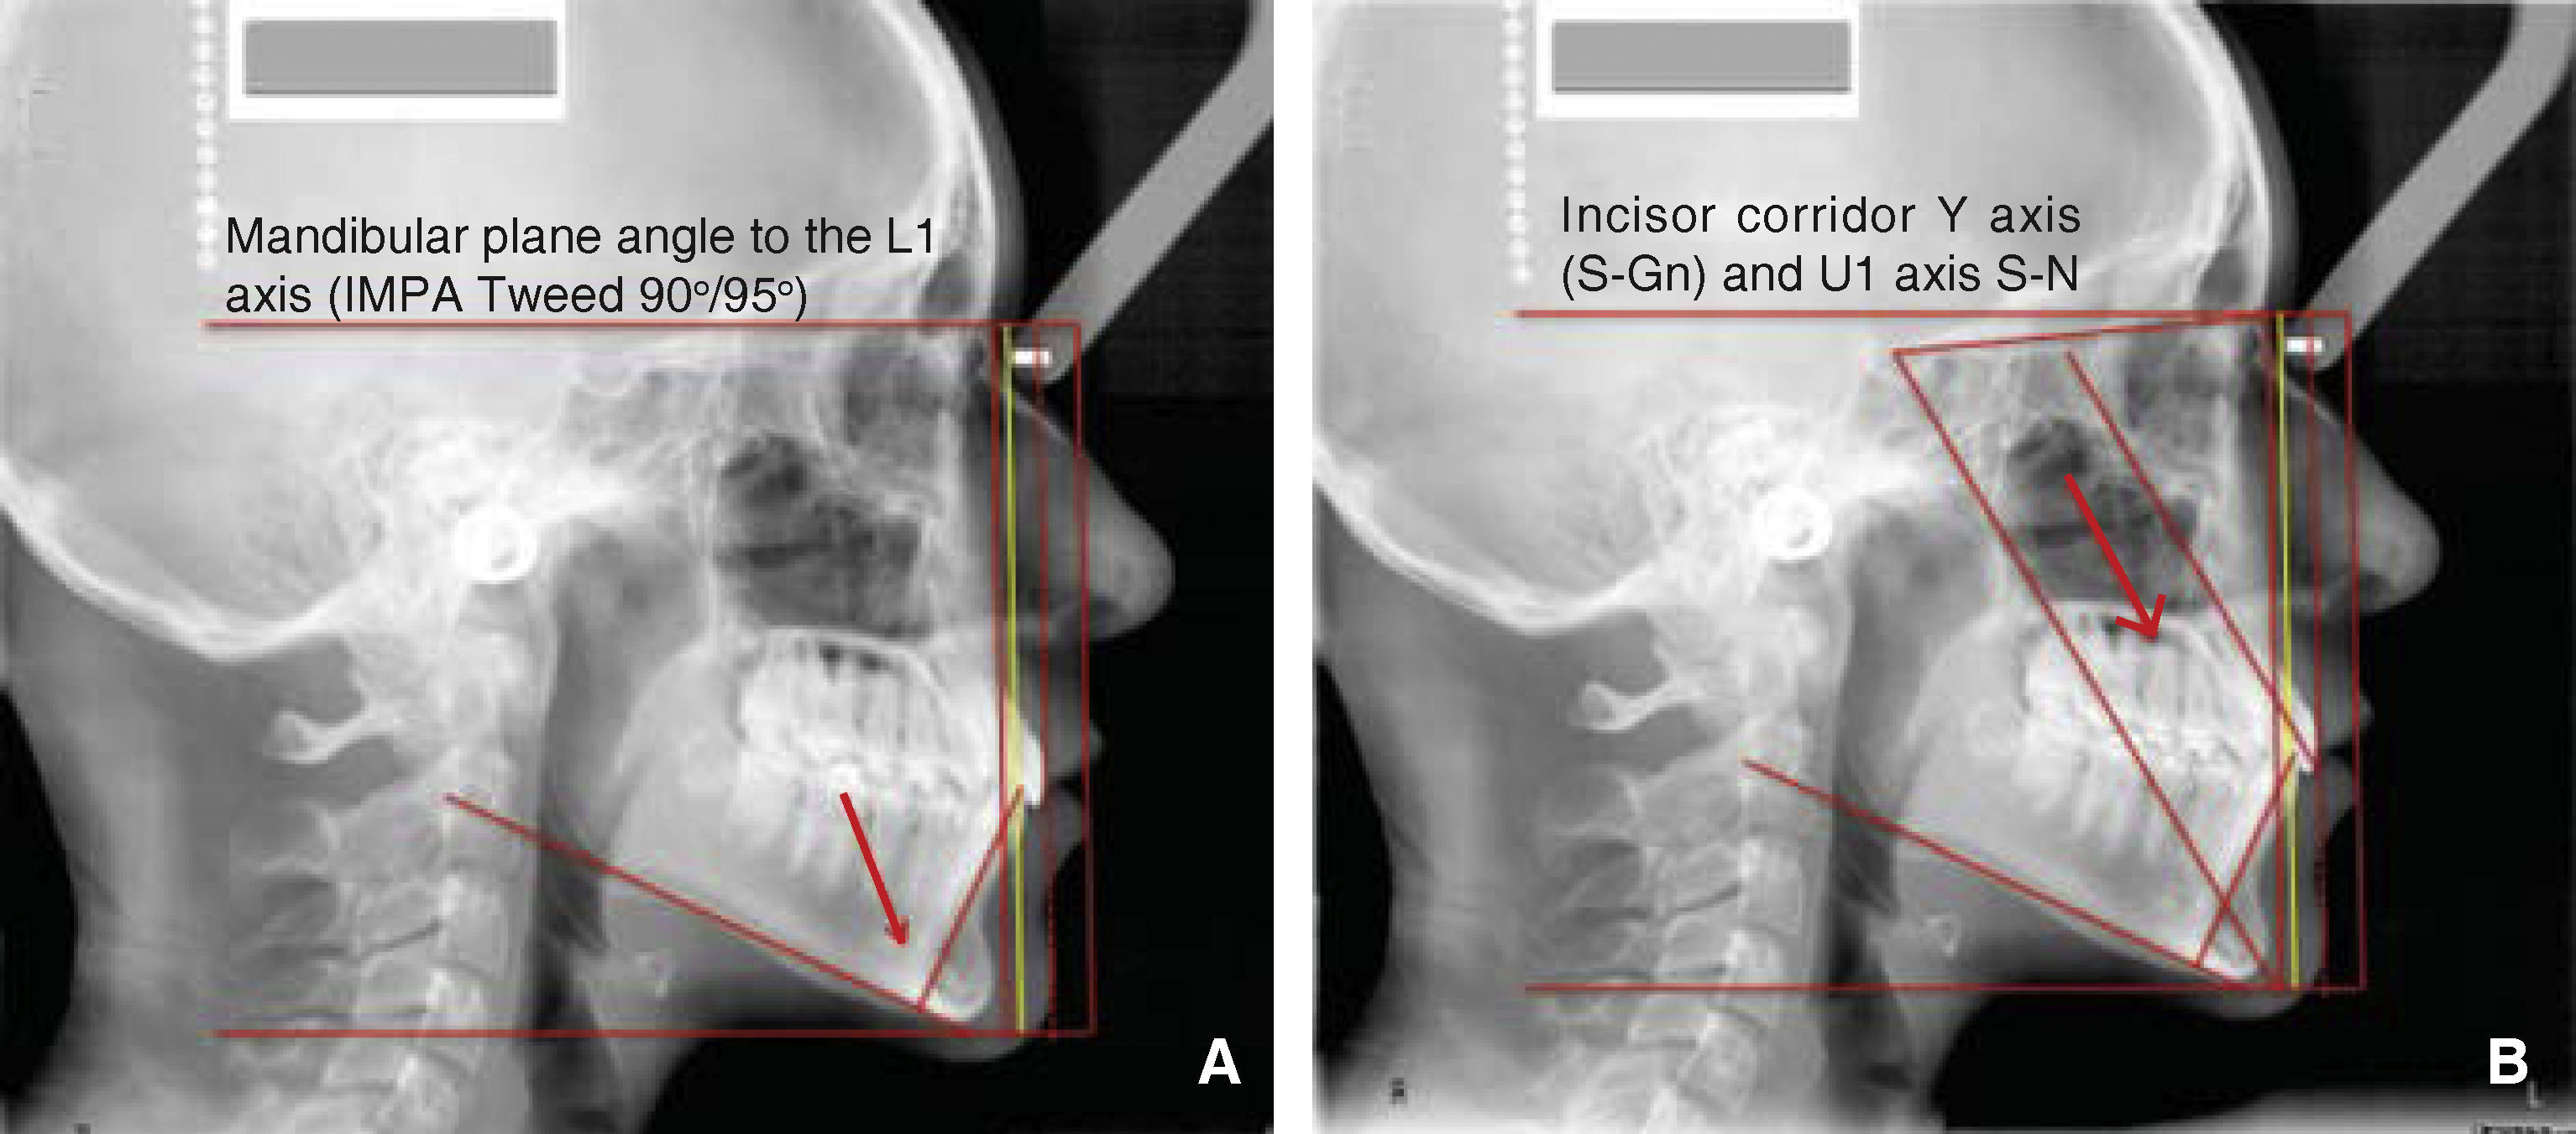
Continuing with the procedure we trace the lines for the mandibular plane (Gonion-Menton) and the lower incisor axis to display the angle of the lower incisors in relation to the mandibular body. This angle was used by Tweed15,16 who named it IMPA (incisor mandibular plane Angle), its rule is 90-95° (Figure 15A) and its interpretation defines the inclination of the lower incisors in relation to the mandibular body. It is easy to analyze this angle visually. Subsequently we draw the Silla-Nasion plane, the axis of the upper incisors and the Silla-Gnation axis (Figure 15B). The S-Gn Axis or the «Y» axis as described by Downs4 indicates the direction of facial growth and ideally, it should be parallel to the axis of the upper incisors (incisor corridor), to maintain the consistency between the condilar guide and the palatine surface of the upper incisors which is the appropriate incisal guide for functional mandibular movement. When there is NO parallelism in the incisor corridor identify both lines must be identified separately in order to detect when a problem is dental, skeletal or a combination of both.
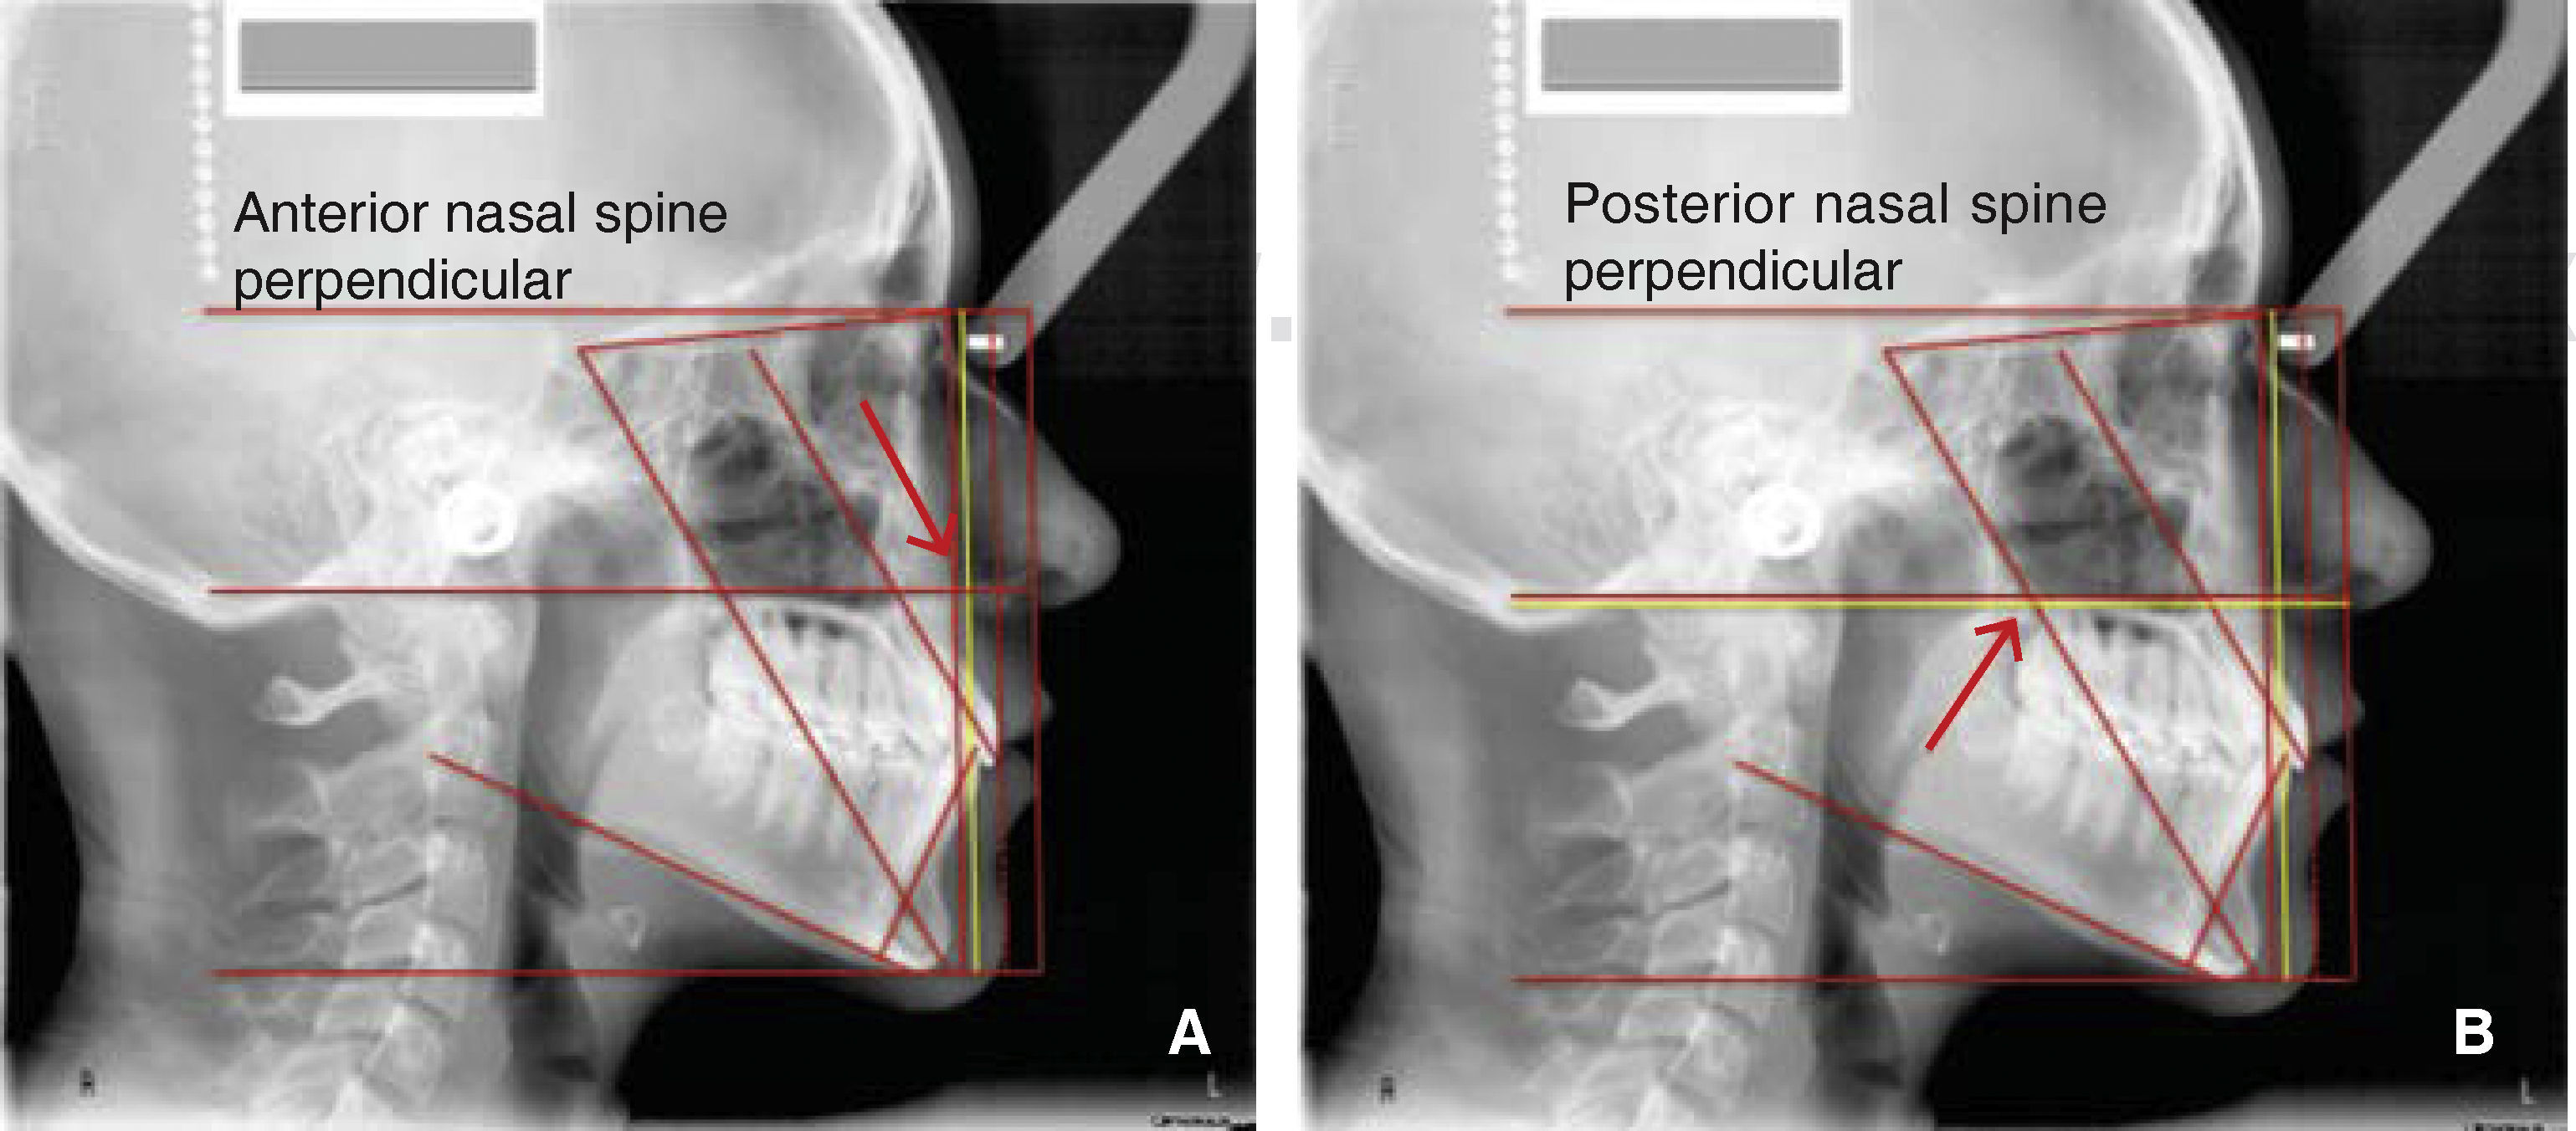
Next we created two lines parallel to the Nasion horizontal, we place one from the anterior nasal spine (Figure 16A), and the other in the posterior nasal spine. We prefer to identify the latter with some color to differentiate the location of both spines (Figure 16B). In the case where both lines are at the same level a single line is drawn. These two lines show the inclination of the palatal plane so they are drawn with a different color. The ideal position of the palatal plane is determined when the line of the posterior nasal spine is below the line of the anterior nasal spine with an inclination of approximately 2°.6,7 Ricketts6 established 2° as a norm for the palatal plane inclination when the anterior nasal spine is above the posterior nasal spine. These two lines show very easily the inclination of the palatal plane without the need to measure it. The interpretation of the inclination of the palatal plane is related to an anterior or posterior mandibular rotation. A downwards palatal plane at the back will favor a posterior mandibular rotation contributing to a Class II malocclusion, while a palatal plane with an anterior inclination will contribute to an anterior mandibular rotation thus producing a Class III malocclusion or a vertical maxillary excess.
The following horizontal tracing is located in upper Stomion (Figure 17). This line is described in the analysis of Legan-Burstone9 and offers a lot of information. Ideally the upper incisors are located below the line approximately 3mm, while the incisal edge of the lower incisors rests in this line; when this happens there is balance and harmony between the incisal guide and the position of the tongue and lips thus providing function and aesthetics (Figure 17).
To assess total facial height, we identify the horizontal lines of Nasion and menton. We then divide the face in two halves: upper and lower. In general terms the lower half is one third longer than the upper. The upper facial half is located between the Nasion horizontal line and the anterior and posterior nasal spines horizontal lines. Sometimes both are aligned and only one line is traced in the palatal plane. In this case it is easier to locate the limit between the two facial halves but when the nasal spines are located separately, we will take the intermediate distance between both as limit of the facial halves. So, the lower facial half is located from the line or lines of the anterior and posterior nasal spines to the menton horizontal line.
To facilitate its display we use Power Point tools (Microsoft® Office) to draw shapes and create a rectangle in the upper facial half figure 18A. Subsequently we will duplicate the rectangle Figure 18B and move it to the lower facial half figure 18C.
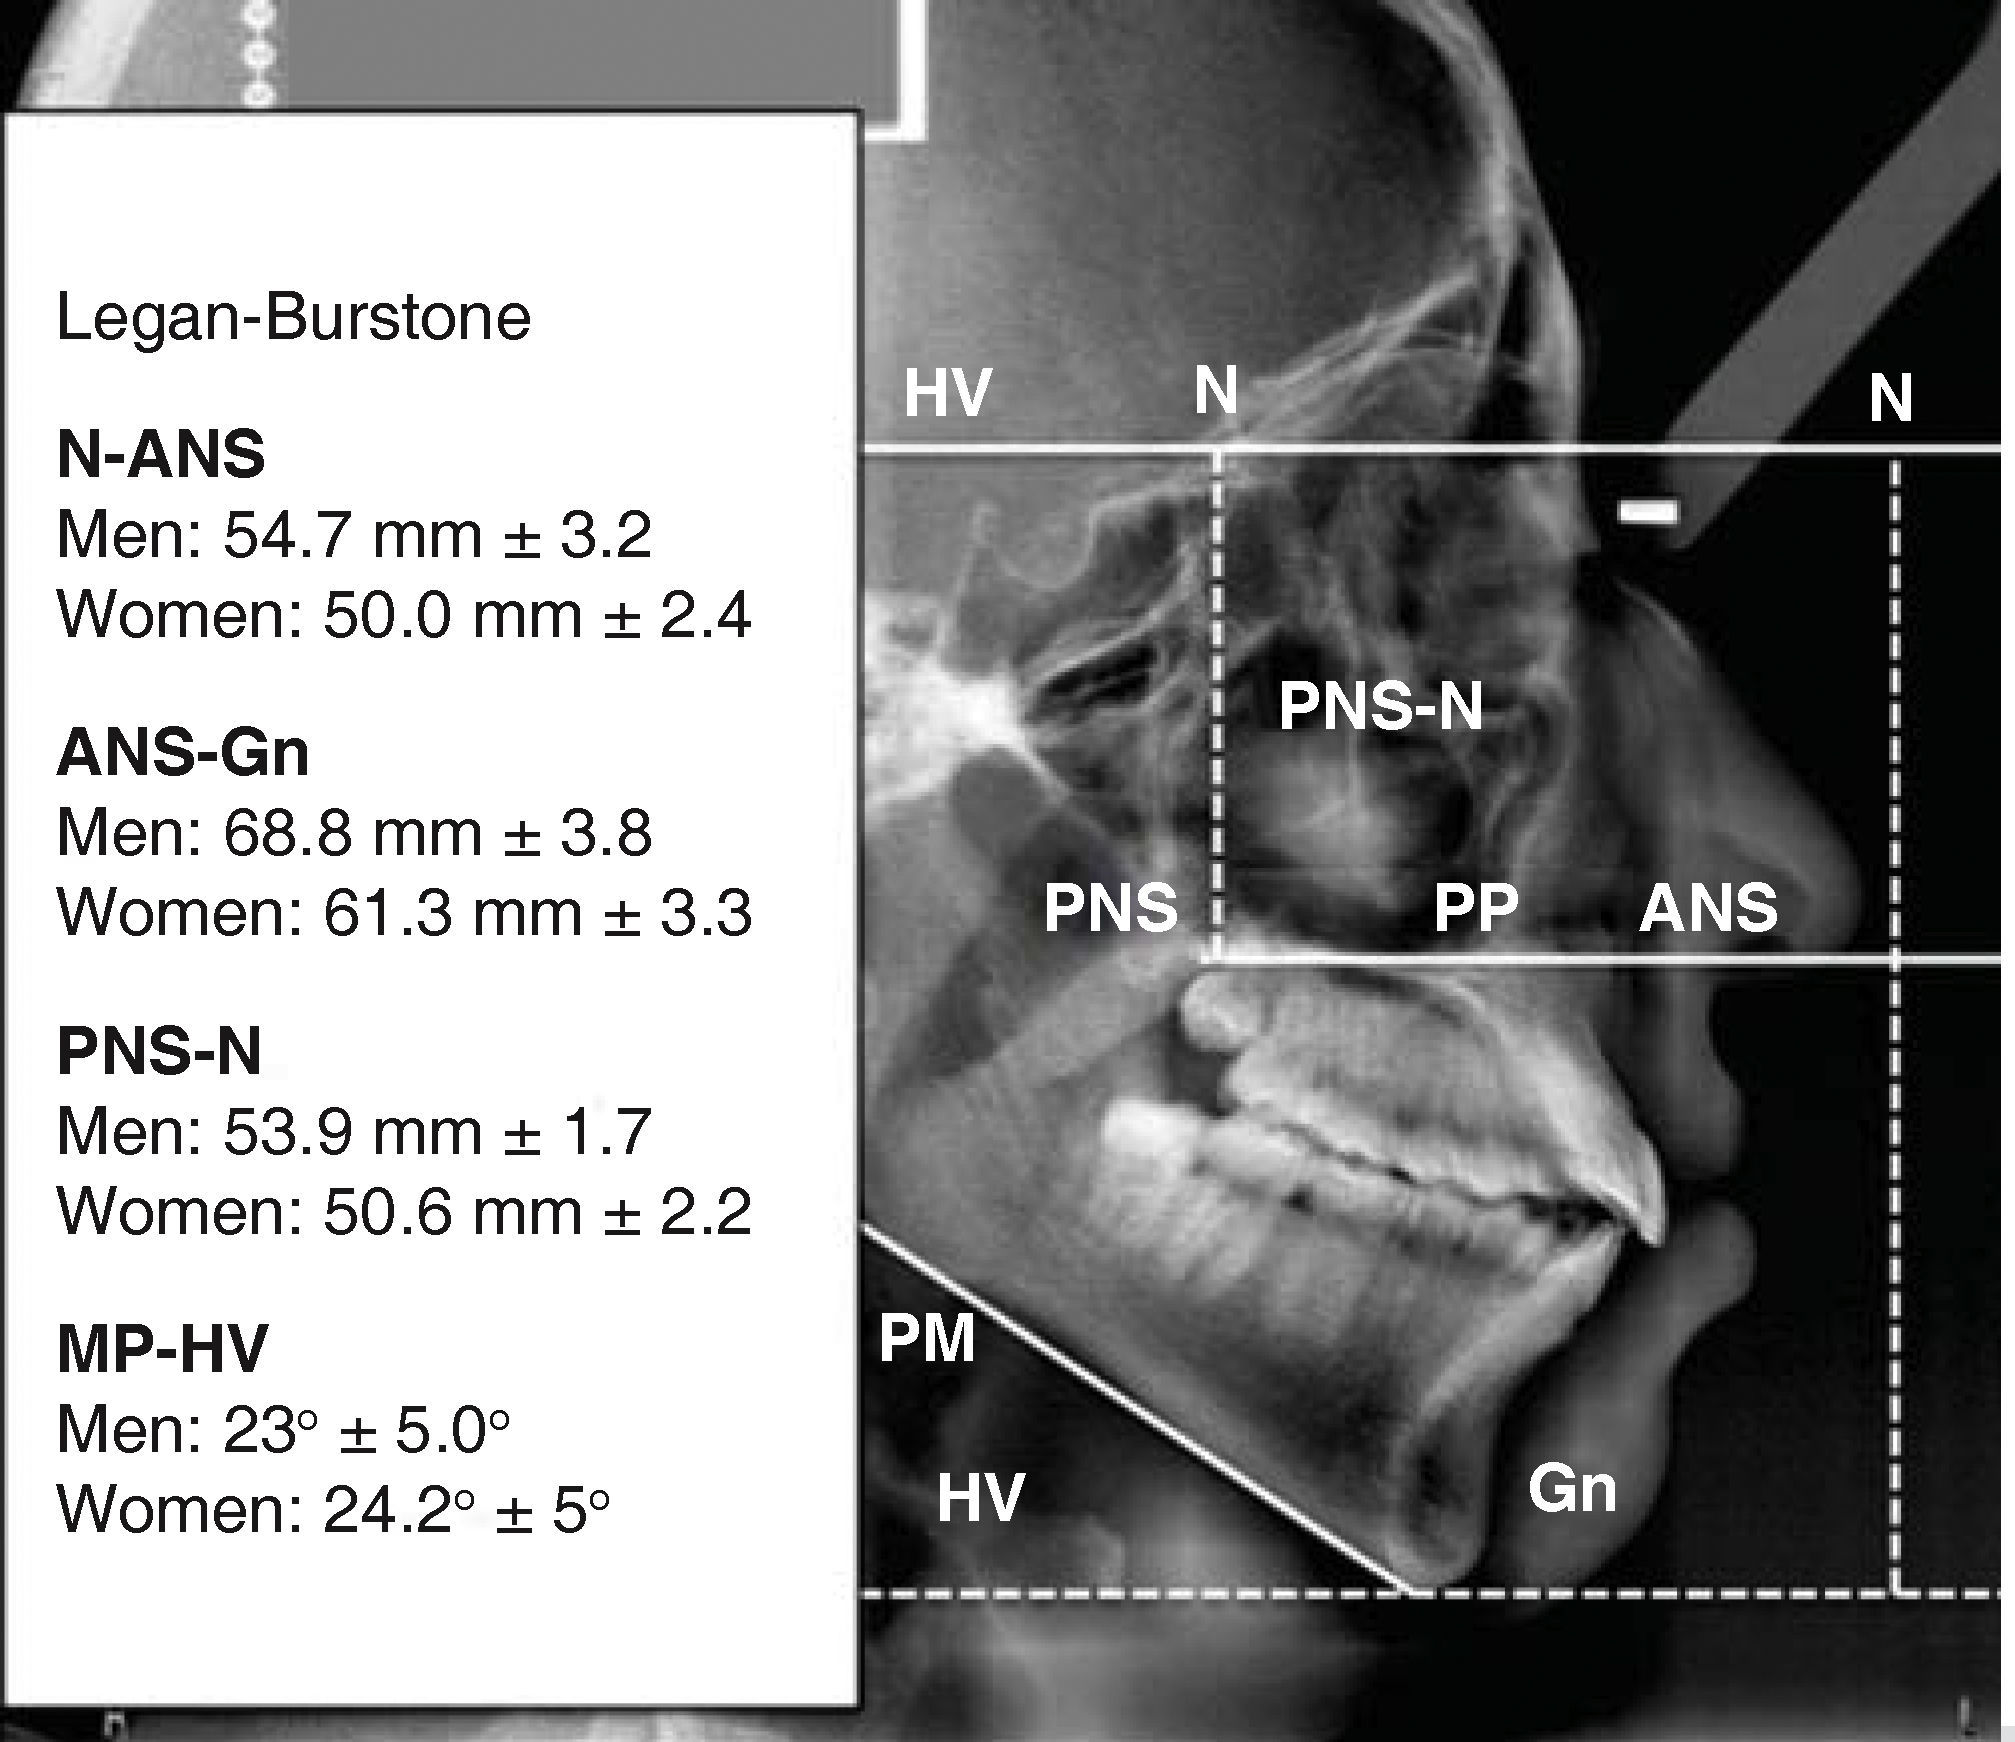
Legan and Burstone determined the following normal values for measuring the total face height (Figure 19), however, in this analysis we do not use measurements, we merely observe proportion.
The lower portion of the lower rectangle serves as a parameter to draw another horizontal line (dotted) with the aim of observing lower facial height (Figure 18C). Ideally the distance between this line and the menton horizontal represents one third of the rectangle drawn (normodivergent), when this distance increases (hyper-divergent), it relates to a vertical facial growth pattern, a postero-mandibular rotation or mandibular macrognathism. On the contrary, if it is diminished (hypo-divergent), it suggests a vertical deficiency, anterior-mandibular rotation or mandibular micrognathism.
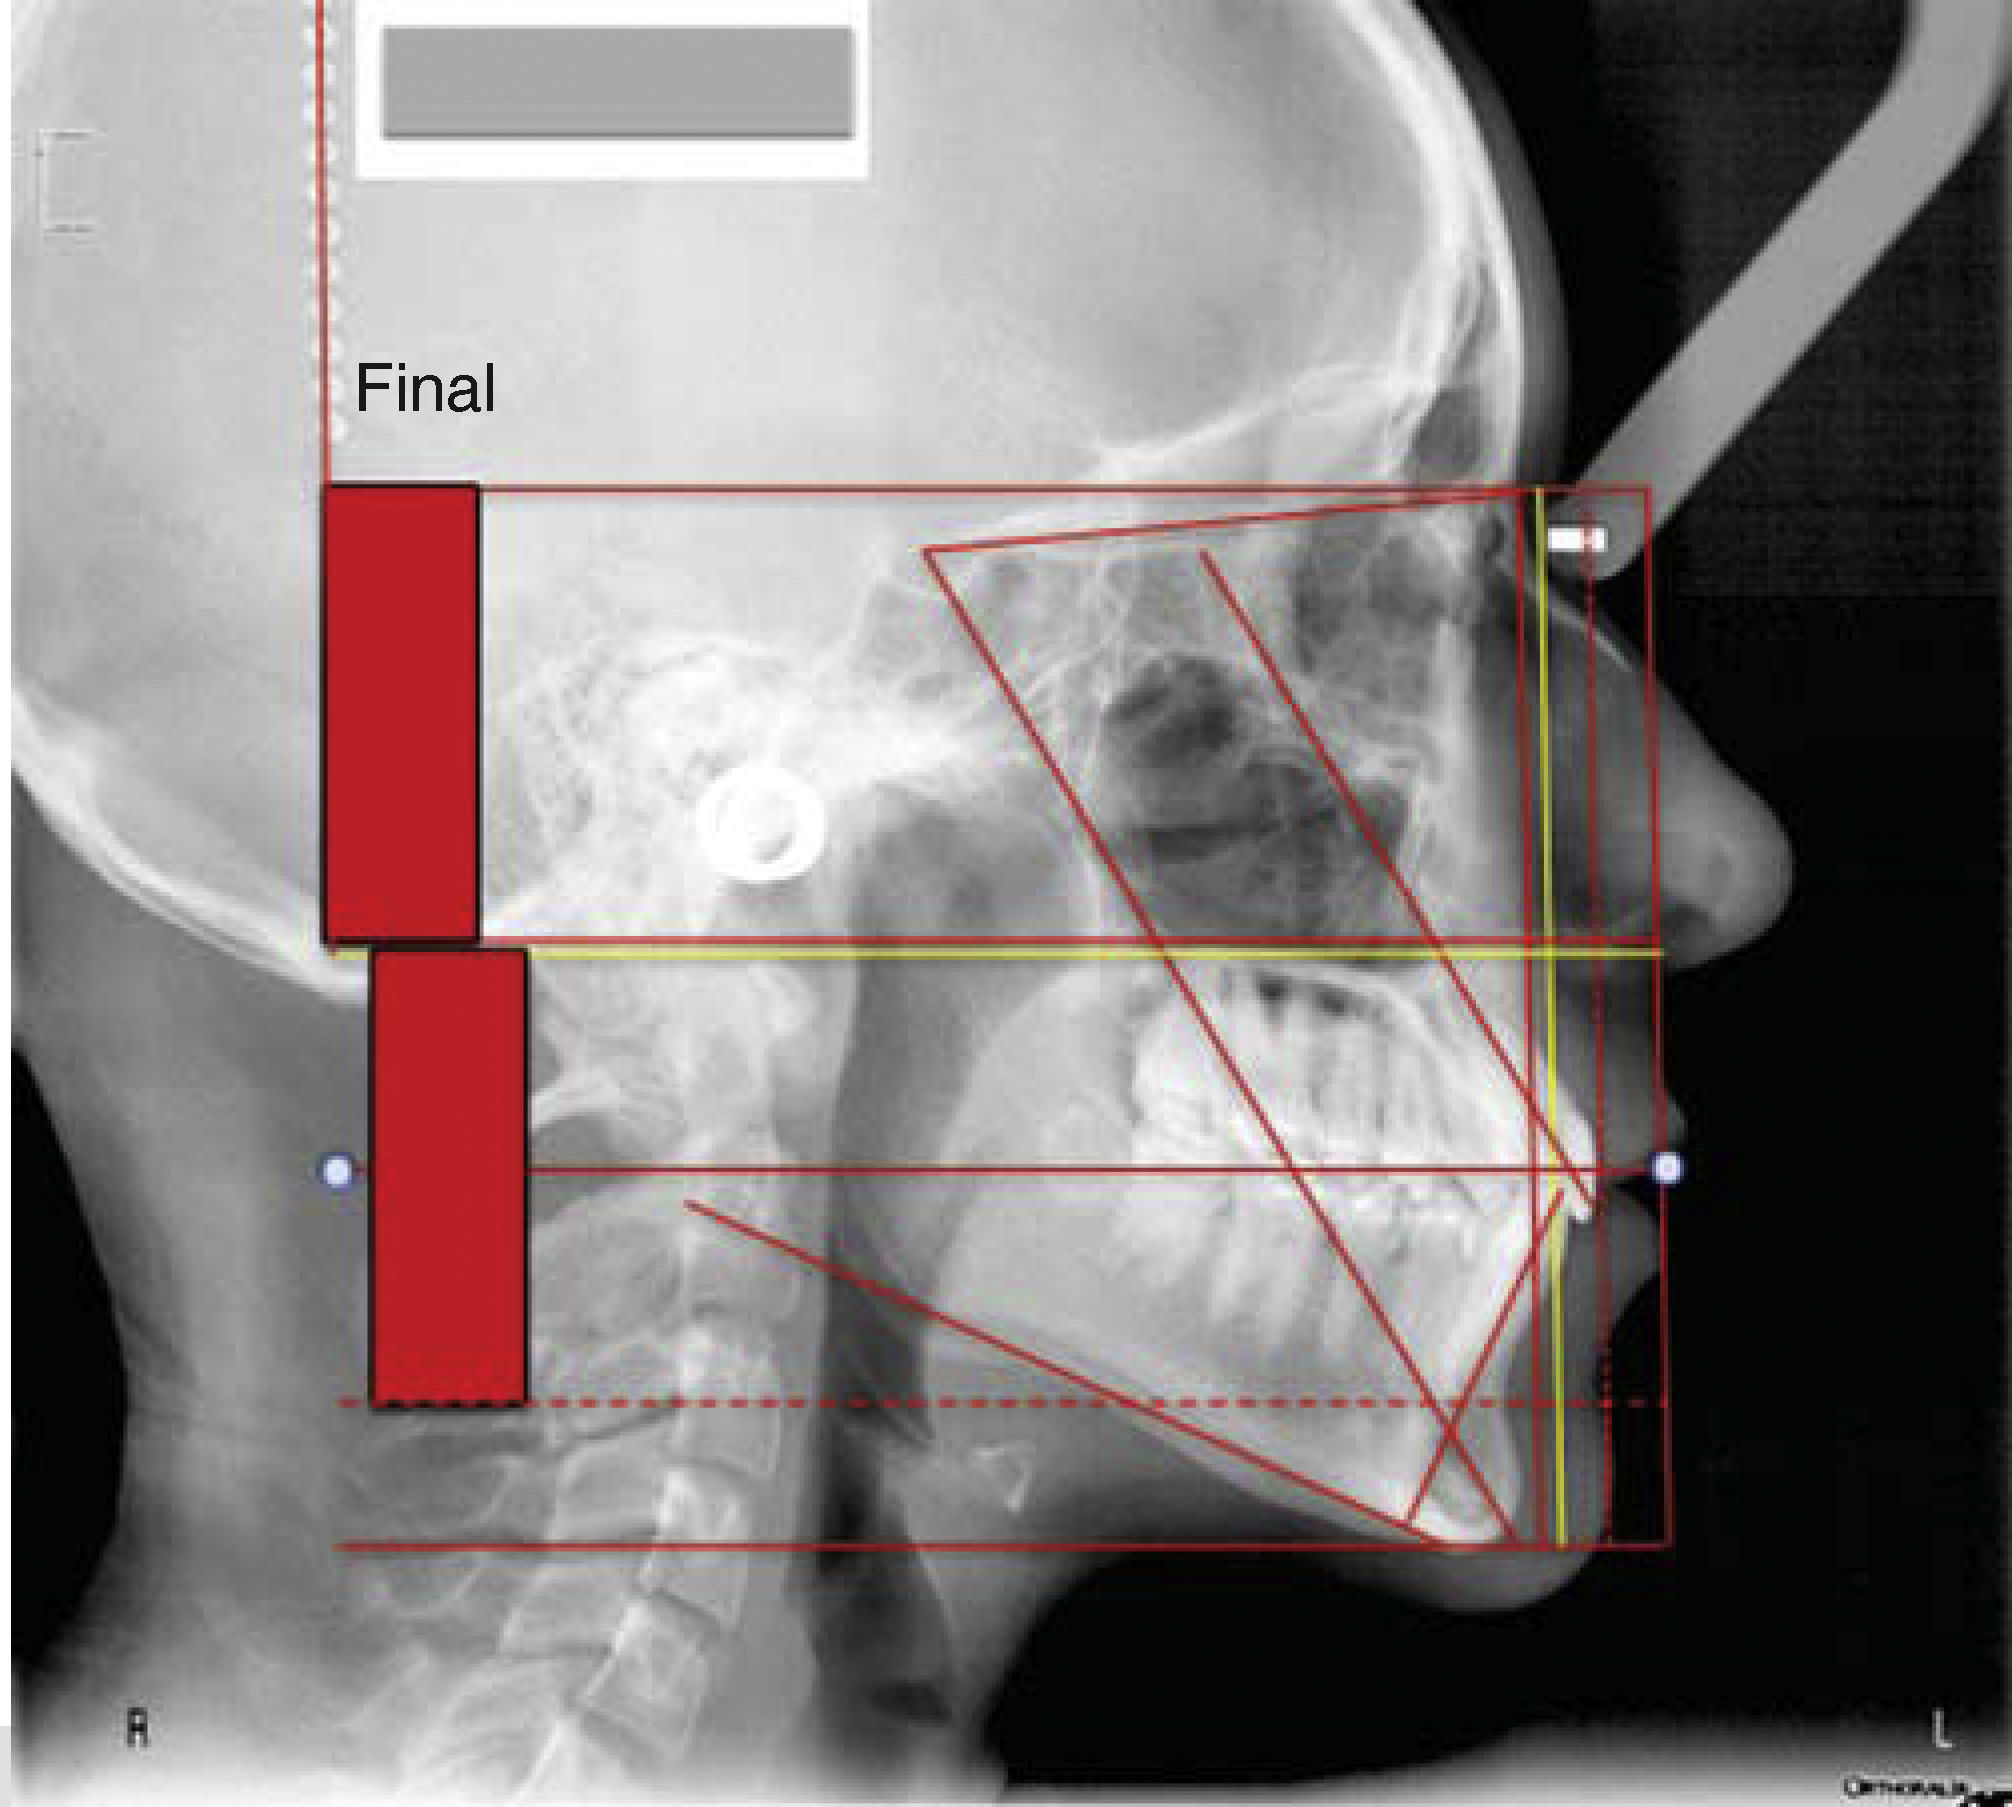
As mentioned at the beginning, we believe that the use of this cephalometric tracing in the Power Point program Microsoft® Office may be of great help for an easier view of the sagittal aspect of the lateral headfilm and at the same time linking the vertical and horizontal composition with the dynamics of the malocclusion. Figure 20 shows the tracing of the entire procedure.
DISCUSSIONAs mentioned before, the development of cephalometric analysis starts in the decade of the- 40s, and up to this modern era novelties which favor this useful tool continue to emerge. Some of the differences found between the analysis hereby presented and other diagnostic procedures are: in this method location of cephalometric structures becomes easier by using the zoom to enlarge the image. It is not necessary to perform direct measurements just by visual assessment of the tracings an accurate assessment of the facial structural condition may be created. The storage of the imaging records requires no physical space since they can currently be stored in cyber space. The main tracings are supported by a «true vertical» which may provide greater certainty of the head position. Some analyses use parameters that cast doubt on their reliability, for example; rotation of the S-N or Frankfurt planes are sensitive possibilities that may substantially alter the results of the normal values that multiple cephalometric analysis use. To determine the sagittal intermaxillary relationship in the Wits appraisal8 the occlusal plane is used for projecting a perpendicular to points «A» and «B», thus being dependent on inclinations of the occlusal plane and causing a decrease in the accuracy of its projections. In this procedure we use a vertical line from point «A» to establish the sagittal intermaxillary relationship relying more in the true vertical than in the occlusal plane.
CONCLUSIONSThe diagnostic cephalometric auxiliary hereby presented offers a practical and at reach option for the majority of professionals. Like other methods, its practice throughout time will best prove its effectiveness. Unlike other methods of cephalometric analysis this is based not solely on numbers. Although it uses numerical normal values established by prior cephalometric analysis, it relies mainly in objectivity.
Professor of the Orthodontics Department of the Latinamerican University, Valle campus, Mexico City, Mexico. Professor at the Faculty of Higher Studies Zaragoza, National Autonomous University of Mexico, Mexico City, Mexico.
This article can be read in its full version in the following page: http://www.medigraphic.com/ortodoncia


