


The aim of this study was to determine the relationship between different facial biotypes of a skeletal class II population with the area and volume of the pharyngeal airway.
Material and methodsThe sample was composed by 111 cone-beam CT scans of class II individuals, (women 15 to 40 years and men 18 to 40 years of age). The sample was divided into three groups according to facial biotype: 43 for the brachifacial group, 43 for the dolichofacial groupand 25 for the mesofacial group. In order to determine the airway dimensions the volume and the area were considered. The pharynx was divided in two areas: oropharynx and hypopharynx. Asection was performed through the center of the axial view. This slice was transformed into a sagittal view, where the area was obtained. In this view, the narrowest area was also identified and in the axial view it was contoured to determine the area. To determine the volume the same planeswere obtained.
ResultsBoth the areas as well as the volumes of the pharyngeal airway of individuals class II showed no significant differences in relation to facial biotype. The narrowest area, which was more frequently found in the oropharynx, did not show significant differences either.
El objetivo de este estudio fue determinar la relación que existe entre los distintos biotipos faciales de una población clase II esquelética con el área y volumen de la vía aérea faríngea.
Material y métodosLa muestra se conformó por 111 tomografías computadas cone-beam de individuos clase II, (mujeres de 15 a 40 años y hombres de 18 a 40 años de edad). Se dividieron en tres grupos de acuerdo con el biotipo facial: 43 para el grupo braquifacial, 43 para el grupo dolicofacial y 25 para el grupo mesofacial. Para determinar las dimensiones de la vía aérea se tomó en cuenta el área y el volumen. La faringe fue dividida en dos zonas: orofarínge e hipofarínge. Se realizó un corte por el centro de la vista axial, este corte se pasó a una vista sagital, donde se tomó el área, en esta vista también se identificó la zona más estrecha y en la vista axial se contorneó para determinar el área. Para determinar el volumen fueron tomados los mismos planos.
ResultadosTanto las áreas como los volúmenes de la vía aérea faríngea de los individuos clase II no mostraron diferencias significativas en relación con el biotipo facial. Tampoco mostraron diferencias significativas las áreas de la zona más estrecha la cual se ubicó más frecuentemente en la orofarínge.
Breathing is an essential functional process that is performed dynamically and involuntarily and that is related to the pharyngeal airway through swallowing and phonation.1–3
The pharyngeal airway is composed of three parts: nasopharynx, oropharynx and hypopharynx. The nasopharynx is a tube in the form of a cone that consists of muscles and mucosa and forms the upper part of the respiratory system. It is located behind the nasal cavity and above the soft palate; at its upper portion, it is connected to the nasal cavity and in the lower portion, it continues into the oropharynx which starts in the oral cavity and is located between the soft palate and the hyoid bone.4 The hypopharynx joins the oropharynx at the pharyngeal-epiglotic fold level and the hyoid, continuing up to the level of the sixth cervical vertebra. The location and function of the nasopharynx and oropharynx is of vital importance because both are part of the unit where breathing and swallowing occur.4,5 The increased activity of the nasal area stimulates the tissues of the nose, sinuses and paranasal circulation and may have a favorable influence on general facial morphology and dental occlusion.1,2,6
When there is a normal nasopharyngeal function, the mouth is keptclosed, while at rest, muscular groups work together in balance thus guiding the growth of the maxillae. Air enters through the nostrils and creates a column that pushes the palate down. The correct position and function of the tongue determines the height and transverse dimension of the palatal vault. All this promotes a harmonious craniofacial and dental growth and development. It must be borne in mind that mouth breathing may appear without any evident obstructions, it may be something acquired from birth, due to bad habits.7
When an obstruction of the pharyngeal airway exists, the air that enters directly through the mouth does not receive a cleaning, heating or humidification treatment before passing on to the lower airways. This causes a drying effect that affects oral hygiene and increases the chance of infections. The adenoids and tonsils suffer hypertrophy as a defensive reaction and may reach a volume that accentuates the respiratory difficulties,7 thus preventing the passage of air through these channels. The result may be that the individual breathes through the mouth and develops an adaptive posture of the head and neck region structures.1,2,6 The position of the skull is situated 5° below, to facilitate the passage of air through the oral cavity, which in turn leads to the downwards and backwards rotation of the mandible, a lower position of the tongue and an increase in the lower facial third thus producing a dolichocephalic profile,8 although some studies claim that there is not one isolated cause for this condition.9,10
The facial changes that a person with an obstructed airway presents are: increase of the lower facial third, long and narrowface, underdevelopment of the nasal bones; deep, dark rings under the eyes; open mouth, lip incompetence, narrownostrils, pale skin, flaccid cheeks, hypertrophy of the chinmuscles, short and incompetent upper lip, thick and everted bottom lip, chapped and dry lips with cracks at the commissures.5,7
MATERIAL AND METHODSThis was a comparative, observational and crosssectional study, performed in a significant convenience sample of 111 CT scans obtained from files of the years 2013 and 2014 of a radiological center in the city of Guadalajara, Jalisco.
The inclusion criteria were: CT scans of male patients 18 to 40 years of age and female patients 15 to 40 years of age, skeletal class II, with an ANB angle of more than 4° and with complete permanent dentition. The exclusion criteria of: CT scans of patients with severe facial asymmetry or with cleft palate.
Each tomography was leveled with the Frankfurt plane parallel to the true horizontal line (THL) and using the same tomography, the skeletal class II was determined through the ANB angle. Patients were considered class II when their ANB angle was higher than 4°.
The widest dimension of the face corresponds to the bi-zygomatic distance. The facial biotype was determined according to the proportions given by the width (left zygomatic arch- right zygomatic arch, Za-Za) and height (Trichion -line of hair implantation - to Menton - mid-point of the lower edge of the soft tissue chin -). The following proportions were considered: brachifacial< 1.33:1, mesofacial: 1.34:1, 1.35:1, 1.36:1, dolichofacial > 1.37:1.
Twenty-five CT scans were selected for the class II mesofacial biotype group and 43 CTs for each of the groups of class II brachifacial biotype and class II dolichofacial biotype.
In the airway, the reference lines were located in the center in the coronal and axial views. In the sagittal view the reference line was placed horizontally at the level of the Posterior Nasal Spine taking care to ensure that the image was found parallel to the floor (Figure 1).

The pharyngeal airway was divided in two: oropharyngeal airway (OPA) and hypopharyngeal airway (HPA). The first was delimited in its upper portion by a plane parallel to the Frankfurt horizontal, which consists of the Posterior Nasal Spine (PNS) to an intersection point with the posterior wall of the pharynx. The lower edge was delimited by a horizontal that passed through the most anterior and superior point of the second cervical vertebra (Figure 2). This plane was also the upper limit of the HPA and the lower edge was delimited by a horizontal that passed by the anterior and superior point of the third cervical vertebra (Figure 3). Using the program ANATOMAGE, from the sagittal plane, both areas were delimited and calculated by placing points that contoured each one of the segments.

 was delimited to obtain the area.")
In the sagittal view the narrowest area was also identified (Figure 4). The horizontal reference line was positioned in this area; the image was taken to an axial view where the contour was drawnto obtain the area of this zone (Figure 5).


All images were converted to a DICOM format (Digital Imaging and Communication in Medicine) and opened with the program Dolphin Imaging 3D. Removing the hard tissues of the image optimized the 3D view of the airways. The desired zone to measure was defined (OPA or HPA) by increasing the size of the image to improve the vision. The volume of each area was obtained as well as the total volume of the pharyngeal airway (Figures 6 to 9).


The mean values were calculated for each biotype of the narrowest area of the pharynx and areas and volumes of the pharyngeal airway, OPA and the HPA. In the statistical analysis, the arithmetic mean and standard deviation were calculated. The comparisons were performed by means of the Student's T test.
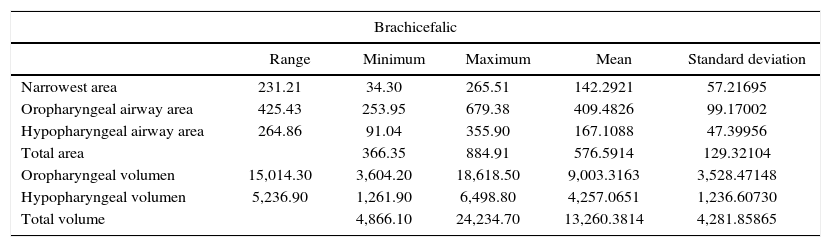
RESULTSTable I shows the values obtained for the different areas and volumes.
Areas and volumes according to the facial pattern.
| Brachicefalic | |||||
|---|---|---|---|---|---|
| Range | Minimum | Maximum | Mean | Standard deviation | |
| Narrowest area | 231.21 | 34.30 | 265.51 | 142.2921 | 57.21695 |
| Oropharyngeal airway area | 425.43 | 253.95 | 679.38 | 409.4826 | 99.17002 |
| Hypopharyngeal airway area | 264.86 | 91.04 | 355.90 | 167.1088 | 47.39956 |
| Total area | 366.35 | 884.91 | 576.5914 | 129.32104 | |
| Oropharyngeal volumen | 15,014.30 | 3,604.20 | 18,618.50 | 9,003.3163 | 3,528.47148 |
| Hypopharyngeal volumen | 5,236.90 | 1,261.90 | 6,498.80 | 4,257.0651 | 1,236.60730 |
| Total volume | 4,866.10 | 24,234.70 | 13,260.3814 | 4,281.85865 | |
| Dolicocephalic | |||||
|---|---|---|---|---|---|
| Range | Minimum | Maximum | Mean | Standard deviation | |
| Narrowest area | 236.37 | 51.42 | 287.79 | 140.0147 | 65.21640 |
| Oropharyngeal airway area | 509.98 | 245.50 | 755.48 | 428.1379 | 103.46693 |
| Hypopharyngeal airway area | 224.18 | 73.71 | 297.89 | 150.0665 | 49.43251 |
| Total area | 357.76 | 853.20 | 578.2044 | 127.79496 | |
| Oropharyngeal volumen | 18,383.0 | 4,312.70 | 22,695.70 | 9,461.4093 | 3,834.82445 |
| Hypopharyngeal volumen | 8,893.10 | 1,388.20 | 10,281.30 | 3,899.9128 | 1,824.97284 |
| Total volume | 6,543.50 | 26,857.40 | 13,361.3221 | 4,967.35309 | |
| Mesocephalic | |||||
|---|---|---|---|---|---|
| Range | Minimum | Maximum | Mean | Standard deviation | |
| Narrowest area | 281.63 | 42.10 | 323.73 | 154.0128 | 80.07647 |
| Oropharyngeal airway area | 574.70 | 200.00 | 774.70 | 417.8172 | 139.84416 |
| Hypopharyngeal airway area | 138.40 | 97.40 | 235.80 | 163.1704 | 43.40984 |
| Total area | 311.10 | 970.29 | 580.9876 | 166.06566 | |
| Oropharyngeal volumen | 26,578.90 | 1,167.80 | 27,746.70 | 8,912.3040 | 5,267.81894 |
| Hypopharyngeal volume | 3,823.60 | 1,698.00 | 5,521.60 | 4,132.5240 | 967.14767 |
| Total volume | 6,058.50 | 32,301.90 | 13,044.8280 | 5,625.67086 | |
OPA area: The OPA area of the brachifacial biotype turned out to be smaller in size. For the dolichofacial group the values were higher, although these differences were not statistically significant (p < .05).
HPA area: In dolichofacial patients the area was smaller than in the other groups. When comparing the mesofacial group with the brachifacial and dolichofacial groups, the differences were not statistically significant, while when comparing the brachifacial group with the dolicofacial group the differences were significant (p ≤ .05).
Total area of the pharyngeal airway: No statistical differences were found between groups for this area (p ≤ .05).
Area of the narrowest zone: The narrowest zone was found most often in the oropharynx. This was true for the three facial biotypes. The size of the area of the narrowest zone showed no statistical difference between the dolichofacial and the brachifacial group, however the mesofacial group showed a larger area compared to the other groups. When the comparison of the results obtained in each group was made, the differences were not statistically significant (p < .05).
OPA volume: The dolichofacial group presented a higher volume in this area. The analysis was made by comparing each of the groups thus obtaining that the results did not show significant differences (p ≤ .05).
HPA volume: The brachiifacial group showed the greatest volume and the smaller, the dolichofacial group. When performing the statistical analysis, significant differences were found when comparing the mesofacial group with the brachifacial and dolichofacial groups (p ≤ .01).
Total volume of the pharyngeal airway: There were no statistically significant differences between the three biotypes (p ≤ .05), except in the HPA area between the dolichofacial and braquifacial biotypes and in the volume of the mesofacials with respect to the brachfacials and dolichofacials.
DISCUSSIONThe relationship between pharynx dimensions and craniofacial growth has been of great interest for a long time, not only for orthodontists but also for pediatricians, otorhingolaryngologists, allergists, among others.
Ghoneima and Kula11 in their investigation in 3D CBCT asserted that the measurements of volume and area of the narrowest zone of the airway are accurate and reliable. Therefore CT scans provide the best conditions for the volumetric analysis and accurate visualization of the airway.
In this study conducted in non-growing skeletal class II patients the relationship between different facial biotypes and the dimensions of the pharynx is discussed. It was found that there was no significant association.
A 3D study by Wang et al.12 in adult skeletal class II patients affirms that the vertical growth patterns have a significantly narrower dimension of the pharyngeal airway than those with normal or horizontal growth patterns which suggests an association between measurements of the pharyngeal airway and a vertical skeletal pattern. Oz U and cols.2 in their study showed that class II patients with vertical growth presented significantly smaller measurements of the upper airway that those with horizontal and neutral growth. Previous studies do not coincide with the results obtained through the present research since, although there were differences in the airway dimensions between different facial biotypes, these were not statistically significant.
Chiang et al.13 have reported that the size of the nasopharynx is closely related to skeletal growth and age. They mention that in women growth ceases at the age of 15 whereas in men, growth occurs at a faster pace from the age of 12 and continues until the age of 18. In this study, the selected patients did not have growth potential: the sample was formed by female patients 15 years and older and men, 18 years and older.
There are reports with similar results to the ones here by described. The study by Dr. Verdugo4 performed in lateral headfilms of children 6 to 10 years of age determined that there is no association between the pharyngeal airway size and the direction of facial growth. Cantú14 concluded that there is no relationship between the presence of characteristic clinical signs of obstruction and obstruction in the lateral headfilm. Also no significant differences were found in respiratory obstruction between facial biotypes. Murúa et al,10 conducted a study in teleradiographies of class II patients with vertical growth grouped according to the etiology of class II and found no particular characteristics in the diameter of the airway in the different studied groups.
Assessment of the airways to diagnose potential risks of sleep apnea, as well as locate the less permeable area, for a long time has been performed mainly in lateral headfilms, which show limitations such as distorted dimensions, differences in increases, overlap of bilateral craniofacial structures, and low reproducibility as a result of the difficulties in landmark identification. Another major drawback of lateral headfilms is the lack of information on the area of cross section and volume.11
The study shows that the diminished OPA dimensions in class II patients do not have an association with a vertical growth pattern in women 15 to 40 years and in men 18 to 40 years old.
The area corresponding to the OPA turned out to be larger in patients with a dolichofacial biotype while in the HPA the result was the opposite: the area was larger in brachifacial patients. When both areas are added, their size was practically the same for the three facial biotypes.
In the case of volumes, they behaved in the same way although the differences were not significant.
The dimensions of the narrowest area were higher for mesofacials in relation to the other two biotypes, but the differences were not significant. The narrowest area was found most often in the oropharynx.
Therefore, in individuals with skeletal class II malocclussions and dolichofacial biotype, the pharyngeal airway did not present less area or volume in comparison with brachifacial and mesofacial patients.
Graduate from the Orthodontics Specialty, Autonomous University of Nayarit.
This article can be read in its full version in the following page: http://www.medigraphic.com/ortodoncia