


To assess whether there is a variation in the values of Bolton index, making measurements manually or digitally.
Material and methods70 pairs of study models were analyzed and measured on two occasions: one using a compass and a millimeter rule, and the other using an electronic vernier.
ResultsNo statistically significant difference was found between the two measurements.
ConclusionBoth ways to perform mesiodistal dental measurements are good choices for Bolton analysis.
Evaluar si existe una variación en la medición del índice Bolton, realizando las medidas de manera manual y de manera digital.
Material y métodosSe analizaron 70 pares de modelos de estudio; los cuales fueron medidos en dos ocasiones; mediante el uso de un compás y una regla milimetrada, y mediante el uso de un vernier electrónico.
ResultadosNo se encontró diferencia estadísticamente significativa entre ambas mediciones.
ConclusiónLas dos formas de realizar la medición dental mesiodistalmente son buenas opciones para el análisis de Bolton.
The size ratio of maxillary and mandibular teeth, specifically mesiodistal dental width, is an important aspect in diagnosis and treatment planning for an individual. Discrepancies in tooth size should be identified early during diagnosis and initial treatment in order to obtain an ideal result. Tooth size relationships represent a valuable diagnostic tool that may provide a prediction of the results of treatment and may also limit the need for diagnostic configurations in complex cases.1–3
Wayne A. Bolton in 1958 formulated a total analysis and an anterior analysis to estimate the discrepancy in the size of the teeth by measuring and comparing the mesiodistal widths of the dental arches including the distal surfaces of the first molars, as well as the anterior segment (from canine to canine). This analysis is often referred to as «analysis of Bolton», for he investigated the relationship between the mesiodistal diameters of the upper and lower tooth crowns on the basis of 55 patients with excellent occlusion, including 44 treated with orthodontics (without extractions) and 11non-treated subjects.4–8
Bolton introduced two indexes. The anterior Bolton index is obtained by dividing the mesiodistal size of the 6 mandibular anterior teeth (canine to canine) by the mesiodistal size of the 6 upper anterior teeth; the total Bolton index is obtained by dividing the mesiodistal size of the 12 mandibular teeth (first molar to first molar) by the mesiodistal size of the 12 maxillary teeth.9
However, extrinsic factors such as sexual dimorphism, race and ethnic variation, type of malocclusion, anterior teeth inclination, incisal edge and arches thickness and smile may affect this proportion which usually requires adjustments in the anterior relationship as Bolton described. In other words, a high or low Bolton ratio does not necessarily reflect the actual discrepancy and an ideal index does not guarantee an ideal occlusion.10
Through this research it is sought to know if there is a variation in the total Bolton index or the anterior Bolton index by performing the mesiodistal width measurement of each tooth manually (through the use of a compass and rule in millimeters) or using an electronic Vernier.
MATERIAL AND METHODSA comparative study was conducted in which 70 pairs of study models were analyzed. The models were obtained from patients who attended the Post- graduate Orthodontics and Dentomaxillofacial Orthopedics Program of the UASLP of whom 50% were female patients and 50% male patients.
The criteria for model selection were: 1) permanent dentition from first molar to first molar, 2) good quality of the casts (models without negative or positive bubbles that may alter the mesio-distal dental diameter), 3) models that do not present teeth with extensive restorations that may modify mesiodistal dental width.
In each model the dental crowns were measured mesiodistally from first molar to first molar. Such measurement was performed on two occasions: the first through the use of a compass and a rule in millimeters, the second using a digital caliper (Figures 1 and 2).


The sum of the diameters of the lower teeth was divided by the sum of the diameters of the upper teeth and the result was multiplied by 100 to obtain the total Bolton index. The sum of the diameters of the anterior teeth, from canine to canine, was also obtained and then the sum of the lower was divided by the upper and the result multiplied by 100 to obtain the anterior Bolton index.3,4
The statistical analysis was obtained using the MINITAB software (version 16). The normality of the variables was analyzed and a «t» test was performed to determine the significance.
RESULTSNo significant differences were found in the total or the anterior Bolton index when comparing digital measurement vs manual measurement or between the group of male patients and the group of female patients.
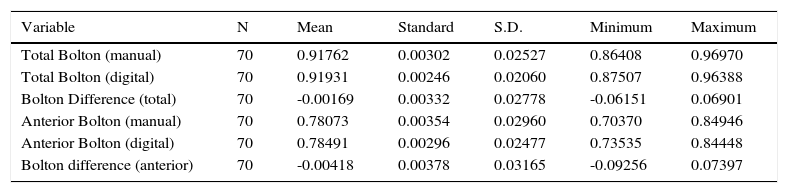
Through the manual measurement a total Bolton index of 0.91762 was obtained; with a standard deviation of 0.02527; while digitally, a total Bolton index of 0.91931 was obtained with a standard deviation of 0.02060 resulting in a difference of 0.00169 between both. An anterior Bolton index 0.78073 was obtained manually with a standard deviation of 0.02960 and digitally it resulted in 0.78491 with a standard deviation of 0.02477 thus having a difference of 0.00418 (Table I).
Descriptive statistics for anterior and total Bolton.
| Variable | N | Mean | Standard | S.D. | Minimum | Maximum |
|---|---|---|---|---|---|---|
| Total Bolton (manual) | 70 | 0.91762 | 0.00302 | 0.02527 | 0.86408 | 0.96970 |
| Total Bolton (digital) | 70 | 0.91931 | 0.00246 | 0.02060 | 0.87507 | 0.96388 |
| Bolton Difference (total) | 70 | -0.00169 | 0.00332 | 0.02778 | -0.06151 | 0.06901 |
| Anterior Bolton (manual) | 70 | 0.78073 | 0.00354 | 0.02960 | 0.70370 | 0.84946 |
| Anterior Bolton (digital) | 70 | 0.78491 | 0.00296 | 0.02477 | 0.73535 | 0.84448 |
| Bolton difference (anterior) | 70 | -0.00418 | 0.00378 | 0.03165 | -0.09256 | 0.07397 |
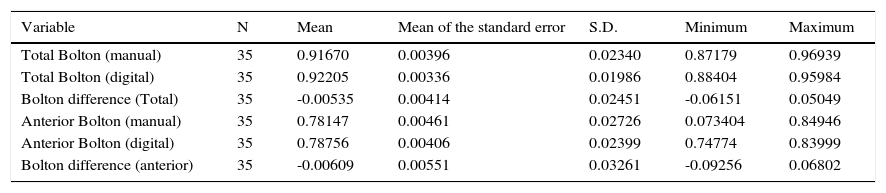
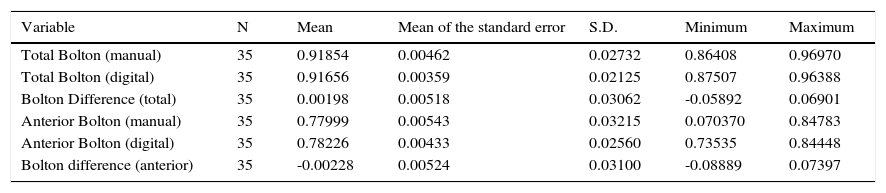
In the female group, the Bolton total index difference was -0.00535, while that of the anterior Bolton index was -0.00609 (Table II). For the male group the differences were of 0.00198 and -0.00228 in the total and anterior Bolton, respectively (Table III).
Descriptive statistics for the female group.
| Variable | N | Mean | Mean of the standard error | S.D. | Minimum | Maximum |
|---|---|---|---|---|---|---|
| Total Bolton (manual) | 35 | 0.91670 | 0.00396 | 0.02340 | 0.87179 | 0.96939 |
| Total Bolton (digital) | 35 | 0.92205 | 0.00336 | 0.01986 | 0.88404 | 0.95984 |
| Bolton difference (Total) | 35 | -0.00535 | 0.00414 | 0.02451 | -0.06151 | 0.05049 |
| Anterior Bolton (manual) | 35 | 0.78147 | 0.00461 | 0.02726 | 0.073404 | 0.84946 |
| Anterior Bolton (digital) | 35 | 0.78756 | 0.00406 | 0.02399 | 0.74774 | 0.83999 |
| Bolton difference (anterior) | 35 | -0.00609 | 0.00551 | 0.03261 | -0.09256 | 0.06802 |
Descriptive statistics for the male group.
| Variable | N | Mean | Mean of the standard error | S.D. | Minimum | Maximum |
|---|---|---|---|---|---|---|
| Total Bolton (manual) | 35 | 0.91854 | 0.00462 | 0.02732 | 0.86408 | 0.96970 |
| Total Bolton (digital) | 35 | 0.91656 | 0.00359 | 0.02125 | 0.87507 | 0.96388 |
| Bolton Difference (total) | 35 | 0.00198 | 0.00518 | 0.03062 | -0.05892 | 0.06901 |
| Anterior Bolton (manual) | 35 | 0.77999 | 0.00543 | 0.03215 | 0.070370 | 0.84783 |
| Anterior Bolton (digital) | 35 | 0.78226 | 0.00433 | 0.02560 | 0.73535 | 0.84448 |
| Bolton difference (anterior) | 35 | -0.00228 | 0.00524 | 0.03100 | -0.08889 | 0.07397 |
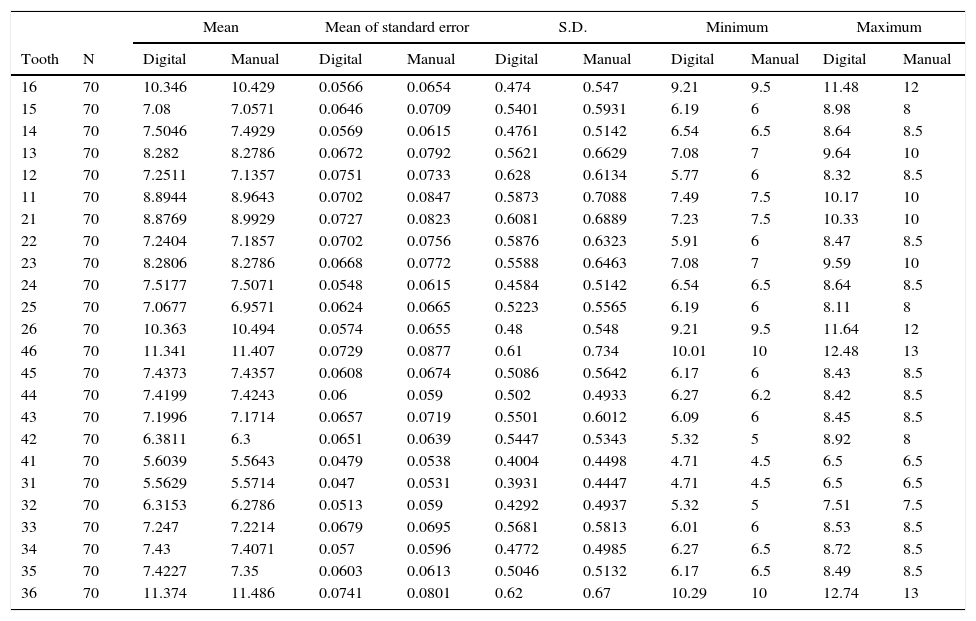
In Tables 4 and 5 an analysis by dental organ is shown. In table IV a comparison is made of the data obtained according to the type of measurement while Table V shows the comparison of the «P» values obtained in each of the teeth according to the gender (Tables IV and V).
Descriptive statistics per tooth.
| Mean | Mean of standard error | S.D. | Minimum | Maximum | |||||||
|---|---|---|---|---|---|---|---|---|---|---|---|
| Tooth | N | Digital | Manual | Digital | Manual | Digital | Manual | Digital | Manual | Digital | Manual |
| 16 | 70 | 10.346 | 10.429 | 0.0566 | 0.0654 | 0.474 | 0.547 | 9.21 | 9.5 | 11.48 | 12 |
| 15 | 70 | 7.08 | 7.0571 | 0.0646 | 0.0709 | 0.5401 | 0.5931 | 6.19 | 6 | 8.98 | 8 |
| 14 | 70 | 7.5046 | 7.4929 | 0.0569 | 0.0615 | 0.4761 | 0.5142 | 6.54 | 6.5 | 8.64 | 8.5 |
| 13 | 70 | 8.282 | 8.2786 | 0.0672 | 0.0792 | 0.5621 | 0.6629 | 7.08 | 7 | 9.64 | 10 |
| 12 | 70 | 7.2511 | 7.1357 | 0.0751 | 0.0733 | 0.628 | 0.6134 | 5.77 | 6 | 8.32 | 8.5 |
| 11 | 70 | 8.8944 | 8.9643 | 0.0702 | 0.0847 | 0.5873 | 0.7088 | 7.49 | 7.5 | 10.17 | 10 |
| 21 | 70 | 8.8769 | 8.9929 | 0.0727 | 0.0823 | 0.6081 | 0.6889 | 7.23 | 7.5 | 10.33 | 10 |
| 22 | 70 | 7.2404 | 7.1857 | 0.0702 | 0.0756 | 0.5876 | 0.6323 | 5.91 | 6 | 8.47 | 8.5 |
| 23 | 70 | 8.2806 | 8.2786 | 0.0668 | 0.0772 | 0.5588 | 0.6463 | 7.08 | 7 | 9.59 | 10 |
| 24 | 70 | 7.5177 | 7.5071 | 0.0548 | 0.0615 | 0.4584 | 0.5142 | 6.54 | 6.5 | 8.64 | 8.5 |
| 25 | 70 | 7.0677 | 6.9571 | 0.0624 | 0.0665 | 0.5223 | 0.5565 | 6.19 | 6 | 8.11 | 8 |
| 26 | 70 | 10.363 | 10.494 | 0.0574 | 0.0655 | 0.48 | 0.548 | 9.21 | 9.5 | 11.64 | 12 |
| 46 | 70 | 11.341 | 11.407 | 0.0729 | 0.0877 | 0.61 | 0.734 | 10.01 | 10 | 12.48 | 13 |
| 45 | 70 | 7.4373 | 7.4357 | 0.0608 | 0.0674 | 0.5086 | 0.5642 | 6.17 | 6 | 8.43 | 8.5 |
| 44 | 70 | 7.4199 | 7.4243 | 0.06 | 0.059 | 0.502 | 0.4933 | 6.27 | 6.2 | 8.42 | 8.5 |
| 43 | 70 | 7.1996 | 7.1714 | 0.0657 | 0.0719 | 0.5501 | 0.6012 | 6.09 | 6 | 8.45 | 8.5 |
| 42 | 70 | 6.3811 | 6.3 | 0.0651 | 0.0639 | 0.5447 | 0.5343 | 5.32 | 5 | 8.92 | 8 |
| 41 | 70 | 5.6039 | 5.5643 | 0.0479 | 0.0538 | 0.4004 | 0.4498 | 4.71 | 4.5 | 6.5 | 6.5 |
| 31 | 70 | 5.5629 | 5.5714 | 0.047 | 0.0531 | 0.3931 | 0.4447 | 4.71 | 4.5 | 6.5 | 6.5 |
| 32 | 70 | 6.3153 | 6.2786 | 0.0513 | 0.059 | 0.4292 | 0.4937 | 5.32 | 5 | 7.51 | 7.5 |
| 33 | 70 | 7.247 | 7.2214 | 0.0679 | 0.0695 | 0.5681 | 0.5813 | 6.01 | 6 | 8.53 | 8.5 |
| 34 | 70 | 7.43 | 7.4071 | 0.057 | 0.0596 | 0.4772 | 0.4985 | 6.27 | 6.5 | 8.72 | 8.5 |
| 35 | 70 | 7.4227 | 7.35 | 0.0603 | 0.0613 | 0.5046 | 0.5132 | 6.17 | 6.5 | 8.49 | 8.5 |
| 36 | 70 | 11.374 | 11.486 | 0.0741 | 0.0801 | 0.62 | 0.67 | 10.29 | 10 | 12.74 | 13 |
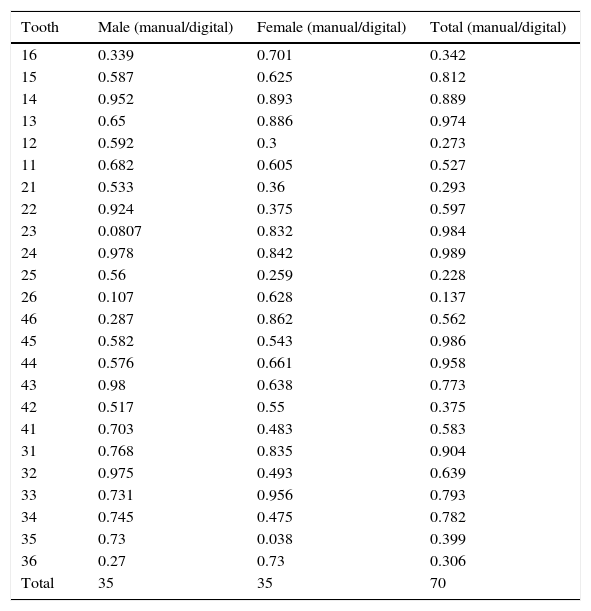
«p» value in males, females and in the total sample.
| Tooth | Male (manual/digital) | Female (manual/digital) | Total (manual/digital) |
|---|---|---|---|
| 16 | 0.339 | 0.701 | 0.342 |
| 15 | 0.587 | 0.625 | 0.812 |
| 14 | 0.952 | 0.893 | 0.889 |
| 13 | 0.65 | 0.886 | 0.974 |
| 12 | 0.592 | 0.3 | 0.273 |
| 11 | 0.682 | 0.605 | 0.527 |
| 21 | 0.533 | 0.36 | 0.293 |
| 22 | 0.924 | 0.375 | 0.597 |
| 23 | 0.0807 | 0.832 | 0.984 |
| 24 | 0.978 | 0.842 | 0.989 |
| 25 | 0.56 | 0.259 | 0.228 |
| 26 | 0.107 | 0.628 | 0.137 |
| 46 | 0.287 | 0.862 | 0.562 |
| 45 | 0.582 | 0.543 | 0.986 |
| 44 | 0.576 | 0.661 | 0.958 |
| 43 | 0.98 | 0.638 | 0.773 |
| 42 | 0.517 | 0.55 | 0.375 |
| 41 | 0.703 | 0.483 | 0.583 |
| 31 | 0.768 | 0.835 | 0.904 |
| 32 | 0.975 | 0.493 | 0.639 |
| 33 | 0.731 | 0.956 | 0.793 |
| 34 | 0.745 | 0.475 | 0.782 |
| 35 | 0.73 | 0.038 | 0.399 |
| 36 | 0.27 | 0.73 | 0.306 |
| Total | 35 | 35 | 70 |
In the literature regarding mesiodistal dental width, it has been found that currently the measurement is done mainly through the use of a digital vernier,1,3,-5,7,8,11-15 and even there is research in which the measurements are taken using three-dimensional images scanned from a physical model.16–19 Comparisons have been made between these forms of measurement but there are no comparative studies using manual measurement with a compass, a method used by Dr. Bolton in his study1 and in the Orthodontics Post-graduate Program at the Autonomous University of San Luis Potosi.
The difference in the mesiodistal dimension found in the study of K. Bootvong between the measurement obtained with a digital caliper and the one obtained through a computerized virtual model was not statistically different from zero. By obtaining a similar result in our study which compared manual measurement with a compass against the measurement obtained with a digital caliper, the possibility of obtaining measurements through three different methods without a significant difference is shown. We suggest that in the future a comparative study between these three methods of measurement should be performed.17
HariPrasad in his study indicated that the sharp ends of a digital caliper might help in obtaining measurements with greater accuracy,12 while in our research we considered that the compass allowed us to fit the tips more easily, especially in cases where there was overcrowding or rotations which made the measurements difficult. The largest flaw that we observed in this method was when transporting the measurement obtained with the compass to the millimeter rule, since it was not feasible to obtain exact figures as it is done with a digital caliper.
Goose suggested that the mesiodistal diameter should be located between the contact points of the dental crown with the neighboring teeth in cases of normal occlusion. While in cases of malocclusion, the crown position in which the contact points would have been in normal occlusion are used. In the event of a rotated tooth we have to obtain the mesiodistal measurement diagonally. If the teeth are lingually inclined we have to use the lingual mesiodistal measurement.12 In this study we took into consideration the abovementioned suggestions at the time of performing the measurements in order to avoid errors which could affect our results.
The results obtained in the individual tooth measurement vary in relation to the values obtained by other authors.1–3,5,9,12–14,16 These values differ mainly due to the different populations in which each study takes place. Our research shows values obtained from a Mexican population.
In our study there was no statistically significant difference between the mesiodistal width measurement of teeth of women or men, obtaining in both cases > 0.05 «P» values. The same result was obtained by Trehan et al who compared the results obtained in their investigation according to gender.1
CONCLUSIONSAlthough the use of a digital caliper may be more accurate than the measurement obtained with a compass and a rule by showing the obtained measurements with more decimals, it was demonstrated by this study that the statistical difference is not significant. We therefore consider that a digital caliper is optional equipment for performing this type of measurements since the orthodontist is trained to do so without it and the same results are obtained.
It is recommended to perform more research on this topic comparing larger samples and adding different measurement methods such as measurements in virtual models. A larger sample will provide further knowledge in regard to difference by sex, race and even more variables may be added such as variations by malocclusions type among others.
This research was supported by the Orthodontics and Dentomaxillofacial Orthopedics Specialty of the Autonomous University of San Luis Potosí, Mexico.
Student of the Orthodontics and Dentomaxillofacial Orthopedics Post-graduate Program.
This article can be read in its full version in the following page: http://www.medigraphic.com/ortodoncia