


Facial morphology experiences gradual change by region. Its components and variations are an area of interest in pediatrics, odontology and forensic anthropology among others.
ObjectiveTo identify the growth pattern by age and gender from 10 to 20 years of age.
Material and methodsThe study included 450 lateral cephalograms (215 males and 235 females) collected at the Latin American University between 2000 and 2010.
ResultsThe report describes skeletal and soft tissue indicators for growth by age and gender in individuals with ages between 10 and 20 years for each one of the facial thirds.
ConclusionFacial spiral model demonstrates differential patterns for each facial third with a constant separation beginning at age 13.
La morfología facial se modifica de manera gradual con un crecimiento diferencial entre regiones del complejo craneofacial sus componentes y variación son de interés para la pediatría, odontología y antropología forense.
ObjetivoIdentificar el patrón de crecimiento por edad y sexo entre los 10 y 20 años.
Material y métodosSe analizaron 450 cefalogramas laterales (215 masculinos y 235 femeninos) recabadas en pacientes en edades de 10 a 20 años, del Servicio Odontológico de la Universidad Latinoamericana en el periodo de 2000 a 2010.
ResultadosEn el presente reporte se describen los indicadores esqueléticos y de tejidos blandos, en relación con la edad y el sexo en individuos de 10 a 20 años para cada uno los tercios faciales.
ConclusiónEl modelo de espirales faciales mostró patrones diferenciales por tercio facial con una separación constante de los 13 años en adelante.
The measurement of the dimensions and planes of the craniofacial region has been used for decades in anthropological studies with the aim of analyzing the skeletal remains and make inferences about the biological group to which they belong. In living populations, the interest for facial morphology goes beyond the mere definition of the biological group, as evidenced by the research carried out by anthropologists as well as doctors, dentists, pediatricians and surgeons because it is based on the estimate of its various components of both bony and soft tissue - (muscle, fat and skin), which sets the uniqueness of an individual.1,2 Facial morphology, as is well known, experiences a gradually change due to growth of the various regions which comprise the craniofacial complex. This implies that the study of these components and the variations in their expression are of keen interest to disciplines such as Pediatrics, Odontology, Forensic Anthropology, among others. In the present research the primary interest focused precisely on identifying the differences in the growth pattern by age in a number of selected dimensions in the facial region.
The knowledge of the processes of facial growth and maturation at different stages of life contributes to a greater accuracy in the processes of identification and facial reconstruction both in forensic as well as in dentistry and pediatric dentistry cases.
The research project, from which the results presented in this report were obtained, contributes to the development of such bony and soft tissue references using an easy-access diagnostic tool such as the lateral headfilm.3 The selection of a radiographic series, suitable for the characteristics of contemporary populations, was used to apply a full statistical analysis and multivariate analysis that would lead to discriminate the growth patterns at different ages and in a specific manner for each region of the craniofacial complex.
The present paper describes the skeletal and soft tissues indicators in relation to age and sex in individuals of 10 to 20 years for each of the facial thirds. This was performed with the aim of identifying the growth pattern in a stage in which most of the changes that define adult morphology may occur. The emphasis lies in the need for data generated in Mexican population that would help determine the dimensions of the main components of the face specific to the age.
MATERIAL AND METHODSThe study was retrospective. The series were gathered from a selection of 450 lateral headfilms (215 male and 235 female) from patients with ages between 10 and 20 years who attended the dental service of the Latin American University from 2000 to 2010. The selection criterion was that the headfilms had sufficient definition to facilitate the location of the points that would describe the growth pattern. For that reason, we only included the radiographs in which the points and eight planes were located clearly, adding 12 soft tissue points that are used to analyze the growth pattern. A total of 12 metric points were defined: [1. Sella (S), 2. Nasion (Na), 3. Orbitale (Or), 4. Articulare (Ar), 5. Subnasale (Point A), 6. Anterior Nasal Spine (ANS), 7. Supramental (Point B), 8. Upper incisor, 9. Lower incisor, 10. Pogonion (Pg), 11. Gonion (Go), 12. Gnation (GN)]. The dimensions were estimated in lateral norm, so they were used to describe the depth and thickness of the soft tissues that superimpose over the basal bone, with resulted in the information that defined the individual morphological pro le.
An analysis by age intervals was chosen with three groups: 10 to 12 years (n = 125); 13 to 16 years (n = 165); 17 to 20 years (n = 160). The age groups according to this classification presented a balanced structure that helped determine a correct comparison of the same.
The first step was to obtain the descriptive statistics of all the dimensions that were considered essential for describing the different segments of the facial region. The statistics included the central values: mean and median and the dispersion values calculating variance, standard deviation and the corresponding estimation errors. The high-order moments were added to these values in order to detect biased patterns.
Descriptive values for each one of the variables determined the central and deviation marks in the study series.
RESULTSThe analysis was divided into three regions that corresponded to the differential craniofacial growth pattern: upper facial third (identified by the planes Sella-Nasion, Sella-Orbitale, Sella-Anterior Nasal Spine); middle third (Articulare-Point A, Articulare-Upper1labial, Articulare-Point B); lower third (Gonion-Point B, Gonion-Pogonion). Once the essential dimensions to describe the different segments of the facial region were selected, the analysis for age groups was performed. This assumption considered that in the growth process of the facial skull specific regional patterns are recognized according to the developmental stage. The ability to identify the components that are acting in each region as significant of a pattern of development in young individuals helps discriminate variations by age and the consequent morphological axis. An algorithm based on two principles was applied: first, the need to explain the entire set of interactions of the variables through multiple associations and second, in parallel, the search of the underlying geometry of the harmonic dimensions. The analysis was careful to maintain adequate numeric properties of the individuals in the different growth stages. The distribution of polar coordinates represented in the so-called facial spirals was explored for displaying the manner in which the studied dimensions were grouped in relation to age.
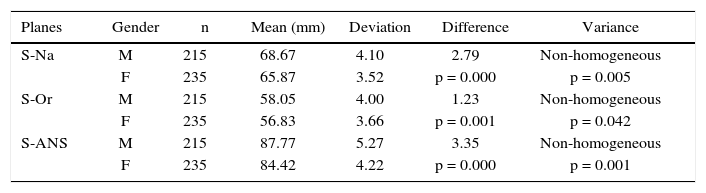
The statistical analysis for the upper third is presented in table I. The means for the three planes were higher in men than in women; the differences were statistically significant. The first analysis corresponding to the facial spiral of the upper third relates the values of the found three vectors using polar coordinates. As a first step the triangle that defined the difference between the vectors to points Na and ENA was formed and afterwards, the point Or was taken as reference axis. This algorithm was applied to each one of the individuals, and if the data of the new coordinates is graphed, with respect to the angle that the vectors Na and ENA and its corresponding Or length formed, the facial spiral for the upper third is obtained. Figure 1 presents the construction of the two spirals that reflect the behavior of the sample for the individuals with ages between 10 and 12 years and for the individuals aged 13 to 16 as well as for the ones aged 17-20 years, all integrated in a single class (13-20 years). It is interesting to note that the results show a significant change in the values corresponding to the groups of ten to twelve years in relation to those of ages 13 to 20 years. After the age of 12 the range of the means was consolidated and the spiral acquired values clearly more elongated (over 90 degrees of rotation). This pattern is the same for both genders. At this point we could already affirm the existence of a facial geometry underlying the radiographic series.
Planes in the upper facial third.
| Planes | Gender | n | Mean (mm) | Deviation | Difference | Variance |
|---|---|---|---|---|---|---|
| S-Na | M | 215 | 68.67 | 4.10 | 2.79 | Non-homogeneous |
| F | 235 | 65.87 | 3.52 | p = 0.000 | p = 0.005 | |
| S-Or | M | 215 | 58.05 | 4.00 | 1.23 | Non-homogeneous |
| F | 235 | 56.83 | 3.66 | p = 0.001 | p = 0.042 | |
| S-ANS | M | 215 | 87.77 | 5.27 | 3.35 | Non-homogeneous |
| F | 235 | 84.42 | 4.22 | p = 0.000 | p = 0.001 |
Source: Own preparation from database Consejo (2011).

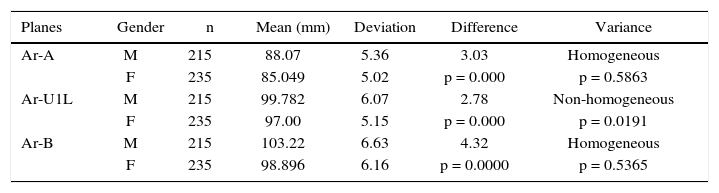
The statistical analysis for the middle third is presented in table II. Differences were found between genders, with higher values in the three planes for men compared to women and proving to be statistically significant. However this is not the case with the variance, which only differs in a significant way for the second plane (Ar-UL1). Figure 2 presents the facial spiral corresponding to the middle third for which the three values of the vectors found for the whole sample are related using polar coordinates. The triangle that defines the difference between the vectors to points A and B was defined and afterwards the point Upper-Labial was taken as reference axis. This algorithm was applied to each one of the individuals. By plotting the data of the new coordinates, in relation to the angle that was formed by vectors A and B and the corresponding Upper-Labial Length the facial spiral for the middle third in the radiographic series was obtained. On the basis of the relationship of the three sectors two spirals were built: one for the individuals ages 10 to 12 years, and another for the individuals aged 13 to 16 and 17-20 years, which were integrated into a single class that included 13 to 20 years. In this case a significant change in the values corresponding to the age groups of 10 to 12 years and 13 to 20 years was noted. After the age of 12 the range of the means is consolidated and the spiral acquires values more clearly defined on the basis of the 45 degrees of rotation. This pattern is repeated both in men and women.
Planes in the middle facial third.
| Planes | Gender | n | Mean (mm) | Deviation | Difference | Variance |
|---|---|---|---|---|---|---|
| Ar-A | M | 215 | 88.07 | 5.36 | 3.03 | Homogeneous |
| F | 235 | 85.049 | 5.02 | p = 0.000 | p = 0.5863 | |
| Ar-U1L | M | 215 | 99.782 | 6.07 | 2.78 | Non-homogeneous |
| F | 235 | 97.00 | 5.15 | p = 0.000 | p = 0.0191 | |
| Ar-B | M | 215 | 103.22 | 6.63 | 4.32 | Homogeneous |
| F | 235 | 98.896 | 6.16 | p = 0.0000 | p = 0.5365 |
Source: Own preparation from database Consejo (2011).

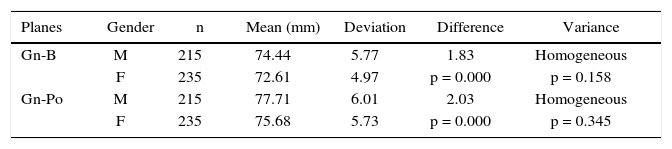
The differences between genders are consistent in the two planes of the lower third, since the average dimensions and variances are higher in men than in women and they are statistically significant. In the search of the facial spiral corresponding to the lower third, two of the found vector values for the study series were related using polar coordinates. As a first step, the triangle that defines the difference between the vectors to points B and Pogonion was formed, taking the median axis between both as a reference since there was no third plane. This algorithm was applied to each one of the individuals (Table III). By plotting the data of the new coordinates, in relation to the angle formed by vectors B and Pogonion with its corresponding mean vector length, the facial spiral that characterizes the lower third of the radiographic series was obtained (Figure 3). It should be noted that there is a significant change in values between the groups of 10 to 12 years and the one of 13 to 20 years. After the age of 12 the spiral wins almost a quadrant in appearance. Men and women share this pattern as expected from the results obtained in the upper and middle thirds.

The dimensions of the bony tissue as well as those of the soft tissue increased gradually between 10 and 15 years, while for the following ages, a greater variability was found, which gives an account of the maximum individual growth and the diversity of the studied group. The measurements performed in each third allowed us to obtain average values for the thickness of the soft tissue. In the upper third, a component of facial depth may be recognized and it may be noted that there is a recognizable pattern of progressive increases in the dimensions between 10 and 15 years, in the male series; while for the 15 to 20 years group, there is greater variability in the mean dimensions that might be related to differences in the final phase of growth.
The analysis of the middle third emphasizes nasal projection. For this region, the high medium and low portions starting from point Or were described. The results reveal an increase in the group between 10 and 15 years of age, both in the series of women as men. This increase may be associated to age since for the group aged between 16 and 20 years there were virtually no differences in the pattern of increments, thus it is assumed that the observed differences between age groups, although small in magnitude, seem to occur on a regular basis and are therefore useful indicators to describe the shape of the nose.
The estimate of the projection of the tip of the nose, from ANS, is consistent with the pattern of development that was previously described for the nose from Or, as was also the case of the difference by gender, with greater male dimensions when compared to women. The smaller variation observed in 16-year-old women could suggest the end of their growth. In contrast, for the male group there was more variation without regular changes in growth, which may suggest, on one hand, an extension of the growth period and on the other, differences between generations in relation to different growth trends. At the next level, the dimensions corresponding to the projection of the shape of the lips are located. This measurement was performed from ANS-subnasale to the labial portion of the most protruded maxillary incisor. This dimension observed progressive increments at ages 10 to 15 years, whereas after 16 years, more variability in this region was recorded. The differences by gender were maintained, i.e. the values were higher in males than in females.
In all dimensions analyzed for the lower third, it was found that the highest growth was experienced at 15 years and onwards, both for the male series as for the women's. Growing dimorphism is also added, which is expressed in higher dimensions in the male series regarding the female thus resulting in a greater inter and intra group variability for this craniofacial region.
In summary, the dimensions of bone tissue as well as those of soft tissue, increase gradually between 10 and 15 years, while for the following ages, greater variability was found, which gives an account of the maximum individual growth in the studied group.
Relations between proportions (bony and soft tissue) in the present study show a steady increase between 10 and 13 years of age, both in the male series as well as in the female, which is consistent with what was reported by De Greef et al4 who analyzed the influence that gender and body mass index have when the thickness of soft tissues is estimated, which is also supported by Nanda et al,5 in their definition of the facial profile in soft tissues.
Several authors have described sexual dimorphism regarding soft tissue thickness. These differences are expressed in a lower variability of soft tissue thickness among women, which has been explained in relation to a shorter growth period compared with men.5,6 Ferrairo and Sforza7 found that changes in the shape and size of the soft tissues in relation to age, sex and skeletal class occur. On average the soft tissue area that goes from Nasion to Pogonion, as much as the corresponding dimension for both skeletal classes, increased with age in both sexes. On the other hand it was observed that distances were larger in the male individuals in the female, at the same ages and with similar skeletal classes. These authors emphasize that the structures corresponding to the soft and bony tissues are not correlated in a linear fashion during growth when there are different facial types. It is necessary to have more stable reference points such as the bone planes that were chosen for this study.
Cephalograms as an auxiliary of orthodontic diagnosis, although it may be less sophisticated than other techniques available today, has the advantage of being easy to access and being highly comparable, since it has been used in many facial development studies such as the one by Genecov,8 who emphasized the relation of the bone planes with the shape of the nose.
The description of the morphologic characteristics in soft tissues should consider that facial growth is very intense, from birth until puberty, when further increases occur until growth is finished, an event that happens earlier in women than in men.9 As Bjork and Skieller10 pointed out, the maxillae experience maximum growth in a downward and forward direction in relation to the cranial base. A few months after the maximum pubertal growth, these changes coincide with the maximum projection of the upper lip between 10 and 13 years of age both in men and in women.
CONCLUSIONSThe main features of the growth pattern for the three regions may be summarized as follows: In the upper third, while the spiral denotes a modification of the relationships between the compared dimensions, the larger male size is significant. In the middle third, the distribution is more closed and with less dispersion, which denotes less variation. In the lower third, growth in the maxillary region associated with the progress in the permanent dentition influences vertical growth and anterior displacement thus explaining the growth pattern changes after the age of 12.
Head of the Orthodontics Program at the Universidad Latinoamericana.
This article can be read in its full version in the following page: http://www.medigraphic.com/ortodoncia