


Pharmacodynamic concepts should be applied to optimize antibiotic dosing regimens, particularly in the face of some multidrug resistant bacterial infections. Although the pharmacodynamics of most antibiotic classes used in the hospital setting are well described, guidance on how to select regimens and implement them into an antimicrobial stewardship program in one's institution are more limited. The role of the antibiotic MIC is paramount in understanding which regimens might benefit from implementation as a protocol or use in individual patients. This review article outlines the pharmacodynamics of aminoglycosides, beta-lactams, fluoroquinolones, tigecycline, vancomycin, and polymyxins with the goal of providing a basis for strategy to select an optimized antibiotic regimen in your hospital setting.
Antibiotic resistant infections are a worldwide public health problem. As a result of emerging resistance in both Gram-positive and Gram-negative bacteria, pathogens that remain susceptible to most currently available antibiotics are diminishing and few antibiotics are in development to address these multidrug resistant (MDR) bacteria1. Among Gram-positive bacteria, Staphylococcus aureus that are resistant to beta-lactams [i.e., methicillin-resistant S. aureus (MRSA)] can be found in as many as 50-60% of isolates2. We are at the point clinically, whereby if S. aureus is a suspected cause of the infection, empiric therapy with an anti-MRSA antibiotic has become essential. On the Gram-negative side, Pseudomonas aeruginosa continues to be a problematic pathogen due to its high prevalence in the hospital setting; however, the emergence of carbapenem resistant enterobacteriaceae (CRE) and carbapenem resistant Acinetobacter baumannii (CRAB) has rightly stolen headlines and are considered Urgent and Serious threats, respectively, by the Centers for Diseases Control2,3. The lack of new antibiotics is particularly problematic in countries outside of the United States and European Union. Many of these countries have regulatory requirements that significantly delay the approval of new drugs, or in extreme cases, never make them available. As a result, the countries that often have the direst levels of MDR organisms seldom have the newest, most potent antibiotics in their armamentarium.
In addition to encouraging the continued development of new antibiotics, efforts must be made within the hospital setting to limit the emergence and spread of MDR bacteria. Antimicrobial Stewardship Programs (ASPs) have become widely popular in the United States and Europe to address this unmet need4. Such programs aim to manage antimicrobial use in the acute care setting through coordinated interventions designed to improve and measure appropriate use. ASPs, therefore, promote the selection of optimal antibiotic drug regimens including dosing, duration of therapy, and route of administration across the medical center. One component of ASPs is the consideration and implementation of antibiotic regimens based on pharmacodynamic concepts. Although the use of pharmacodynamics to design antibiotic dosing regimens, such as the continuous infusion of beta-lactams, has been widely reported in the literature, the strategic design and implementation of such programs as part of an ASP has been more elusive.
Herein, a brief review of antimicrobial pharmacodynamics is provided, followed by discussion of considerations and strategy regarding where implementation of these dosing strategies might provide the greatest benefits.
PHARMACODYNAMICS: WHAT'S THE RIGHT DOSE?Inappropriate antibiotic therapy is most often a result of delayed administration (i.e., waiting for culture or susceptibility results before initiating antibiotics or starting therapy as a result of a positive culture) or, more often, an underestimation of current trends in resistance. Regardless, the classification of an organism as “Susceptible”, “Intermediate”, or “Resistant” does not inform the prescriber of the ideal dose to use for the infection. Instead, the term “optimal antibiotic therapy” should be used and is meant to indicate that not only is the correct antibiotic selected, but also that the dosage is sufficient to obtain the maximal exposure threshold determined from pharmacodynamic studies. An interesting observation relevant to optimal antibiotic therapy is that the pathogen need not be “Susceptible” to the drug in question, as long as the exposure of the agent is sufficient to kill that organism.
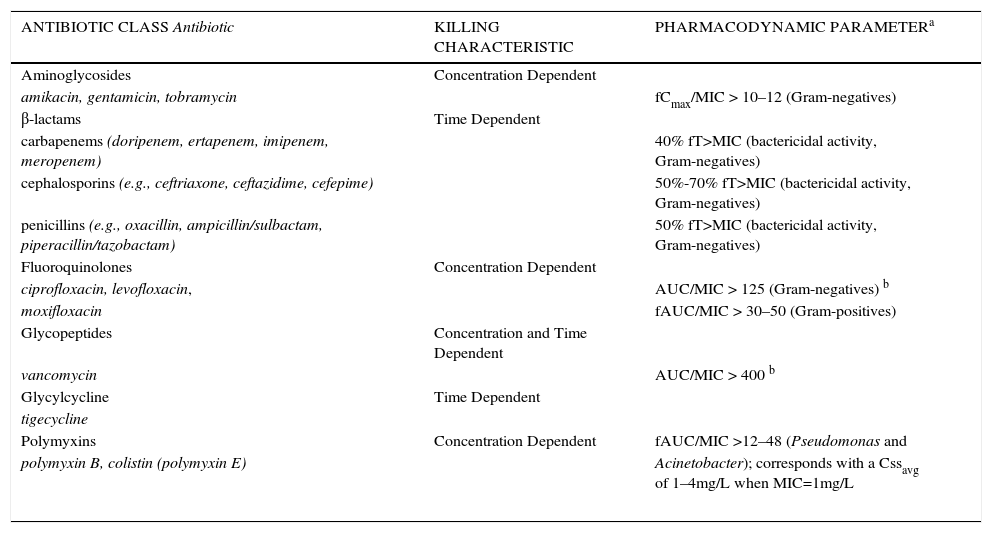
Antimicrobial killing characteristics are dependent on both the concentration of drug in relation to the minimum inhibitory concentration (MIC) and the time that this exposure is maintained (Figure 1)5. When the effect of concentration predominates over that of time, the antibiotic displays concentration-dependent effects that are significantly associated with an optimal free drug maximum concentration to MIC ratio (fCmax/MIC). When the effect of time is greater, the antibiotic displays time-dependent effects, and bacterial outcomes are associated with free drug concentrations remaining above the MIC for a defined portion of the dosing interval (fT>MIC). Additionally, antibiotics that have both concentration- and time-dependent effects may observe killing that is associated with the free drug area under the curve to MIC ratio (ƒAUC/MIC). A summary of currently available antibiotic classes used in the acute care setting and their respective pharmacodynamic characteristics is provided in Table 1. At standard clinically relevant doses, concentration-dependent antimicrobials include the aminoglycosides, fluoroquinolones, and colistin. Time-dependent antimicrobials include the β-lactams, glycylcyclines, and vancomycin.

SUMMARY OF ANTIBIOTICS THAT DISPLAY CONCENTRATION-DEPENDENT OR TIME-DEPENDENT KILLING CHARACTERISTIC AND THE REQUISITE PHARMACODYNAMIC EXPOSURE
| ANTIBIOTIC CLASS Antibiotic | KILLING CHARACTERISTIC | PHARMACODYNAMIC PARAMETERa |
|---|---|---|
| Aminoglycosides | Concentration Dependent | |
| amikacin, gentamicin, tobramycin | fCmax/MIC > 10–12 (Gram-negatives) | |
| β-lactams | Time Dependent | |
| carbapenems (doripenem, ertapenem, imipenem, meropenem) | 40% fT>MIC (bactericidal activity, Gram-negatives) | |
| cephalosporins (e.g., ceftriaxone, ceftazidime, cefepime) | 50%-70% fT>MIC (bactericidal activity, Gram-negatives) | |
| penicillins (e.g., oxacillin, ampicillin/sulbactam, piperacillin/tazobactam) | 50% fT>MIC (bactericidal activity, Gram-negatives) | |
| Fluoroquinolones | Concentration Dependent | |
| ciprofloxacin, levofloxacin, | AUC/MIC > 125 (Gram-negatives) b | |
| moxifloxacin | fAUC/MIC > 30–50 (Gram-positives) | |
| Glycopeptides | Concentration and Time Dependent | |
| vancomycin | AUC/MIC > 400 b | |
| Glycylcycline | Time Dependent | |
| tigecycline | ||
| Polymyxins | Concentration Dependent | fAUC/MIC >12–48 (Pseudomonas and |
| polymyxin B, colistin (polymyxin E) | Acinetobacter); corresponds with a Cssavg of 1–4mg/L when MIC=1mg/L | |
The goal when dosing concentration-dependent antimicrobials is to achieve a total drug Cmax/MIC of approximately 10 to 12 or a total AUC/MIC of 150, both of which have been predictive of clinical success6,7. Total drug exposure targets are reasonable here because the 3 currently available aminoglycosides (gentamicin, tobramycin, and amikacin) have low protein binding. As a result of pharmacodynamic studies, the traditional dosing regimen of 1 to 1.5mg/kg (gentamicin and tobramycin) or 7.5mg/kg (amikacin) divided into two to three daily doses has been largely replaced with high-dose, extended-interval regimens to achieve higher peak concentrations, resulting in improved clinical efficacy and, importantly, fewer nephrotoxic events. Nicolau and colleagues evaluated a once daily aminoglycoside dosing algorithm (7mg/kg daily, referred to as the Hartford Nomogram) in over 2000 adult patients and found a similar clinical response, but a reduced incidence of nephrotoxicity compared with historical data (1.2% vs. 3-5%)8. In a simulation study, the probability of day 7 temperature resolution and nephrotoxicity between a once daily aminoglycoside regimen (10mg/kg every 24h) compared with a twice daily (5mg/kg every 12h) dose was determined9. At an MIC of 4mg/L (the current susceptibility breakpoint for gram-negative bacteria), the twice daily dose had a 53.6% probability of temperature resolution compared with 79.7% for the once daily regimen. Additionally, nephrotoxicity of the twice daily dose was predicted to be significantly greater (24.6%) than the once daily regimen (<1%). The specific dose needed to obtain efficacy would therefore be dependent on the MIC of gram-negative bacteria in one's clinical population and the patient's renal function. If MICs are below 1mg/L, doses of 3-5mg/kg once daily would be sufficient to obtain adequate exposure thresholds. The Hartford Nomogram dose of 7mg/kg was designed to achieve optimal Cmax/MIC ratios for gentamicin and tobramycin at the MIC of 2mg/L, which was the MIC90 for P. aeruginosa at the institution at that time. In contrast, MICs of 4mg/L would require dosages of 10-14mg/kg daily to achieve the requisite pharmacodynamic targets. For patients with normal kidney function, these doses could be administered daily; however, for patients with moderate to severe renal failure, re-dosing should be delayed until concentrations fall below 1mg/L. Despite no change to the FDA labels, optimized, high-dose, extended-interval aminoglycoside dosing is now the most common dosing regimen employed for this antibiotic class10.
BETA-LACTAMSBeta-lactam antibiotics display time-dependent bactericidal activity, and in general, require fT>MIC for ∼50% of the dosing interval to achieve maximal effects; however, exposure can vary by the specific beta-lactam class. For instance, while the penicillin-based beta-lactams are reported to require 50% fT>MIC, human and animal studies with cephalosporins suggest a requirement between 50% and 70% fT>MIC11-13. The carbapenems (i.e., doripenem, ertapenem, imipenem, meropenem) are generally thought to achieve maximum bactericidal activity at ∼40% fT>MIC14. As a result, maximizing the time that concentrations remain above the MIC is the administration strategy. Various methods have been employed to maximize T>MIC, including giving higher dosages, administering the drugs more often, and prolonging the infusion time (either to 3-4hours depending on room temperature stability or continuously over 24hours). In general, the most effective way to optimize exposure, particularly against MDR gram-negative bacteria, to both increase the administered dose and prolong the infusion, thereby maintaining a concentration above higher MICs for the required bactericidal exposure time. This has been applied to beta-lactams such as cefepime, doripenem, and meropenem in numerous studies. In patients with normal renal function, 2 grams every 8hours (each dose administered as a 3 or 4 hour prolonged infusions) dosing regimens achieve a high probability of treating organisms considered resistant with MICs of 8-16μg/ml and 16-32μg/ml for doripenem/meropenem and cefepime, respectively, which is significantly greater than if the same dosage regimen were infused over the standard 30minutes15. Piperacillin/tazobactam dosing regimens can also be optimized by employing continuous or prolonged infusion administration. Kim and colleagues found that a 4.5g every 6 hour dose (with each dose infused over 3hours) would achieve a similar pharmacodynamic exposure to the same daily dose (18.0g) administered as a continuous infusion, and both would have higher probabilities of target attainment than the standard 4.5g every 6 hour (30minute infusion) dose16. Superior clinical outcomes were observed by Lodise and colleagues after implementing a piperacillin/tazobactam dosing regimen at their medical center where all piperacillin/tazobactam orders for 3.375g every 6hours (30minute infusion) were changed to 3.375g every 8hours (4 hour prolonged infusions)17. In patients with P. aeruginosa infections, the prolonged infusion had a lower 14-day mortality rate (12.2% vs. 31.6%, p=0.04) and shorter hospital stay (21 days vs. 38 days, p=0.02) that reached statistical significance when limited to critically-ill patients with an APACHE II score of ≥17. A number of clinical trials, mostly observational in design, have been conducted with continuous or prolonged infusion beta-lactams. A more thorough review of these studies is outside the scope of this paper, but can be found here15,18. However, the most rigorous designed clinical studies comparing continuous infusion directly to the same beta-lactam administered as a standard 30minute infusion include the BLING (Beta-Lactam INfusion Group) I and II studies, which were both multicenter, prospective, double-blind, randomized controlled trials19,20. BLING I19 enrolled 60 patients with severe sepsis who were randomized to continuous infusions of piperacillin/tazobactam, meropenem or ticarcillin/clavulanate or the same drugs administered as an intermittent schedule. Clinical cure in the continuous infusion arm was 70% compared with only 43% (p=0.037) in the intermittent infusion treated patients. T>MIC was also significantly greater in the continuous arm. BLING II20 enrolled 432 patients from 25 intensive care units across Australia, Asia and Europe. The larger study, however, did not find a difference in the primary endpoint, which was alive intensive care unit free days at day 28, a different and more challenging endpoint from the earlier trial. BLING II had notable limitations including a high prevalence of susceptible bacteria. In summary, most studies with continuous and prolonged infusion beta-lactams have demonstrated their greatest value in treating patients who are more critically ill and infected with higher MIC pathogens (i.e., less susceptible).
FLUOROQUINOLONESWhile fluoroquinolones are considered concentration-dependent antibiotics, the maximum dose that can be safely administered is limited by dose-related central nervous system toxicity, thus a Cmax/MIC of 10 to 12 cannot be achieved against many pathogens, and the time that concentrations are maintained above the MIC must be considered to maximize response. Therefore, in many pharmacodynamic studies, the bactericidal effect has been correlated with AUC/MIC21. Against Gram-negative bacteria, a total AUC/MIC≥125 is most often quoted as being required for maximal effect, while Gram-positive bacteria, such as Streptococcus pneumoniae, require a free AUC/MIC≥3022,23. It is important to consider, however, which fluoroquinolone was used in each pharmacodynamic study since protein binding varies substantially across agents and therefore, the total AUC/MIC targets may be different. In a study of 74 patients receiving ciprofloxacin for serious nosocomial infections predominantly due to Gram-negative bacteria, a total AUC/MIC below 125 was associated with a lower probability of clinical and microbiologic response22. Additionally, an AUC/MIC above 125 and above 250 were significantly associated with shorter median times to eradication (AUC/MIC<125:32 days, 125-250:6.6 days, >250:1.9 days, p<0.005). Correcting for ciprofloxacin protein binding of 40%, the ƒAUC/MIC threshold would be ∼75. In another study, a levofloxacin total drug AUC/MIC exposure ≥87 was prospectively determined to be predictive of eradication in 47 patients with nosocomial pneumonia24. Correcting for levofloxacin protein binding, the ƒAUC/MIC target would be ∼65, a value quite similar to the exposure required for ciprofloxacin against Gram-negative bacteria. Although fluoroquinolones are widely prescribed antibiotics, from a pharmacodynamic perspective, they are unable to achieve optimal pharmacodynamic exposure at standard dosages for not only bacteria considered resistant, but also a number of bacteria that the microbiology laboratory would classify as susceptible. This is a result of a higher than acceptable breakpoint used to define susceptibility for Gram-negatives (≤1mg/L for ciprofloxacin and ≤2mg/L for levofloxacin). Pharmacodynamic simulation studies suggest the proper breakpoints should be 0.25mg/L and 0.5mg/L, respectively, which would significantly increase resistance rates further at most hospitals, particularly against P. aeruginosa25. As a result, even aggressive regimens such as ciprofloxacin 400mg every 8 hour and levofloxacin 750mg every 24 hour have achieved low probabilities of attaining the required pharmacodynamic exposure against Gram-negative bacteria. The empiric use of the antibiotics as monotherapy for Gram-negative infections should be discouraged unless MIC data suggests adequate exposure is feasible.
GLYCOPEPTIDES (VANCOMYCIN)Although vancomycin success for Gram-positive infections has historically been thought to be associated with trough values, and thus T>MIC, contemporary data suggests that the AUC/MIC ratio best predicts outcomes for this time-dependent antibiotic26. Studies in patients with pulmonary infections caused by S. aureus observed that vancomycin response was associated with a total drug AUC/MIC>345, and microbiological eradication was associated with an AUC/MIC>400. Alternative supportive data are provided by studies suggesting that clinical responses in S. aureus bacteremia were poor when the MIC was >1mg/L; at this MIC, the standard vancomycin dose (1g every 12hours) does not attain these AUC/MIC exposures in patients with normal renal function. A consensus statement from the Infectious Diseases Society of America (IDSA), Society of Infectious Diseases Pharmacists (SIDP), and American Society of Health-Systems Pharmacist (ASHP) recommended that a loading dose of vancomycin be administered, particularly in critically ill patients, followed by doses of 30mg/kg daily to achieve troughs of 15 to 20mg/L26. However, in clinical scenarios where the vancomycin MIC was 2mg/L without clinical response, strong consideration for switching to an alternative antibiotic was suggested. The challenge with optimizing vancomycin based on the AUC/MIC ratio is 2 fold. First, to estimate an accurate AUC, multiple concentrations throughout the dosing interval are required; a trough alone or peak alone strategy to estimate AUC underestimated exposure by 23% and 14%, respectively27. An approach that uses a single trough value, or multiple (at least 2 samples over the dosing interval) concentrations, combined with Bayesian estimation of the AUC was significantly better at predicting the true AUC (∼97% accurate). The second challenge lies with the MIC test itself. The error in accurate determination of the MIC is permitted to be 100% in either direction, meaning that an MIC of 1mg/L is the same as 0.5 and 2mg/L, thereby providing a 4 fold range in potential exposures. A patient who achieves a 24 hour AUC of 400mg*h/L infected with a bacteria reported as an MIC of 1mg/L may actually have an AUC/MIC exposure between 200 and 800 based on variability of the MIC alone. As a result, the IDSA MRSA guidelines emphasize assessment of the patient response to therapy28. Despite these well documented challenges, vancomycin remains the gold standard for the treatment of MRSA infections.
GLYCYLCYCLINES (TIGECYCLINE)Tigecycline, the first member of the glycylcycline antibiotic class, portrays time-dependent activity, and the pharmacodynamic target most closely associated with efficacy is the ƒAUC/MIC. In a murine pneumonia model, ƒAUC/MIC ratios of 2.17 and 8.78 were required to produce 1 and 2 log kill, respectively, against Acinetobacter spp29. Using the data from the Phase 3 clinical trial in treatment of hospital acquired pneumonia, a ƒAUC/MIC≥0.9 was associated with an 8 fold higher probability of clinical success30. After a loading dose of 100mg followed by 50mg every 12hours, the steady state tigecycline AUC0-24 is ∼4.7mg*h/L. Considering tigecycline protein binding is 80%, the fAUC0-24 would be ∼0.94mg*h/L, which is similar to the median fAUC0-24 observed during the hospital acquired pneumonia study, 1.08mg*h/L (range: 0.35-4.02). As a result, standard doses of tigecycline achieve optimal exposure using the clinical pharmacodynamic threshold when the MIC is ∼1mg/L, or ∼0.5mg/L if the 1-log CFU reduction target is applied. The FDA susceptibility breakpoint is ≤2mg/L, whereas the EUCAST breakpoint is ≤1mg/L. Unfortunately, limited clinical data are available to validate these observations, and variable outcomes with standard dosing tigecycline have been reported. A recent clinical trial of 55 patients with extensively drug-resistant A. baumannii bacteremia compared 14 day mortality between a colistin/carbapenem and colistin/tigecycline combination31. Patients received a standard tigecycline dosage. The colistin/tigecycline combination was independently associated with excess 14 day mortality, but only in the subgroup of patients with a tigecycline MICs greater than 2mg/L. Because of poor clinical outcomes during the pneumonia registration studies, doubling the dose of tigecycline to a 200mg loading dose followed by 100mg every 12hours has become clinically fashionable to treat MDR gram-negative bacteria. This aggressive dose improved clinical cure (57.5% vs 30.4%, p=0.05) but not ICU mortality (48.4% vs 66.6%, p=0.14) in critically ill patients with CRAB and CRE infections32. The majority of patients, however, still received tigecycline in combination with a second antibiotic such as colistin.
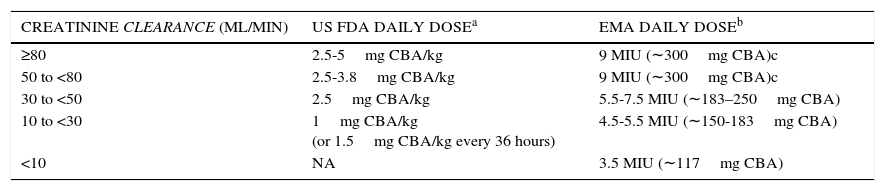
POLYMYXINSPolymyxin B and colistin (polymyxin E) have re-emerged into clinical practice because of their gram-negative activity against MDR organisms. Both antibiotics were developed during a time when pharmacodynamic studies were not required nor widely understood for new compounds; therefore, until a short time ago, package insert dosing recommendations were largely incorrect. Contemporary dosing regimens based on pharmacodynamic concepts have only recently begun to be understood, and the majority of available data has been contributed with colistin. Colistin displays concentration-dependent killing, and most studies suggest that the ƒAUC/MIC is best associated with bactericidal activity33. Using the murine, thigh infection model, a ƒAUC/MIC of 12 was required to achieve a 2 log reduction against P. aeruginosa and A. baumannii strains. However, in the murine lung infection model, this ƒAUC/MIC exposure increased to 48 for a 1 log reduction; furthermore, 2 of 3 A. baumannii strains tested never achieved this level of killing with any exposure tested. Considering colistin protein binding is approximately 50% in humans and estimating exposure over 24hours, average steady state concentrations of 1 and 4mg/L correspond with ƒAUC/MIC ratios of 12 and 48, respectively, when the colistin MIC is 1mg/L. Notably, colistin induced nephrotoxicity is concentration dependent and disproportionally increases with concentrations greater than 2.5mg/L. It should therefore become quickly apparent to the reader that the exposures required for efficacy significantly overlap with those that produce toxicity. Moreover, these required exposures are at an MIC of only 1mg/L; greater exposures are proportionally required for higher MICs. At the time of writing, the Clinical Laboratory Standards Institute (CLSI) and European Committee on Antimicrobial Susceptibility Testing (EUCAST) were in discussions to harmonize colistin breakpoints. EUCAST defines susceptibility against P. aeruginosa at ≤4mg/L, and against A. baumannii and Enterobacteriaceae at ≤2mg/L. CLSI uses ≤2mg/L for the non-fermenting gram-negatives, but has no breakpoint defined for enterobacteriaceae. Based on contemporary pharmacokinetic data from Garonzik and colleagues34, the European Medicines Agency (EMA) approved updated dosing suggestions for patients with varying degrees of renal function. This was followed by recommendations from the US Food and Drug Administration (FDA). A summary of these new dosing recommendations is provided in Table 2. An ensuing simulation study compared the EMA and FDA dosing recommendations with standard physician dosing35. Both EMA and FDA doses resulted in greater average steady-state concentrations compared with physician selected doses, and EMA dosing provided the highest average concentrations across the creatinine clearance (CrCL) ranges. However, recommended dosing regimens from both agencies were able to provide a high probability of steady-state concentrations above 2mg/L when CrCL was ≥80ml/min. Therefore, caution is advised in using colistin as monotherapy when patients have good kidney function, MICs above 1mg/L, or both.
UPDATED US FOOD AND DRUG ADMINISTRATION (FDA) AND EUROPEAN MEDICINES AGENCY (EMA) DOSING RECOMMENDATIONS FOR INTRAVENOUS COLISTIMETHATE BY CREATININE CLEARANCE RANGE.
| CREATININE CLEARANCE (ML/MIN) | US FDA DAILY DOSEa | EMA DAILY DOSEb |
|---|---|---|
| ≥80 | 2.5-5mg CBA/kg | 9 MIU (∼300mg CBA)c |
| 50 to <80 | 2.5-3.8mg CBA/kg | 9 MIU (∼300mg CBA)c |
| 30 to <50 | 2.5mg CBA/kg | 5.5-7.5 MIU (∼183–250mg CBA) |
| 10 to <30 | 1mg CBA/kg (or 1.5mg CBA/kg every 36 hours) | 4.5-5.5 MIU (∼150-183mg CBA) |
| <10 | NA | 3.5 MIU (∼117mg CBA) |
CBA: colistin base activity (1mg of CBA = 2.4mg of colistimethate sodium = 30,000 IU; each colistimethate sodium vial contains 150mg CBA); MIU: million international units
FDA expressed doses in mg/kg of CBA, using actual body weight except in obese individuals, where the dosage should be based on ideal body weight. Doses are divided into 2-3 doses per day. No recommendation for a loading dose is made.
b EMA expresses doses in MIU, which have been converted to mg of CBA for this table. Doses are divided into 2-3 doses per day. The EMA recommends a loading dose of 9 MIU (∼300mg CBA) in critically ill patients.
c EMA indicates that daily doses up to 12 MIU (∼400mg CBA) may be required for patients with good renal function.
Although studies are still pending, polymyxin B is assumed to have a similar pharmacodynamic profile to colistin in that a ƒAUC/MIC of ∼12 is required for 2 log CFU reductions33. However, unlike colistin, polymyxin B is not a prodrug, thus conversion into an active form is not required and the active drug component is immediately available. Subsequently, a loading dose of polymyxin B should achieve an active peak concentration immediately. When used in combination with larger daily doses, the ƒAUC/MIC can more easily be maximized. Current dosing recommendations for polymyxin B max out at 1.5 to 2.5mg/kg per day. However, a recent pharmacokinetic study in 24 patients demonstrated that a loading dose of 2.5mg/kg as a 2 hour infusion, followed by 1.5mg/kg every 12hours as 1 hour infusions, would achieve a total daily AUC of ∼50mg*h/L in approximately 90% of patients36. This exposure would be sufficient to obtain the ƒAUC/MIC target of 12 up to MICs of 2mg/L. Notably, polymyxin B clearance is not significantly affected by reductions in creatinine clearance, so aggressive dosage adjustments in this population are not required. A retrospective study by Nelson and colleagues37 in patients with bloodstream infections due to carbapenem-resistant gram-negative rods observed that receipt of polymyxin B daily doses <1.3mg/kg was significantly associated with 30-day mortality (OR=1.58; 95% CI 1.05 to 1.81; P=0.04). Furthermore, patients with renal impairment made up 82% of those receiving reduced polymyxin B doses.
While the above data with colistin and polymyxin B are promising to guide optimal dosing, adaptive resistance remains a challenge. An in vitro pharmacodynamic study with several A. baumannii clinical isolates demonstrated significant regrowth of the total population, due to the emergence of adaptive resistance in all strains38. This occurred even in the presence of aggressive dosing regimens (i.e., simulating free steady-state average concentrations of 3mg/L). Adaptive resistance to the polymyxins has also been described with P. aeruginosa and Enterobactericeae. As a result, optimal dosing of polymyxins is encouraged, but unlikely to result in promising clinical response when administered alone, and combination therapy is routinely recommended.
THE VALUE OF THE MICA common theme from the above review of pharmacodynamic concepts for all antibiotics is the importance of MIC. When determining an optimized dosing regimen to implement in the hospital setting, the ASP should consider local resistance rate trends. Furthermore, several studies have stressed the importance of institution specific data. While general susceptibility patterns can be identified from a hospital antibiogram, details on the MIC distributions of organisms are frequently absent.
True antibiotic MIC testing is uncommonly conducted by most microbiology laboratories because it is more labor intensive and costly than automated (Vitek II™, Microscan™, etc.) susceptibility testing alone. Additionally, most prescribers have not received training to properly interpret the MIC. For these reasons, the microbiology laboratory typically only conducts breakpoint testing, which is synonymous with MIC testing but over only a small range of dilutions around the susceptibility and resistance breakpoints. For example, if an antibiotic's susceptibility and resistance breakpoints are ≤8mg/L and ≥32mg/L, respectively, most automated systems will only test these concentrations. If the bacteria do not grow at 8mg/L, then “susceptibility” is reported. It cannot be determined, however, if the MIC is 8mg/L (i.e., borderline susceptible) or much lower (e.g., 0.5mg/L). Likewise, if the organism grows at both concentrations (8 and 32mg/L), then it is reported as resistant, but clearly the organism may have a MIC of 32mg/L and potentially be treated with a higher than standard dose of the antibiotic, or the MIC may be much higher (e.g., 256mg/L), in which case it would not be possible to obtain the required bactericidal exposure without significantly increasing the risk of toxicity to the patient. MIC data are most useful when considering antibiotic pharmacodynamics because drug exposure is always referenced to the MIC when deciding how much and over what dosing interval to administer an antibiotic.
MIC testing can be conducted using various methods: broth microdilution, macrodilution, agar dilution, Etest® (BioMérieux, Durham, NC, USA), a type of diffusion test using gradient technology, and finally with some automated systems. The BD Phoenix™ Automated Microbiology System (BD Diagnostics, Sparks, MD, USA) and Vitek® 2 (BioMérieux, Durham, NC, USA) will also provide MIC results for an antibiotic/bacteria combination, but only over a few dilution ranges. For example, cefepime MICs for gram-negatives on the BD Phoenix™ system test from 0.5 to 16mg/L, which again would not inform the provider if an organism is potentially treatment with a higher dose/prolonged infusion at 32mg/L. When feasible, the use of broth microdilution or Etest is preferred to collect data on MIC distributions locally (by hospital or by unit), and can also be used for individual patients with MDR infections to help optimize antibiotic therapy, as both of these methodologies will provide for a larger MIC range to be tested.
IMPLEMENTING OPTIMIZED REGIMENS BY THE ASPASPs can take two different approaches to optimizing the use of an antibiotic. The traditional approach is to focus on the antibiotic itself; each time it is prescribed, that antibiotic is being optimized for that individual patient. The second is to approach the treatment of the infection itself using the most optimal strategy. With respect to implementing an optimized antibiotic dosing regimen in the institution, the latter strategy holds more merit. Before determining which antibiotic and dosing regimen to apply optimization to, it is critical to understand what the most likely causative pathogens are for the infection (e.g., ventilator associated pneumonia) and the MICs for these most causative bacteria.
The ventilator associated pneumonia clinical pathway at our hospital was instituted after collection of 8 months of bacteria surveillance data and MIC testing39. Pharmacodynamic models were employed based on the most frequent causative pathogen for which MIC data were available, P. aeruginosa, to determine the choice of antibiotic and dosage regimen that would provide the greatest likelihood of obtaining its bactericidal pharmacodynamic exposure. Both continuous and prolonged infusion regimens as well as standard dosages were evaluated against the P. aeruginosa population. Due to increasing resistance in certain ICUs at our hospital, high-dose prolonged infusion regimens of cefepime or meropenem (2g every 8hours as 3 hour infusions) were required to achieve optimal exposure, as these regimens would obtain a high likelihood of attaining pharmacodynamic exposure against isolates with MICs up to 32 and 16mg/L, respectively. In addition, tobramycin 7mg/kg once daily was advocated due to the frequency of multi-drug resistant organisms and the MIC90 for the P. aeruginosa population remaining at 2mg/L. Fluoroquinolones were strongly discouraged and reserved for patients unable to get aminoglycosides. Finally, a high dose vancomycin protocol was initiated aiming for trough values in the range of 15-20μg/ml to cover for MRSA. After the protocol was initiated, we learned that our MRSA population predominantly had vancomycin MICs of 1.5 to 2mg/L. As a result, we now allow the prescriber to change therapy to linezolid if a patient with MRSA is not improving by day 3 of high-dose vancomycin therapy. These dosing regimens were protocolized in the ICUs using a computerized provider order set. Education was conducted for all providers, nurses, and pharmacists on the background/justification of the program and when to use it.
After 12 months of use, data were collected to evaluate the impact (both clinical outcomes as well as compliance) of the clinical pathway. Compliance was nearly 100%, and 94 patients were treated for ventilator associated pneumonia during that time. Compared with the 74 patients used as historical controls, patients treated by the clinical pathway with cefepime or meropenem optimized dosing regimens had lower infection-related mortality (8.5% vs 21.6%, p=0.029), were more likely to receive an antibiotic with activity against the causative pathogen empirically (71.6%, vs 48.6%, p=0.007), had less MDR superinfections (9.6% vs 27.0%, p=0.006) and less infection related length of hospital stay (10.5 vs 23 days, p<0.001). An economic analysis observed approximately $40,000 (US$) savings per patient treated on the clinical pathway40. This program is still a mandatory protocol in our ICUs, although we continue to make adjustments to our antibiotics and dosing regimens after screening MICs every couple of years. More recently, a prolonged infusion piperacillin/tazobactam regimen (4.5g q6h as a 3 hour infusion) has been implemented across our health system based on MIC data, contemporary pharmacokinetics, and the use of smart pumps across the system.
For the above clinical pathway, implementation was solely in the ICUs, which made education and monitoring easier. We also focused our optimization strategy around beta-lactams, aminoglycosides and vancomycin, as these antibiotics were most appropriate for the causative pathogens observed in ventilator associated pneumonia. Agents such as polymyxin B and tigecycline are, fortunately, rarely required at our hospital due to few CRAB and CRE organisms. However, should this be different at another hospital, dosage selection and implementation should follow the same strategy as described above, which would include first, an understanding of MIC distributions for your population, followed by implementation of the most optimal dosing regimen to cover most of these pathogens. A follow up evaluation after a defined period of time (or number of cases treated) is paramount to ensuring compliance and outcomes are in line with expectations. A critical but common mistake, however, would be to simply implement an optimized dosing regimen that has been described in the literature or used at another hospital without consideration of your local epidemiology, as outcomes may be largely different.
SUMMARYThe continued rise of MDR bacteria in the hospital setting has fostered the need for ASP and the use of pharmacodynamically optimized dosing regimens to ensure aggressive treatment of these infections. Optimized dosing regimens for beta-lactams include higher doses combined with continuous or prolonged infusions to increase the fT>MIC. In contrast, aminoglycosides required the use of higher doses and extended intervals. Finally, tigecycline and polymyxin B regimens also required higher doses combined with similar dosing intervals to increase the likelihood of attaining pharmacodynamic exposure. The successful implementation of one of these regimens, however, requires a thorough understanding of local epidemiology and MIC before any regimen can be selected.
The author declares no conflicts of interest in relation to this article.