


Dental characteristics were compared in population samples of Spanish and Portuguese military personnel. The main aim of this study was to identify those dental characteristics that could potentially serve to differentiate between these populations in a forensic analysis.
Material and methodsA sample of 5136 individuals belonging to the professional military staff of the Portuguese and Spanish armed forces was studied. Dental data were recorded with the Forensic Dental Symbols® for the Dental Encoder® database. The population sample analysed in this study consisted of 68.1% Spanish and 31.9% Portuguese individuals.
ResultsThe population was mostly male, with 86.6% men (88.1% in the Spanish sample versus 83.4% in the Portuguese sample), and 13.4% women (11.9% Spanish and 16.6% Portuguese). The frequency of unrestored teeth was lowest for first molars in all quadrants, and the highest frequency of unrestored teeth (>90%) was for the upper and lower anterior teeth and lower first premolars. The highest frequencies of restorative treatment were found for the first and second molars in all quadrants, and the highest frequencies of missing teeth were found for the third molars (always >28%). Concordance analysis showed that correlations between contralateral teeth were significantly higher than between antagonist teeth in both samples.
ConclusionsOur findings provide potentially useful information on the importance of dental record databases and their value for identification purposes.
Se ha realizado una comparación de las características dentales de 2poblaciones militares de Portugal y España. El objetivo principal de esta investigación fue identificar aquellas características dentales que podrían ser de utilidad para diferenciar estas poblaciones en un análisis forense.
Material y métodosEl estudio se realizó en una muestra compuesta por 5.136 militares profesionales de las fuerzas armadas, el 31.9% eran militares portugueses y el 68,1% del total de la muestra pertenecían a las fuerzas armadas españolas. Los datos dentales se registraron empleando los símbolos dentales descritos en Forensic Dental Symbols®, gestionados con la base de datos Dental Encoder®.
ResultadosLa población de estudio estaba constituida por un 86,6% de hombres (88,1% en la muestra española y 83,4% en la muestra portuguesa) y un 13,4% de mujeres (11,9% en la muestra española y 16,6% en la muestra portuguesa). La frecuencia de dientes no restaurados fue menor para los primeros molares en todos los cuadrantes, mientras que la mayor frecuencia de esta característica (>90%) se observó en los dientes anteriores, superiores e inferiores, y en los primeros premolares inferiores. Las frecuencias más altas de tratamientos restauradores fueron encontradas para los primeros y segundos molares en todos los cuadrantes, y las mayores frecuencias de ausencias dentarias se observaron en los terceros molares (superior al 28% en todos los cuadrantes). El análisis de concordancia mostró que las correlaciones entre los dientes contralaterales fueron significativamente mayores que entre los dientes antagonistas, para ambas muestras poblacionales de estudio.
ConclusionesNuestros resultados proporcionan información potencialmente útil sobre la importancia de las bases de datos de registros dentales y el análisis de las características dentales con fines de identificación.
Human identification requires determination of the particular characteristics or set of qualities that distinguish one person from all others and make them unique. All individuals are born with an identity and have the right to die with it. Establishing identity also raises a series of legal issues (inheritance, custody or life insurance) and issues of a psychological nature for families and friends of the deceased (the agony of waiting and prolonged unsuccessful attempts at identification), without also forgetting the social and political implications.1,2
Dental examination is one of the most important identification methods available. The enormous variety of individualising characteristics that the human teeth and jaws provide us with is of inestimable value for establishing a subject's identity as, starting from a closed population of individuals, just one of these characteristics can confirm the identity of an individual or allow them to be excluded.3
Dental identification is successfully achieved when the comparison between ante-mortem and post-mortem dental records reveals a significant match and the absence of absolute discrepancies, which ensures a considerable degree of certainty with regard to the identity of the subject based on available dental records.4 If complete clinical data are provided, forensic dentists can conclude the dental identification in a short period of time and with a high degree of certainty, due to the inherent variability and uniqueness of the human dentition.5 Despite this, forensic dentists are often required to establish the probability of identification in the courts, as is done in forensic genetics, where estimating the probability of identification or likelihood ratio is possible due to the fact that we know the frequencies of the various gene markers in specific populations.6
However, the lack of epidemiological data on the frequency distribution of the various clinical situations (diseases and treatments) for each tooth and in populations of different origin makes it difficult to estimate probabilities in dental identification. With the aim of contributing to estimation of the probabilities of diversity patterns, various authors have been carrying out studies on the frequencies of dental treatment and dental disease patterns in civil and military populations.5–15 For military forces involved in peace or war missions, human identification is of particular importance. Because they are often exposed to extreme risk situations, it is more likely that military personnel will require identification compared to the civilian population.1,16 It is for this reason that specific protocols have been developed to regulate the technical procedures for identifying victims in the armed forces.17,18
Comparisons of dental data from military personnel from different countries can determine whether these populations are distinguishable based on their dental characteristics for forensic identification purposes. In this study, we determined the differences and similarities in the dental characteristics of a Spanish and Portuguese military population sample. The main aim of this study was to identify dental characteristics that could be useful for differentiating these populations in a forensic analysis for the purpose of human identification.
Material and methodsThe data analysed came from a sample of 5136 individuals working as professional soldiers in the Portuguese and Spanish armed forces. The study was conducted in accordance with the personal data protection laws and the international recommendations of the World Medical Association for clinical research, as set out in the Declaration of Helsinki. The research and data collection was carried out with the authorisation of the Ethics Committee of the Hospital Militar D. Pedro V in Oporto (Portugal) and the Spanish Ministry of Defence, in compliance with the regulations on patients’ rights and personal data protection. A signed informed consent form was obtained from each patient, with authorisation for the epidemiological and statistical use of their dental data.
The teeth were identified and named according to the World Dental Federation (Fédération Dentaire Internationale; FDI) nomenclature. The dental clinical characteristics were recorded in their corresponding dental charts using the Forensic Dental Symbols® system, also using the Dental Encoder® database6,19 for analysis and management, designed and adapted to the Disaster Victim Identification (DVI) dental forms proposed by Interpol.20
For the analysis of dental characteristics, we used a dental coding system applied in a previous study11 that classifies these characteristics into four types: (1) unrestored, which includes healthy teeth, unfilled cavities (regardless of the surfaces involved), root remains, fissure sealants and partially erupted teeth; (2) filled, including filled teeth, regardless of the material used or the surfaces involved; (3) missing, which includes tooth extractions, impacted teeth, agenesis and removable prosthetic crowns and (4) crown, which includes teeth with crowns, bridge abutments, fixed prosthetic pontics and implant crowns.
With this coding system, cases with similar clinical characteristics are grouped in the same category, i.e. all filled or all missing teeth, regardless of the reason. This summarised coding system tends to reduce and rectify some common errors intrinsic to the observations, which include the incorrect delimitation of the restored surfaces or the type of material used, the reason for a missing tooth (extracted or impacted) and the distinction between pillar and pontic in fixed prostheses. The system also simulates the dental data collection process performed by forensic dentists in major disasters.20
The data collected included the age of the individuals, so, for this analysis, the sample was divided into eight age groups: 18–22, 23–27, 28–32, 33–37, 38–42, 43–47, 48–52 and >53. The main reason for this grouping is the lack of detailed information on dental characteristics by age, and the need to perform a more precise statistical study. With this dual purpose, we designed the new variable (called “age group”) in which the sample was distributed into five-year age groups. The sample size for each category and population was large enough for subsequent statistical analysis.
To analyse the data, we performed the corresponding statistical study to infer the relationships between the variables of the two populations, according to their dental characteristics, gender and age group. These analyses focused on:
- (a)
Differences between adjacent teeth (in permanent contact with each other so that they share the same position in the dental arch).
- (b)
Differences between opposing teeth (in contact during occlusion to cut or grind food when chewing).
- (c)
Differences between contralateral teeth (with an equivalent distance between them, in their position in the oral cavity and during mastication, whose morphology resembles that of their contralateral counterpart located in the right or left half of the dental arch and which erupt at the same time).
- (d)
Main differentiating factors (principal component analysis).
For all the statistical models applied in the statistical analyses and inferences, a 95% confidence interval was used. In view of the sample size (5136), parametric tests were used for the ordinal variable (age group), and non-parametric tests for the categorical variables. All the statistical studies were carried out using tools from Excel, Dental Encoder® and SPSS version 23.0.
ResultsThe population sample studied consisted of 68.1% Spanish soldiers and 31.9% Portuguese soldiers. Overall, 86.6% were male (88.1% in the Spanish sample and 83.4% in the Portuguese sample) and 13.4% female (11.9% of the Spanish and 16.6% of the Portuguese). Although significant differences were detected in the proportions of males and females (p=0.000), the difference between nationalities was not statistically significant.
In terms of distribution by age group, the largest in both nationalities was the 23–27-year-old age group; 32.0% of the Portuguese sample and 28.4% of the Spanish sample. There were also differences in relative proportions between the Portuguese and Spanish samples in other age groups, with 14.3% of the Portuguese aged 18–22 and 11.8% aged 28–32, compared to 20.6% of the Spanish aged 18–22 and 23.3% aged 28–32.
In all age groups, there were fewer females than males; however, the distributions in the age groups varied according to gender. For both males and females, the largest numbers were in the 23–27-year-old age group, although this represented 48.8% of all females compared to 26.6% of all the males. None of the age groups from 38 to 42 upwards had more than 1.6% of the overall female sample, while the proportion of the overall males in these groups was consistently greater than 5.4%.
For the distribution of dental characteristics for each tooth, without distinguishing between nationalities, the first molars had the lowest rates of unrestored teeth (50.9–60.8%). In upper and lower anterior teeth and lower first premolars, the rate for unrestored teeth was above 90% (89.6–98.8%). The highest rates for filled teeth were found in the first and second molars in all quadrants (20.8–28.4%), while the highest rates for missing teeth were found for the third molars (28.6–32.7%).
The relative frequency of crowns was low and varied from 0.1 to 4.3%. However, crowns were most common in the upper incisors (11 [3.3%], 21 [3.7%]), premolars (14 [3.5%], 15 [3.5%], 24 [3.2%] and 25 [3.3%]) and first molars (16 [3.1%] and 26 [3.5%]), while in the lower jaw they were more common in the first molars (36 [4.1%] and 46 [4.3%]).
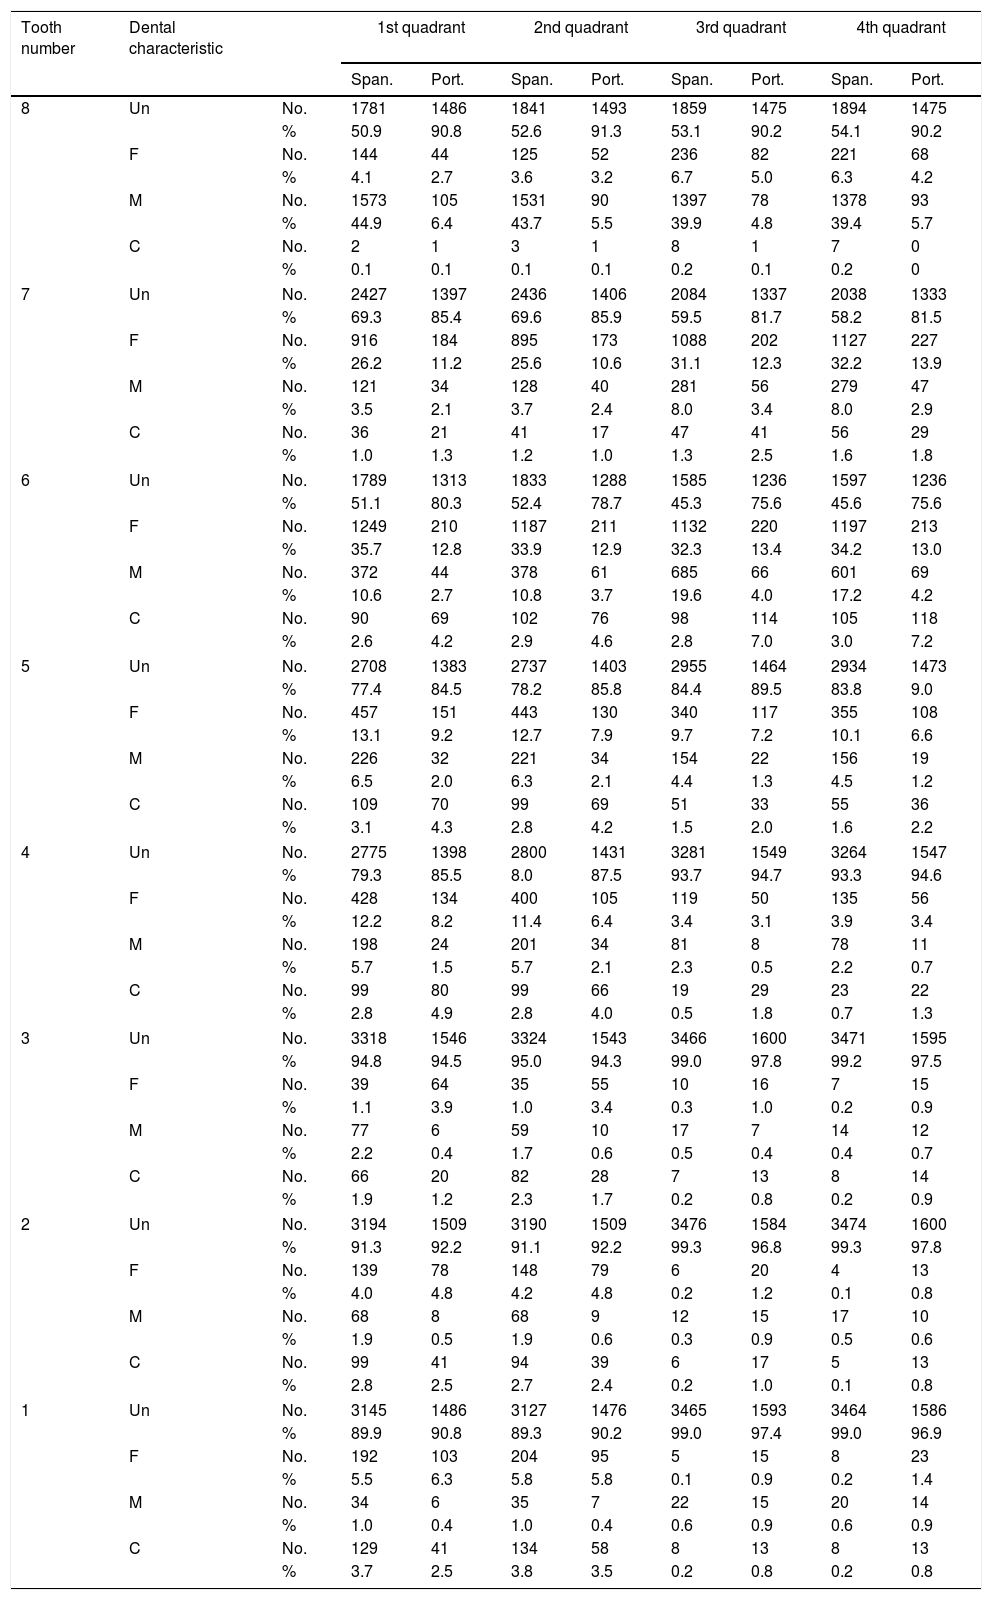
A contingency table was constructed for each nationality, tooth and dental characteristic (Table 1). Chi-square tests revealed significant differences between populations for all teeth (p=0.000).
Contingency table by nationality for each tooth and dental characteristic.
| Tooth number | Dental characteristic | 1st quadrant | 2nd quadrant | 3rd quadrant | 4th quadrant | |||||
|---|---|---|---|---|---|---|---|---|---|---|
| Span. | Port. | Span. | Port. | Span. | Port. | Span. | Port. | |||
| 8 | Un | No. | 1781 | 1486 | 1841 | 1493 | 1859 | 1475 | 1894 | 1475 |
| % | 50.9 | 90.8 | 52.6 | 91.3 | 53.1 | 90.2 | 54.1 | 90.2 | ||
| F | No. | 144 | 44 | 125 | 52 | 236 | 82 | 221 | 68 | |
| % | 4.1 | 2.7 | 3.6 | 3.2 | 6.7 | 5.0 | 6.3 | 4.2 | ||
| M | No. | 1573 | 105 | 1531 | 90 | 1397 | 78 | 1378 | 93 | |
| % | 44.9 | 6.4 | 43.7 | 5.5 | 39.9 | 4.8 | 39.4 | 5.7 | ||
| C | No. | 2 | 1 | 3 | 1 | 8 | 1 | 7 | 0 | |
| % | 0.1 | 0.1 | 0.1 | 0.1 | 0.2 | 0.1 | 0.2 | 0 | ||
| 7 | Un | No. | 2427 | 1397 | 2436 | 1406 | 2084 | 1337 | 2038 | 1333 |
| % | 69.3 | 85.4 | 69.6 | 85.9 | 59.5 | 81.7 | 58.2 | 81.5 | ||
| F | No. | 916 | 184 | 895 | 173 | 1088 | 202 | 1127 | 227 | |
| % | 26.2 | 11.2 | 25.6 | 10.6 | 31.1 | 12.3 | 32.2 | 13.9 | ||
| M | No. | 121 | 34 | 128 | 40 | 281 | 56 | 279 | 47 | |
| % | 3.5 | 2.1 | 3.7 | 2.4 | 8.0 | 3.4 | 8.0 | 2.9 | ||
| C | No. | 36 | 21 | 41 | 17 | 47 | 41 | 56 | 29 | |
| % | 1.0 | 1.3 | 1.2 | 1.0 | 1.3 | 2.5 | 1.6 | 1.8 | ||
| 6 | Un | No. | 1789 | 1313 | 1833 | 1288 | 1585 | 1236 | 1597 | 1236 |
| % | 51.1 | 80.3 | 52.4 | 78.7 | 45.3 | 75.6 | 45.6 | 75.6 | ||
| F | No. | 1249 | 210 | 1187 | 211 | 1132 | 220 | 1197 | 213 | |
| % | 35.7 | 12.8 | 33.9 | 12.9 | 32.3 | 13.4 | 34.2 | 13.0 | ||
| M | No. | 372 | 44 | 378 | 61 | 685 | 66 | 601 | 69 | |
| % | 10.6 | 2.7 | 10.8 | 3.7 | 19.6 | 4.0 | 17.2 | 4.2 | ||
| C | No. | 90 | 69 | 102 | 76 | 98 | 114 | 105 | 118 | |
| % | 2.6 | 4.2 | 2.9 | 4.6 | 2.8 | 7.0 | 3.0 | 7.2 | ||
| 5 | Un | No. | 2708 | 1383 | 2737 | 1403 | 2955 | 1464 | 2934 | 1473 |
| % | 77.4 | 84.5 | 78.2 | 85.8 | 84.4 | 89.5 | 83.8 | 9.0 | ||
| F | No. | 457 | 151 | 443 | 130 | 340 | 117 | 355 | 108 | |
| % | 13.1 | 9.2 | 12.7 | 7.9 | 9.7 | 7.2 | 10.1 | 6.6 | ||
| M | No. | 226 | 32 | 221 | 34 | 154 | 22 | 156 | 19 | |
| % | 6.5 | 2.0 | 6.3 | 2.1 | 4.4 | 1.3 | 4.5 | 1.2 | ||
| C | No. | 109 | 70 | 99 | 69 | 51 | 33 | 55 | 36 | |
| % | 3.1 | 4.3 | 2.8 | 4.2 | 1.5 | 2.0 | 1.6 | 2.2 | ||
| 4 | Un | No. | 2775 | 1398 | 2800 | 1431 | 3281 | 1549 | 3264 | 1547 |
| % | 79.3 | 85.5 | 8.0 | 87.5 | 93.7 | 94.7 | 93.3 | 94.6 | ||
| F | No. | 428 | 134 | 400 | 105 | 119 | 50 | 135 | 56 | |
| % | 12.2 | 8.2 | 11.4 | 6.4 | 3.4 | 3.1 | 3.9 | 3.4 | ||
| M | No. | 198 | 24 | 201 | 34 | 81 | 8 | 78 | 11 | |
| % | 5.7 | 1.5 | 5.7 | 2.1 | 2.3 | 0.5 | 2.2 | 0.7 | ||
| C | No. | 99 | 80 | 99 | 66 | 19 | 29 | 23 | 22 | |
| % | 2.8 | 4.9 | 2.8 | 4.0 | 0.5 | 1.8 | 0.7 | 1.3 | ||
| 3 | Un | No. | 3318 | 1546 | 3324 | 1543 | 3466 | 1600 | 3471 | 1595 |
| % | 94.8 | 94.5 | 95.0 | 94.3 | 99.0 | 97.8 | 99.2 | 97.5 | ||
| F | No. | 39 | 64 | 35 | 55 | 10 | 16 | 7 | 15 | |
| % | 1.1 | 3.9 | 1.0 | 3.4 | 0.3 | 1.0 | 0.2 | 0.9 | ||
| M | No. | 77 | 6 | 59 | 10 | 17 | 7 | 14 | 12 | |
| % | 2.2 | 0.4 | 1.7 | 0.6 | 0.5 | 0.4 | 0.4 | 0.7 | ||
| C | No. | 66 | 20 | 82 | 28 | 7 | 13 | 8 | 14 | |
| % | 1.9 | 1.2 | 2.3 | 1.7 | 0.2 | 0.8 | 0.2 | 0.9 | ||
| 2 | Un | No. | 3194 | 1509 | 3190 | 1509 | 3476 | 1584 | 3474 | 1600 |
| % | 91.3 | 92.2 | 91.1 | 92.2 | 99.3 | 96.8 | 99.3 | 97.8 | ||
| F | No. | 139 | 78 | 148 | 79 | 6 | 20 | 4 | 13 | |
| % | 4.0 | 4.8 | 4.2 | 4.8 | 0.2 | 1.2 | 0.1 | 0.8 | ||
| M | No. | 68 | 8 | 68 | 9 | 12 | 15 | 17 | 10 | |
| % | 1.9 | 0.5 | 1.9 | 0.6 | 0.3 | 0.9 | 0.5 | 0.6 | ||
| C | No. | 99 | 41 | 94 | 39 | 6 | 17 | 5 | 13 | |
| % | 2.8 | 2.5 | 2.7 | 2.4 | 0.2 | 1.0 | 0.1 | 0.8 | ||
| 1 | Un | No. | 3145 | 1486 | 3127 | 1476 | 3465 | 1593 | 3464 | 1586 |
| % | 89.9 | 90.8 | 89.3 | 90.2 | 99.0 | 97.4 | 99.0 | 96.9 | ||
| F | No. | 192 | 103 | 204 | 95 | 5 | 15 | 8 | 23 | |
| % | 5.5 | 6.3 | 5.8 | 5.8 | 0.1 | 0.9 | 0.2 | 1.4 | ||
| M | No. | 34 | 6 | 35 | 7 | 22 | 15 | 20 | 14 | |
| % | 1.0 | 0.4 | 1.0 | 0.4 | 0.6 | 0.9 | 0.6 | 0.9 | ||
| C | No. | 129 | 41 | 134 | 58 | 8 | 13 | 8 | 13 | |
| % | 3.7 | 2.5 | 3.8 | 3.5 | 0.2 | 0.8 | 0.2 | 0.8 | ||
C: crown; F: filled; M: missing; Port.: Portuguese; Span.: Spanish; Un: unrestored.
In terms of the characteristics, our data showed that most of the teeth were unrestored. In the anterior teeth (incisors and canines), the proportion unrestored was very similar between the Spanish and Portuguese populations. However, there were differences between the two populations in the relative distribution of dental characteristics for the first, second and third molars. The T tests for paired samples showed significant differences as listed below:
- •
For the first, second and third molars, the rate for filled teeth was significantly higher in the Spanish population, while the rate for unrestored teeth was significantly higher in the Portuguese population.
- •
For the first and third molars, the rate for missing teeth was significantly higher in the Spanish population.
- •
For the first and second premolars, the rates for filled and missing teeth were lower in the Portuguese sample, although the differences between the Spanish and Portuguese populations were not significant.
- •
For the central and lateral incisors, the proportion of missing teeth was higher in the first and second quadrants in the Spanish sample, but higher in the third and fourth quadrants in the Portuguese sample. However, the differences were not significant.
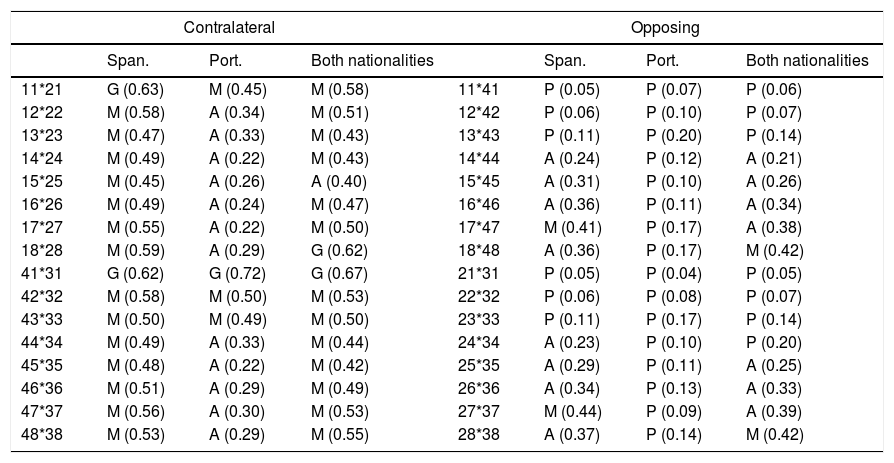
Analysis of concordance by Cohen's kappa coefficient to contrast the data between contralateral teeth (Table 2) showed good agreement in pairs 18–28 and 41–31 and moderate agreement for the remaining pairs. Among the pairs with moderate agreement, the kappa coefficient was equal to or greater than 0.5 for the pairs 11–21, 12–22, 17–27, 42–32, 43–33, 47–37 and 48–38. The concordance analysis also showed that the correlations between the contralateral teeth were significantly greater (i.e. never less than 0.4) than between the opposing teeth in both samples. The concordance levels for the pairs of opposing teeth were consistently low (Table 2) for all teeth in the Portuguese population and for pairs 11–41, 12–42, 13–43, 21–31, 22–32 and 23–33 in the Spanish population. In general, the levels of concordance were low or moderate, rather than good or very good.
Analysis of concordance.
| Contralateral | Opposing | ||||||
|---|---|---|---|---|---|---|---|
| Span. | Port. | Both nationalities | Span. | Port. | Both nationalities | ||
| 11*21 | G (0.63) | M (0.45) | M (0.58) | 11*41 | P (0.05) | P (0.07) | P (0.06) |
| 12*22 | M (0.58) | A (0.34) | M (0.51) | 12*42 | P (0.06) | P (0.10) | P (0.07) |
| 13*23 | M (0.47) | A (0.33) | M (0.43) | 13*43 | P (0.11) | P (0.20) | P (0.14) |
| 14*24 | M (0.49) | A (0.22) | M (0.43) | 14*44 | A (0.24) | P (0.12) | A (0.21) |
| 15*25 | M (0.45) | A (0.26) | A (0.40) | 15*45 | A (0.31) | P (0.10) | A (0.26) |
| 16*26 | M (0.49) | A (0.24) | M (0.47) | 16*46 | A (0.36) | P (0.11) | A (0.34) |
| 17*27 | M (0.55) | A (0.22) | M (0.50) | 17*47 | M (0.41) | P (0.17) | A (0.38) |
| 18*28 | M (0.59) | A (0.29) | G (0.62) | 18*48 | A (0.36) | P (0.17) | M (0.42) |
| 41*31 | G (0.62) | G (0.72) | G (0.67) | 21*31 | P (0.05) | P (0.04) | P (0.05) |
| 42*32 | M (0.58) | M (0.50) | M (0.53) | 22*32 | P (0.06) | P (0.08) | P (0.07) |
| 43*33 | M (0.50) | M (0.49) | M (0.50) | 23*33 | P (0.11) | P (0.17) | P (0.14) |
| 44*34 | M (0.49) | A (0.33) | M (0.44) | 24*34 | A (0.23) | P (0.10) | P (0.20) |
| 45*35 | M (0.48) | A (0.22) | M (0.42) | 25*35 | A (0.29) | P (0.11) | A (0.25) |
| 46*36 | M (0.51) | A (0.29) | M (0.49) | 26*36 | A (0.34) | P (0.13) | A (0.33) |
| 47*37 | M (0.56) | A (0.30) | M (0.53) | 27*37 | M (0.44) | P (0.09) | A (0.39) |
| 48*38 | M (0.53) | A (0.29) | M (0.55) | 28*38 | A (0.37) | P (0.14) | M (0.42) |
A: acceptable (0.21–0.40); G: good (0.61–0.80); M: moderate (0.41–0.60); P: poor (≤0.20); Port.: Portuguese; Span.: Spanish; VG: very good (0.81–1.0).
In the Spanish sample, the contralateral teeth showed better concordance than in the Portuguese sample for 13 of the 16 pairs of teeth. A similar situation was found in the opposing teeth; the concordances were again higher in the Spanish population for 10 of the 16 pairs of teeth. However, concordance for opposing teeth was generally lower in both samples, so this subset of tooth pairs provided less discriminatory power than the subset of contralateral tooth pairs. In summary, the concordance analysis provided useful information (along with other factors) to differentiate between populations.
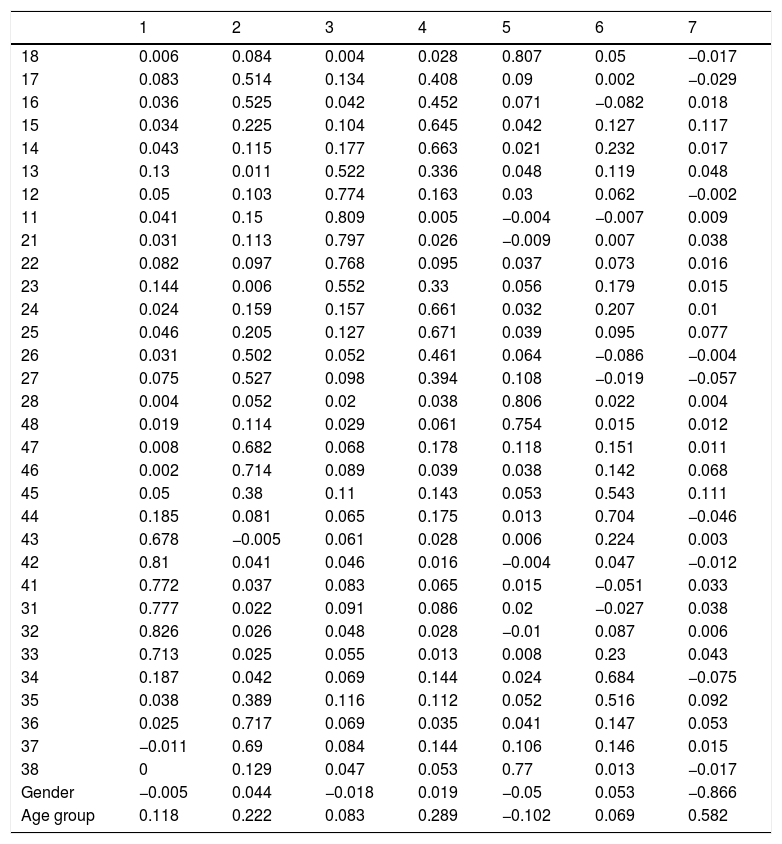
The principal components analysis (each component represents a proportion of each variable) was carried out with three different samples: all the records for both samples; the Spanish population only; and the Portuguese sample only. Based on the varimax rotation with Kaiser normalisation, seven components of the three samples were extracted and the composition of the components was the same for the three samples, i.e. the teeth, age and gender were grouped together in the same way in each sample. Table 3 shows the loading of each factor (teeth/gender/age group) in each component for the whole sample. Six components were identified, as summarised in Fig. 1, which shows the factors that produced the best correlations. Component number seven included the variables “age group” and “gender”.
Loadings of each principal component grouped according to the varimax rotation with Kaiser normalisation.
| 1 | 2 | 3 | 4 | 5 | 6 | 7 | |
|---|---|---|---|---|---|---|---|
| 18 | 0.006 | 0.084 | 0.004 | 0.028 | 0.807 | 0.05 | −0.017 |
| 17 | 0.083 | 0.514 | 0.134 | 0.408 | 0.09 | 0.002 | −0.029 |
| 16 | 0.036 | 0.525 | 0.042 | 0.452 | 0.071 | −0.082 | 0.018 |
| 15 | 0.034 | 0.225 | 0.104 | 0.645 | 0.042 | 0.127 | 0.117 |
| 14 | 0.043 | 0.115 | 0.177 | 0.663 | 0.021 | 0.232 | 0.017 |
| 13 | 0.13 | 0.011 | 0.522 | 0.336 | 0.048 | 0.119 | 0.048 |
| 12 | 0.05 | 0.103 | 0.774 | 0.163 | 0.03 | 0.062 | −0.002 |
| 11 | 0.041 | 0.15 | 0.809 | 0.005 | −0.004 | −0.007 | 0.009 |
| 21 | 0.031 | 0.113 | 0.797 | 0.026 | −0.009 | 0.007 | 0.038 |
| 22 | 0.082 | 0.097 | 0.768 | 0.095 | 0.037 | 0.073 | 0.016 |
| 23 | 0.144 | 0.006 | 0.552 | 0.33 | 0.056 | 0.179 | 0.015 |
| 24 | 0.024 | 0.159 | 0.157 | 0.661 | 0.032 | 0.207 | 0.01 |
| 25 | 0.046 | 0.205 | 0.127 | 0.671 | 0.039 | 0.095 | 0.077 |
| 26 | 0.031 | 0.502 | 0.052 | 0.461 | 0.064 | −0.086 | −0.004 |
| 27 | 0.075 | 0.527 | 0.098 | 0.394 | 0.108 | −0.019 | −0.057 |
| 28 | 0.004 | 0.052 | 0.02 | 0.038 | 0.806 | 0.022 | 0.004 |
| 48 | 0.019 | 0.114 | 0.029 | 0.061 | 0.754 | 0.015 | 0.012 |
| 47 | 0.008 | 0.682 | 0.068 | 0.178 | 0.118 | 0.151 | 0.011 |
| 46 | 0.002 | 0.714 | 0.089 | 0.039 | 0.038 | 0.142 | 0.068 |
| 45 | 0.05 | 0.38 | 0.11 | 0.143 | 0.053 | 0.543 | 0.111 |
| 44 | 0.185 | 0.081 | 0.065 | 0.175 | 0.013 | 0.704 | −0.046 |
| 43 | 0.678 | −0.005 | 0.061 | 0.028 | 0.006 | 0.224 | 0.003 |
| 42 | 0.81 | 0.041 | 0.046 | 0.016 | −0.004 | 0.047 | −0.012 |
| 41 | 0.772 | 0.037 | 0.083 | 0.065 | 0.015 | −0.051 | 0.033 |
| 31 | 0.777 | 0.022 | 0.091 | 0.086 | 0.02 | −0.027 | 0.038 |
| 32 | 0.826 | 0.026 | 0.048 | 0.028 | −0.01 | 0.087 | 0.006 |
| 33 | 0.713 | 0.025 | 0.055 | 0.013 | 0.008 | 0.23 | 0.043 |
| 34 | 0.187 | 0.042 | 0.069 | 0.144 | 0.024 | 0.684 | −0.075 |
| 35 | 0.038 | 0.389 | 0.116 | 0.112 | 0.052 | 0.516 | 0.092 |
| 36 | 0.025 | 0.717 | 0.069 | 0.035 | 0.041 | 0.147 | 0.053 |
| 37 | −0.011 | 0.69 | 0.084 | 0.144 | 0.106 | 0.146 | 0.015 |
| 38 | 0 | 0.129 | 0.047 | 0.053 | 0.77 | 0.013 | −0.017 |
| Gender | −0.005 | 0.044 | −0.018 | 0.019 | −0.05 | 0.053 | −0.866 |
| Age group | 0.118 | 0.222 | 0.083 | 0.289 | −0.102 | 0.069 | 0.582 |

The samples analysed are representative of the study populations. Therefore, the results can be extrapolated to the entire population of Portuguese and Spanish military personnel. The proportion of males and females was similar in the two population samples, which in our opinion justified combining the Portuguese and Spanish samples for the concordance analysis (Table 2) and the principal component analysis (Table 3).
There were considerable similarities between the two population samples. Neither the proportion of males and females nor the general state of dental health differed significantly. The distribution of age groups was also similar. To identify discriminating elements in the population, it was necessary to combine the variables “age group” and “dental characteristics” for each tooth.
Due to their anatomical occlusal surface, the first molars, both upper and lower, are more susceptible to diseases that require dental treatment. Moreover, being the first tooth of the permanent dentition to erupt, the first molars can be exposed to a greater amount of wear and tear and are at higher risk of premature extraction or other treatments.
The rate for filled teeth was lower in the upper and lower anterior teeth. These teeth do not have occlusal surfaces, so they are less susceptible to cavities that require treatment.
The incidence of missing teeth was higher for third molars, probably because these teeth, for anatomical reasons, often do not erupt and impacted teeth are susceptible to the need for extraction.
Crowns were more common in the upper teeth (incisors, canines and premolars) than in the molars, because they are more visible and prosthesis is the most common therapeutic indication, in particular for aesthetic reasons.
The largest number of significant differences between the two populations concerned the first, second and third molars. Teeth with fillings were more common in the Spanish population. A 1992 study conducted by Casañas et al.21 investigated the incidence of dental cavities in a population of schoolchildren in Barcelona (Spain). The age cohort in their sample corresponds almost exactly to the adult population sample we studied here, in which the incidence of cavities was 49.2%. Among permanent teeth with cavities, 63.4% had been filled. A 1996 study by Dolado et al.22 also analysed the incidence of cavities in Barcelona and reported that 51% of permanent teeth had cavities. These values are strongly influenced by nutritional awareness and dental care in children, and this may have contributed significantly to the differences found in our study. An epidemiological study conducted in 1990 by Peña and Bermejo23 in four-to-five-year-old children in Alicante (Spain) found that the rate of cavities among the children who attended public schools (49.5%) was considerably higher than the rate among children from private schools (35.2%), with the second group expected to come from families with a higher than average socioeconomic level. It is known that children who eat less high-sugar foods have fewer cavities.
The first molars were missing more often in the Spanish population than in the Portuguese population. This difference may reflect the favourable influence of public health programmes implemented in Portugal since 1985 which have focused on dental prevention and treatment and have targeted young people.24 An additional factor of relevance is that 47% of the Spanish population states that the economic crisis has affected the frequency of visits to the dentist.24,25
The concordance for general dental condition was higher in the Spanish population, possibly suggesting that oral health receives more attention in Spain than in Portugal. This finding may be related to body image, which seems to be valued more highly among Spaniards.
The highest concordance rates were found for the pairs of teeth 41–31, 18–28, 11–21 and 48–38. This can be explained by the fact that pairs 41–31 and 11–21 are the closest and, therefore, most exposed to similar degrees of aggression in the oral cavity. Because of their visibility, patients may request similar treatments on these teeth for aesthetic reasons. Pairs 18–28 and 48–38 are the last teeth to erupt and share similar characteristics with respect to the limited space for eruption and the frequency of the category “missing”.
The principal component analysis identified seven components, of which gender and age group were correlated (Table 3), although no other correlations were found for the other six components with the highest loading. These components involved dental characteristics and were found for teeth with shared positional characteristics or other similarities, as follows:
- •
Principal component 1 consisted of the lower anterior teeth.
- •
Principal component 2 consisted of the first and second molars of all four quadrants.
- •
Principal component 3 consisted of the upper anterior teeth.
- •
Principal component 4 consisted of the upper first and second premolars.
- •
Principal component 5 consisted of the third molars of all four quadrants.
- •
Principal component 6 consisted of the lower first and second premolars.
The correlations found here clearly reflect the anatomy and position of the tooth in the maxilla. As already mentioned, these six components correlated more weakly with the age group and gender.
ConclusionsThe two populations compared were similar in terms of the proportion of males and females and the general state of dental health. The concordance analysis showed that the correlations between the contralateral teeth were significantly higher than between the opposing teeth in both populations. In addition, elements with discriminatory potential were identified in both populations. This study determined similarities and differences in dental condition which can be applied as an auxiliary method in human identification. Additional research in this area, particularly with samples that offer more detailed information on dental characteristics, can contribute significantly to forensic dentistry by facilitating the use of these features for both positive dental identification and identity exclusion in forensic practice.
Conflict of interestsWe confirm that there are no known conflicts of interests associated with this publication. No financial support was received for carrying out this work that might have influenced its outcome.
The authors would like to sincerely thank Pedro Couto for his contribution in the improvement of the manuscript, as well as all the personnel of the Portuguese Military Hospital, including the nurses Manuela, Gabriela and Neiva, with special mention to Lieutenant Dr Joaquim Pinheiro and Dr Manuela Pinheiro for their support, without which this work would not have been possible.
Please cite this article as: Guimarães MI, Martínez Chicón J, Gonçalves J, Carneiro Sousa MJ, Márquez Ruiz AB, Valenzuela Garach A. Estudio comparativo de la diversidad de las características clínicas dentales en poblaciones militares de Portugal y España. Rev Esp Med Legal. 2018;44:99–107.