


Accurate measurement of femoral torsion is essential to diagnosing, correct surgical decision-making, and the preoperative planning of derotational osteotomies in a subgroup of anterior knee pain patients and patellofemoral instability. Several measurement techniques have been described with great variability in the magnitude of the values. Moreover, none of them can predict the effect of rotational osteotomy on the femoral version value. The purpose of the present work is to develop a method to reliably measure femoral torsion as well as to evaluate the effects of osteotomy on the femoral version angle.
Material and methods30 patients without previous signs neither symptoms of patellofemoral pain or patellofemoral instability and with a lower limbs CT were selected. Their femoral torsion was measured using the classic Jeanmart and the Murphy's method by two independent radiologists. Independently, two orthopedic surgeons measured femoral torsion with the 3D method described in this study. The intraclass coefficient correlation and the Bland-Altman tests were used to analyze qualitatively and quantitatively the intraobserver and interobserver variability of the method regarding the Jeanmart's and Murphy's method. The confidence interval of the Normal values of the new method were defined and a lineal regression analysis between the 3D-Jeanmart's and 3D-Muphy's methods was performed.
ResultsThe mean femoral version with the 3D method was 12.74° (SD 5.96°, 95% CI: 11.67°–13.82°). With Jeanmart's method, it was 12.84° (SD 8.60°, 95% CI: 11.28°–14.39°) and 15.87° (SD 10.68°, 95% CI: 13.94°–17.80°) with Murphy's method, being these differences not statistically significant. Both interobserver and intraobserver agreement of the 3D method were high.
ConclusionThe method presented in this study allows for the reliable quantification of femoral torsion in a reproducible way. This method can be applied in several open access 3D image programmes what makes its implementation in the healthcare centres possible from now on.
La medición precisa de la torsión femoral es esencial para el diagnóstico, la indicación y la planificación preoperatoria de las osteotomías desrotadoras femorales en pacientes con inestabilidad patelofemoral o dolor anterior de rodilla. Se han descrito múltiples métodos de medición, con valores muy diferentes entre ellos, y ninguno permite establecer la magnitud de la osteotomía necesaria para devolver la torsión a valores normales. El objetivo del presente trabajo es desarrollar un método de medición que permita no solo el diagnóstico de pacientes con alteraciones torsionales, sino también establecer la magnitud de la osteotomía necesaria durante la cirugía.
Material y métodosSe seleccionaron 30 pacientes sin antecedentes de patología patelofemoral que disponían de una tomografía completa de miembros inferiores por otros motivos, siendo considerados así pacientes normales. Se calculó su torsión femoral mediante los métodos de Jeanmart y de Murphy por dos radiólogos independientes. Por otra parte, dos cirujanos ortopédicos independientes realizaron la medición de la torsión mediante el método 3D propuesto. Se evaluó el comportamiento normal de los datos y se definió la variabilidad intraobservador e interobservador del método 3D mediante su coeficiente de correlación intraclase y mediante el gráfico de Bland-Altman, realizando una comparación cuantitativa y cualitativa, respectivamente, con los métodos clásicos. Se estableció el intervalo de confianza de los valores normales con el nuevo método 3D, y finalmente se analizó el patrón de regresión lineal entre los métodos de Jeanmart y Murphy con el método de medición 3D.
ResultadosLa media de torsión femoral con el método 3D fue de 12,74° (DE: 5,96°, IC95%: 11,67-13,82°). Con el método de Jeanmart, esta fue de 12,84° (DE: 8,60°, IC95%: 11,28-14,39°) y de 15,87° (DE: 10,68°, IC95%: 13,94-17,80°) con el método de Murphy. Las diferencias entre el método 3D y el método de Jeanmart no fueron significativamente estadísticas, pero sí lo fueron entre el método 3D y el método de Murphy.
La correlación entre el método de Jeanmart y el método 3D fue mayor (R2=0,65, p<2,2e-16) que con el método de Murphy (R2=0,36, p=1,209e-13).
El CCI del método 3D fue de 0,93 y 0,94 para cada investigador, con un valor interobservador medio de 0,86, siendo este similar al valor del método de Jeanmart e inferior al método de Murphy.
ConclusiónEl método que presentamos muestra una alta reproducibilidad intraobservador e interobservador, similar a los métodos clásicos de medición. Al estar basado en una medición 3D aplicable a entornos de imagen tridimensional de código abierto, se trata de un método accesible e implantable en cualquier centro de atención sanitaria.
Patellofemoral pathway dysfunction, either in the form of patellofemoral pain or patellofemoral dislocation, is a factor to consider in the study of knee pain in young patients, with an incidence of up to 22.7% in active young people.1 Because it is a common disorder, and occurs in young patients, it has great psychological, economic, and social impact on patients and their families.
The main element responsible for patellofemoral stability is the anatomical congruence between the patellar crest and femoral trochlea,2 and femoral torsion is a fundamental element in the diagnosis and treatment of patellofemoral instability. In cases in which torsional dysfunction is identified, femoral derotational osteotomy, isolated or combined with other procedures, is the surgical treatment of choice.3,4 In other patients, the aetiology of mechanical patellofemoral disorders may have another origin, and the surgical technique indicated may not be derotational osteotomy.5
Correct quantification of femoral torsion is a key element for surgical indication. However, about 25 different methods for measuring femoral torsion have been described, with significantly different normal values depending on the measurement method used.6,7 The main limitation of the current methods is that they do not allow prediction of the effect that the planned osteotomy will have on the initial torsion value, with significant variability in the effect of osteotomy, resulting in poor patient outcomes.8
The new 3D imaging techniques make it possible to improve preoperative planning, the key to their use being the availability of methods for quantifying femoral anteversion on three-dimensional imaging scenarios, to allow not only the measurement but also the design of the osteotomy required.
The aim of this study is to define the reproducibility and reliability of a method for measuring femoral torsion applicable to 3D surgical planning scenarios, to enable the use of 3D surgical planning programmes in the treatment of femoral derotational osteotomies.
Material and methodsMethod designA guide specifically designed for this purpose was used to calculate the anteversion (Fig. 1, video 1). Fig. 2 explains and illustrates how to use the guide to calculate femoral anteversion.
 Oblique view of the guide. It consists of two perpendicular planes each striped with coloured bands of 2cm each. (1.2) Pure lateral view of the guide. (1.3) Cephalocaudal (axial) view of the guide. (1.4) Anteroposterior view of the guide. (1.5) Global view of the guide positioned on a proximal femur.")
(1.1) Oblique view of the guide. It consists of two perpendicular planes each striped with coloured bands of 2cm each. (1.2) Pure lateral view of the guide. (1.3) Cephalocaudal (axial) view of the guide. (1.4) Anteroposterior view of the guide. (1.5) Global view of the guide positioned on a proximal femur.
 The guide is positioned perpendicular to the longitudinal axis of the femur. (2.2) Cephalocaudal view of the guide positioning. (2.3) Same view as 2.2 but showing the axes of rotation of the guide. All (or virtually all) 3D design and imaging software allows objects to be rotated in all three directions of the space. Once the guide is positioned as shown in the figure, the axial plane of the guide should be rotated until the central line (purple) is parallel to the femoral neck (2.4.) with incorrect positioning; (2.5) with correct positioning. The yellow and orange lines should be parallel to the anterior and posterior aspect of the femoral neck to ensure that the guide is completely parallel to the neck in the axial plane. Once positioned, we can assess its correct alignment also from an axial view (2.6). The purple and green lines allow us to see that the guide is correctly positioned in the coronal plane, although its coronal inclination would not affect the axial measurement (2.7).")
Description of the method. (2.1) The guide is positioned perpendicular to the longitudinal axis of the femur. (2.2) Cephalocaudal view of the guide positioning. (2.3) Same view as 2.2 but showing the axes of rotation of the guide. All (or virtually all) 3D design and imaging software allows objects to be rotated in all three directions of the space. Once the guide is positioned as shown in the figure, the axial plane of the guide should be rotated until the central line (purple) is parallel to the femoral neck (2.4.) with incorrect positioning; (2.5) with correct positioning. The yellow and orange lines should be parallel to the anterior and posterior aspect of the femoral neck to ensure that the guide is completely parallel to the neck in the axial plane. Once positioned, we can assess its correct alignment also from an axial view (2.6). The purple and green lines allow us to see that the guide is correctly positioned in the coronal plane, although its coronal inclination would not affect the axial measurement (2.7).
This guide is a conventional file in stereolithography format (computed assisted design® .stl), which weighs approximately 32kb and can be freely shared and downloaded for use with any 3D imaging programme. The design and measurements were performed with Microsoft 3D Builder software (Microsoft Corporation®, Redmond, Washington, USA).
Study designCross-sectional, multicentre, randomised study. The study was approved by our institution's medical research and ethics committee (2020-277-1).
Patients who had undergone a lower limb CT angiography to study their vascular tree for diabetic peripheral artery disease in 2019 were selected, and a randomisation process was applied to them using a random number table (R-statistics, version 3.5.2) until the defined pre-study sample size of 30 patients was achieved.
The CT images were then reconstructed to obtain the three-dimensional biomodel of the right femur (3D Slicer – Meshmixer®) and the femur was exported in .stl format to be imported into a home design 3D programme (3D Builder, Microsoft Corporation® version 18.0.1931.0).
Two independent orthopaedic surgeons measured femoral anteversion using the described 3D method, taking measurements twice on each femur with no less than 15 days between the two measurements. After assessing the normal or non-normal behaviour of the data, the intraobserver and interobserver agreement of the 3D method was calculated using the intraclass correlation coefficient (ICC) for normal values and plotted using the Bland–Altman plot for non-normal data.9
Independently and blinded to the results of the 3D method, two radiologists with expertise in musculoskeletal radiology measured femoral anteversion in duplicate using the traditional Jeanmart method and the Murphy method, with no less than 15 days between measurements. As with the three-dimensional method, agreement was assessed using the ICC or the Bland–Altman plot for normal and non-normal values, respectively.9
The femoral anteversion values calculated by the three methods were subjected to hypothesis testing using the Kruskall–Wallis test for those with non-normal behaviour, and an analysis of variances test (two-way ANOVA and Bonferroni test) for data with normal behaviour.
A linear relationship between Murphy's method and the 3D method was assessed using Pearson's test for normal values and Spearman's correlation coefficient for non-normal values. The same statistical rationale was used to evaluate the relationship between the traditional method and the 3D method.
The statistical data were analysed by an independent researcher with R-statistics version 3.5.2. The normality distribution of the data was studied using the Shapiro–Wilk test and a value β=.8 and a value α=.01 were considered for the sample calculation. A difference of 4° was established as clinically significant between measurements, in agreement with the variability published in previous series.6,10 The power of the statistical test would therefore be sufficient with a sample size of 30 patients.
ResultsThe interobserver agreement of the 3D method was high with only 1% of the measurements (2 measurements) outside the 95% CI interval (Bland–Altman test). The difference between measurements had non-normal behaviour (Shapiro Wilk p=.007), the median interobserver difference being .195 (interquartile range=[−1.13] to [2.85]).
Intra-observer agreement of the 3D method was high for both the first and second observers (ICC=.937 and ICC=.94, respectively). The discordance between measurements had normal behaviour (Shapiro Wilk p=.96), the mean of the differences being .13 (SD 2.21) and its median −0.17 (interquartile range [−1.3] to [1.24]). In the Bland–Altman plot, only three values were above the 95% CI limits (2%) (Fig. 3).
 Bland–Altman plot of the interobserver agreement of the 3D method. (3.2) Bland–Altman plot of intraobserver agreement. (3.3) Box and whisker plot of the mean intraobserver variability. In red the 95% confidence limits (mean±2DE). In deep violet, the clustering around the mean of 50% of the data and in light violet the clustering around the mean of 95% of the results.")
(3.1) Bland–Altman plot of the interobserver agreement of the 3D method. (3.2) Bland–Altman plot of intraobserver agreement. (3.3) Box and whisker plot of the mean intraobserver variability. In red the 95% confidence limits (mean±2DE). In deep violet, the clustering around the mean of 50% of the data and in light violet the clustering around the mean of 95% of the results.
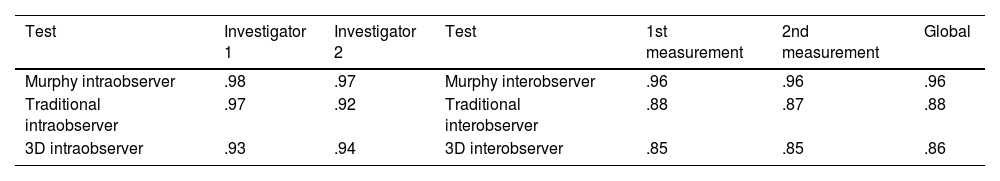
The intraobserver and interobserver agreement values of the three methods in our series are detailed in Table 1.
Intraclass correlation coefficients (ICC) with Murphy, traditional and 3D methods, and ICC for the different measurements.
| Test | Investigator 1 | Investigator 2 | Test | 1st measurement | 2nd measurement | Global |
|---|---|---|---|---|---|---|
| Murphy intraobserver | .98 | .97 | Murphy interobserver | .96 | .96 | .96 |
| Traditional intraobserver | .97 | .92 | Traditional interobserver | .88 | .87 | .88 |
| 3D intraobserver | .93 | .94 | 3D interobserver | .85 | .85 | .86 |
Left: The first radiologist had an agreement between the two Murphy measurements of .98 whereas the second radiologist had an agreement of .97. For the traditional method the agreement for the first investigator was .97 while for the second investigator it was .92.
Right: Thus, in the first measurement using the Murphy method, the agreement between the two radiologists was .96 and remained the same in the second measurement. For the conventional method, the interobserver agreement on the first attempt was .88 and .87 on the second attempt.
To assist understanding, the ICC values are shown in the table, although some of the data did not behave normally. The table is represented in this way, for a better understanding of the differences in agreement between methods, knowing their limitations.
The mean total femoral anteversion with the three methods in our series was 13.81 (SD 8.74, 95% CI 12.91–14.72, p<2.2e−1) and its behaviour was normal (Shapiro–Wilk p<.001). The mean femoral anteversion with the 3D method was 12.74 (SD 5.96, 95% CI 11.67–13.82, p<2.2e−16), with Murphy's method it was 15.87 (SD 10.68, 95% CI 13.94–17.80, p<2.2e−16), and with the traditional method it was 12.84 (SD 8.60, 95% CI 11.28–14.39, p<2.2e−16) (Fig. 4).
 Differences in femoral version measurements with the traditional method, the Murphy method, and the three-dimensional method. *Statistically significant differences. (4.2) Linear relationship between the traditional method and the 3D method. (4.3) Linear relationship between the Murphy method and the 3D method.")
(4.1) Differences in femoral version measurements with the traditional method, the Murphy method, and the three-dimensional method. *Statistically significant differences. (4.2) Linear relationship between the traditional method and the 3D method. (4.3) Linear relationship between the Murphy method and the 3D method.
The differences between Murphy's method and the 3D method were statistically significant, the mean of their differences was 3.12° (95% CI 1.59–4.66), and Murphy's method measurements were superior in magnitude. The same scenario was repeated with the traditional method, where there was a mean difference of 3.03 with Murphy's method ([95% CI −4.35 to −1.7], p<.001). There was no statistically significant difference between the magnitude of the measurements between the conventional method and the 3D method, with a mean difference between the two methods of .09 ([95% CI −.82 to 1.01], p=.84) (Fig. 4).
Linear regression analysis demonstrated a linear behaviour between the measurement of the traditional method and the 3D method (R-squared=.65, p<2.2e−16), this relationship being of lower intensity between the 3D method and Murphy's method (R-squared=.36, p=1.209e−13) (Fig. 4).
DiscussionThe 3D method of our study presents intra- and inter-observer reproducibility values similar to traditional anatomical methods that share anatomical references, such as Jeanmart's method,11 and lower than those of Murphy's method,12 based on axial sections at the base of the femoral neck and femoral head.
Since the advent of computed tomography in the 1970s, there has been a change in the concept of femoral anteversion, significantly improving accuracy in both diagnosis and treatment compared to previous radiographic and clinical methods.13 The methods of Reikerals,14 Weinert,15 or Jeanmart11 consider femoral torsion as the inclination of the femoral neck with respect to the femoral condyles, with different anatomical references to determine this inclination. However, the methods of Murphy,12 Hernández,16 Yoshioka,17 inter alia,6 define femoral anteversion according to the relative position of the femoral head with respect to the centre of an axial slice in the proximal femur, without following the anatomical axis of the femoral neck (Fig. 5).
 Axial section to define the transcondylar line. This is common to define the distal femoral reference in all methods. (B) Anteroposterior view of the region where the axial CT slice is taken to define the transcondylar line. (C) Oblique CT slices used to define the references in the Yoshioka (D, brown) and Jarrett (F, white) methods. These methods use two CT slices: one at the distal level (A) and one oblique at the proximal level. (D) CT slices used to define the references in the methods of Murphy (G, orange), Waidelich (H, red), Yoshioka (I, blue), and Hernandez (J, purple). All these methods draw the proximal reference line between two points: a point defined in the centre of the colour plane and a point in the centre of the femoral head (black line). All these methods use 3 CT slices: one at the distal level (A), and 2 at the proximal level (one at the centre of the femoral head (black line) and one at different levels depending on the method (coloured lines)). (K) Calculation of anteversion in Murphy")
(A) Axial section to define the transcondylar line. This is common to define the distal femoral reference in all methods. (B) Anteroposterior view of the region where the axial CT slice is taken to define the transcondylar line. (C) Oblique CT slices used to define the references in the Yoshioka (D, brown) and Jarrett (F, white) methods. These methods use two CT slices: one at the distal level (A) and one oblique at the proximal level. (D) CT slices used to define the references in the methods of Murphy (G, orange), Waidelich (H, red), Yoshioka (I, blue), and Hernandez (J, purple). All these methods draw the proximal reference line between two points: a point defined in the centre of the colour plane and a point in the centre of the femoral head (black line). All these methods use 3 CT slices: one at the distal level (A), and 2 at the proximal level (one at the centre of the femoral head (black line) and one at different levels depending on the method (coloured lines)). (K) Calculation of anteversion in Murphy's method, after combining figure (G) and figure (A). The rest of the methods would be used in a similar way.
The differences between methods are not uniform,7 and therefore depending on the method used, the osteotomy to be performed will be significantly different. With the emergence of new imaging technologies, measurement methods based on three-dimensional images have been described.18–22 The method described in the present work is the first that can be executed in any open-source 3D imaging programme, as it is based on a guide in .stl format. Therefore, it can be used in home 3D design programmes, such as 3D Builder (Microsoft Corporation®, Redmond, Washington, USA) or MeshMixer (Autodesk®, San Rafael, California, USA), which are widely used in inpatient orthopaedic surgery.23–25
Intraoperative reproducibility of the planned osteotomy is essential, as discrepancies of up to 25° have been reported when performing one same osteotomy as well as iatrogenic deformities secondary to poor intraoperative reproduction of this correction technique.26,27 The preoperative design of osteotomies and their measurement using the proposed method is a gateway to the application of new techniques for planning and intraoperative reproduction of this technique, for example, through the use of customised cutting block guides or computerised assistance systems.23
These programmes allow the simulation of osteotomies in any plane (video 2), single or multiple, and therefore the ability to measure femoral torsion in a 3D design scenario allows us to estimate the effect of any given osteotomy on femoral torsion. The consequence of measuring in a 3D scenario should be an increase in intra- and interobserver variability compared to the 2D methods of Jeanmart and Murphy, since in a 3D scenario the options are multiplied for establishing the line of measurement of the femoral neck. However, the described guide allows for reproducible positioning and is an efficient way to reduce the variability associated with manual measurement in a 3D scenario.
Our data allow us to define normal values in a healthy population with the described method, the confidence interval of the normal data being lower than those obtained with the Murphy method and the traditional Jeanmart method (Fig. 4). The correlation with Jeanmart's method is higher than with Murphy's method, because it shares with the former the anatomical references that define femoral torsion. This explains why the intra- and interobserver agreement is similar with the Jeanmart method and slightly lower with the Murphy method; the intraclass correlation coefficient is high in all three methods.
LimitationsThe main limitation of this method is the need for a 3D image of the patient's lower limb, which increases the cost of the preoperative study. Furthermore, if the 3D volume is obtained from a CT image, it considerably increases the ionising radiation required for the preoperative study, especially in a young population. Finally, preoperative planning following this methodology requires more time, which makes the preoperative study more expensive.
It would be possible to evaluate in future studies the reliability of the method by obtaining three-dimensional images from the segmentation of nuclear magnetic resonance images, thus reducing the ionising radiation required for surgical planning. Increasing the sample size and using the method in patients with torsional dysfunction would be useful to establish the correlation between the correction planned with the present method and the correction achieved. The use of intraoperative cutting and correction guides should increase the accuracy of the technique, which are easy to obtain in the 3D design programmes proposed in this study.
Level of evidenceLevel of evidence III.
Conflict of interestsThe authors have no conflict of interests to declare.
