
The aim of this work is to determine whether the accounting information provided by construction and real estate firms in Spain reflects the real economic activity, during upswings and downturns. A relationship is found between economic conditions and financial reporting in a continental European country such as Spain. Although there is a relationship between real housing price growth and financial accounting measures, real estate companies seem to show an artificial position, since they only present a relationship with Return on Assets (ROA) based on low quality income (accruals). Therefore, a different financial position influences a different behaviour in these two similar sectors. In fact, some signs alerting of possible risk in real estate firms are shown.
El objetivo de este trabajo es analizar si la información financiera de las empresas constructoras e inmobiliarias refleja la realidad económica, tanto en épocas de bonanza como en épocas de crisis. Los resultados muestran que existe relación entre la situación económica real y la información financiera de las empresas. Aunque hay relación entre el crecimiento real del precio de la vivienda y las variables contables, las empresas inmobiliarias parecen mostrar una situación artificial, dado que solo presentan relación con la variable rentabilidad económica, la cual está basada en resultados de baja calidad (devengos). Por consiguiente, estos 2 sectores similares que se encuentran en una posición financiera diferente se comportan también de forma diferente. Este trabajo evidencia algunos signos de alerta sobre el riesgo existente en las empresas inmobiliarias.
The research interest in the study of economic cycles has increased recently due to consecutive international economic crises and downturns (Bertomeu & Magee, 2011; Callao & Jarne, 2011). However, the revision of previous literature reveals a lack of studies focused on the relationship between macroeconomic conditions and firms’ accounting information. Only a few papers (Brown and Ball, 1967 and Guenther & Young, 2000) have investigated the effects of macroeconomic features on firms accounting information. Our main purpose is to fill this gap by analysing the relationship between real economic activity and the main economic and financial measures.
The economic crisis and the influence that construction activity has on the world economy and, particularly, on the Spanish economy, make it interesting to focus this paper on both construction and real estate firms. Construction activity is responsible for an important part of the economic growth in the last decade in Spain, Europe and America. Most of the American downturns since World War II were preceded by substantial problems in housing (Leamer, 2007). In Spain, according to Seopan (2008) between 1996 and 2007 the gross added value associated with the construction industry grew at an average rate of more than 5%, although 2007 was the last year of a very long phase of expansion. Even during 2007, the gross added value, directly and indirectly associated with this sector, was 18.6% of GDP (Gross Domestic Product). Furthermore, 20% of employment was attributed to this industry. Ayuso and Restoy (2007) highlight the important role played by the housing market during recent years, as it was an indicator of the general prospects of many industrialised economies. Consequently, we study construction and real estate firms in Spain during a period characterised by economic downturns and upswings. Thus, our time period allows us to cover the last year of a crisis (1996), an upswing period that includes a bubble, and the beginning of the current crisis (2007).
Since economic and financial structures are different between construction and real estate companies (Gill & Giner, 2013), our paper analyses the effects of macroeconomic factors separately for each industry. Furthermore, depending on the stage of the cycle, firms may behave in a different manner. Johnson (1999) concludes that earnings response coefficients are larger in expansions (credit crunch periods) than in recessions (reliquification periods). All this can lead to different practices of earnings management, which may mislead financial reporting users.
This research is of interest due to several reasons. First, studies that consider the relationship between economic activity and companies’ financial reporting are scarce. In addition, we use several proxies for economic activity and a set of accounting variables. Second, this paper focuses on firms related to construction activity, which is one of the mainstays of the Spanish economy, as well as an indicator of the economic prospects. Furthermore, we analyse a continental European accounting country such as Spain; studies on non-Anglo-Saxons countries are less frequent in the accounting literature. Third, in studying two similar sectors devoted to construction activity, their economic conditions should be similar and, consequently, their behaviour too. However, a different economic and financial structure may result in a different behaviour. Therefore, we will be able to gain insight into this issue, by studying why they behave in a particular manner. Fourth, in order to study the strategies in terms of earning management, this research presents a broad view, since it also takes into account estimations of “real earnings management”. This methodology has not been applied to Spanish data so far. In sum, this paper provides empirical evidence to understand why the general economic development was not reflected in some financial indicators before the crisis in the property sector, and supports the importance of a contextual analysis of financial statement information. Our results are useful for several economic agents including lenders and creditors, since they allow these agents to identify the behaviour of construction and real estate firms in Spain during economic downturns and upswings. In fact, our conclusions may be interesting in order to achieve an appropriate business risk evaluation.
The remaining sections of the paper are organised as follows: Section 2 presents the background and the research questions, where the effect of real economic activity on accounting information is highlighted; Section 3 describes the methodology used in this analysis, which includes the sample characteristics, and the variables; Section 4 reports the main results and Section 5 concludes the paper.
2Economic activity and accounting information. Research questionsPrevious research, although scarce, indicates that there is a relationship between economic activity and firms’ accounting variables. Ball and Brown (1967) studied the association between the earnings of an individual firm, the earnings of other firms in its industry and the earnings of all firms in the economy. They find that 35–40 percent of the variation of annual earnings can be associated with the variation of all firms’ earnings, whereas a 10–15 percent can be associated with the industry average. Since then, little research has dealt with the relationship between economic conditions and firm accounting information.
Guenther and Young (2000) found that because of institutional differences, this relationship may vary across countries. They provide evidence of a strong relationship between earnings and the underlying economic reality in Anglo-Saxon countries. While in continental European countries there are incentives to reduce earnings volatility, in Anglo-Saxons countries the main aim is to satisfy shareholders’ needs in order to decrease information asymmetry in relation to managers. Johnson (1999) studied the earnings persistence through the business cycle considering 53,324 quarterly earnings announcements in the seventies for American firms. He concluded that earnings persistence is lower in recessions than in expansions (when investment opportunities are high). The importance of analysing the accruals and cash flow components of earnings has been traditionally studied by the accounting literature (Sloan, 1996). Underlying this interest is that accruals are less likely to recur in the future. Along the same lines, Bernstein (1993) indicates that the accrual system involves higher degrees of subjectivity than the determination of cash flow; in other words, “a company with a high level of net income and a low cash flow may be using income recognition or expense accruals criteria that are suspect”. Finally, Trombetta and Imperatore (2014) considering a sample composed of 5.964 U.S. listed companies during the years 1996–2011 concluded that it is important to take into account if the firms are suffering a situation of financial distress when analysing the relationship between business cycle and accounting information characteristics; in this sense, they indicate that the dynamics of financial crises and business cycles do not fully overlap. These authors found that as the financial crisis becomes more intense, managers are more willing to engage in earnings management practices.
We study Spain, a code-law country and both listed and non-listed firms related to Spanish construction activity. These two characteristics can influence the relationship between accounting features and real economic activity. Spain is a code-law and bank-oriented country where information asymmetry problems are solved through insider communication. This fact can lead to a lower demand for disclosure, which can result in a weaker relationship between accounting measures and real economic activity. This relationship may be weaker in the case of non-listed firms. Burgstahler, Hail, and Leuz (2006) indicated that earning management is more pervasive in private firms than in public firms. Even other studies (Arnedo, Lizarraga, & Sánchez, 2007; Coppens & Peek, 2005) find that income decreasing actions are associated with private companies.
Although previous research indicates that accounting variables and economic activity move together (Jin, 2005), several research questions are posed:
- -
Is a general measure of economic activity appropriate for all sectors?
- -
What role do housing prices play in the business cycle of construction activity?
- -
Do construction and real estate firms behave similarly?
- -
Does the behaviour of firms change during downturns and upswings?
Economic growth represents the real economic activity of a country. As indicated by Guenther and Young (2000) GDP is the most comprehensive measure of a country's economic activity, since it comprises the total market value of all final goods and services produced in a country in a year. We use real GDP growth rate, that is, the percentage change in GDP measured in constant prices.
However, certain industries may have special characteristics that do not fit well with GDP. Construction activity is one of the most strongly cyclical activities, growing more than average during upswings and contracting more during downturns. In addition, the housing cycle lags behind the general business cycle, since the building period in Spain may last between 18 and 24 months (Seopan, 2008) and, therefore, a change in the general situation takes a certain time to affect construction sector. Prices usually depend on the law of supply and demand and, consequently, house prices should be related to economic activity (Girouard & Blöndal, 2001).
Construction and real estate firms should be similarly affected by house prices and general economic growth. In fact, the activity of real estate firms and more than 75% of construction firms is focused on buildings. Therefore, when housing prices grow, both construction and real estate companies should benefit from an increased demand. However, a notable difference is that while economic growth is based on real transactions of goods and services, house prices may reflect a speculative situation rather than real fluctuations in economic activity. The OECD (2005) notes that although house-price and business-cycle turning points roughly coincided from 1970 to 2000, the housing price boom is strikingly out of step with the business cycle; specifically, prices are overvalued in Spain, as well as in the United Kingdom and Ireland.
Finally, economic conditions may affect firms’ financial position. In Spain, mainly real estate firms, bought land at high prices during the bubble. This fact brought about an increasing indebtedness. As indicated by Penman (2003), bubble periods create unreasonable expectations and managers make misguided consumption and investment decision; in the end, debt burdens become intolerable. Spanish firms that carried out property development activity could be affected by this circumstance. Specifically, Gill, Fernández, Giner, and Martínez (2010) indicated that, during the bubble phase, real estate companies increased significantly both their financial and their operational risk. In this period, land stock increased considerably at the same time as land prices grew substantially above housing prices. This situation was able to bring about a huge deficit between cash flow from operations and funds invested, which was covered with external financing. Thus, there is evidence of a different economic and financial structure between construction and real estate companies, which even advises to use industry-focused models to predict corporate failure (Gill & Giner, 2013). All these circumstances may influence not only the behaviour during downturns and upswings, but also a different behaviour between construction and real estate firms.
3Research designSimilar to Guenther and Young (2000), we use Pearson correlation coefficients, examining correlations between several financial accounting indicators (Return on assets (ROA), cash-flow, accruals, leverage and earnings management, and different proxies for economic activity). We agree with Guenther and Young (2000) that GDP growth rate, measured in real terms, can be the most comprehensive measure of economic activity. However, the special characteristics of construction activity lead us to think that the proxy growth in house prices may also be appropriate. Consequently, we have also used housing price growth in real terms, as a proxy for the underlying economic situation. In Spain, different entities publish data on the real estate market. The Appraisal Society presents a statistic about the evolution of the price of the new housing in Spain (hereafter PVST), while the Housing Ministry provides data on the housing price considering all the appraisals (new and old buildings) made in Spain (hereafter PVMV).
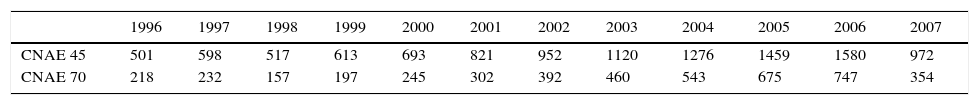
3.1SampleThe sample is obtained from SABI database, covers the period 1996–2007, and is composed of 11,102 firm-year observations for construction firms (Codigo Nacional de Actividades Económicas CNAE 45) and 4522 firm-year observations for real estate firms (CNAE 70) (Table 1).
During this period, there was never negative growth in GDP. The year 1996 was the one with the lowest growth (GDP: 2.4%) (Fig. 1). Construction activity behaved differently. The last recession took place from 1991 to 1996, which was followed by an upswing period (Rodríguez, 2006). This bonanza period included real growth rates in housing prices around 15%. Therefore, this paper covers three key moments:
- -
The final year of a crisis period (1996).
- -
An upswing period, including a speculative bubble.
- -
The beginning of the current crisis (2007).
; PVST: Housing price growth in real terms according to the Appraisal Society (Sociedad de Tasación).")
GDP and real housing price growth during the period 1996–2007. GDP: Gross Domestic Product growth in real terms; PVMV: Housing price growth in real terms according to the Housing Ministry (Ministerio de la Vivienda); PVST: Housing price growth in real terms according to the Appraisal Society (Sociedad de Tasación).
In order to study the existence of and trends in earnings management, we use the discretionary accruals methodology and, following Roychowdhury (2006), we also estimate “real earnings management”.
3.2.1Discretionary accrualsOne way to alter the earnings of a firm is to manipulate the timing of revenues and expenses. The most widely used model in the literature to estimate discretionary accruals is the Jones Model (1991). Jones’ proposition postulates that non-discretionary accruals depend on the firm's economic situation. However, this model has been criticised due to the fact that firms with extreme levels of performance are more likely to report misspecified, unexpected accruals estimated by the Jones Model (Dechow, Sloan, & Sweeney, 1995, Shivakumar, 1996).
In order to mitigate problems, and following Chan, Jegadeesh, and Sougiannis (2004) who indicate that the Jones Cash Flow model is a better model for detecting earnings management than the Jones model, we first estimate discretionary accruals by using the Jones Cash Flow Model (Eq. (1)):
where TAit: total accruals of firm i for the year t, defined as the change in non-cash current assets minus the change in current liabilities excluding short-term debt, minus depreciation and amortisation. Ait−1: total assets of firm i at the beginning of year t. ΔSALESit: Change in annual revenues of firm i in year t. NCASSETSit: Level of gross non-current assets of firm i in year t. CFOit: Cash flow from the operations of firm i in year t, calculated as the difference between the ordinary income before taxes and the total accruals TAit. ¿it: error terms in the different expressions.
Then, following Kasznik (1999), we control for measurement errors using a performance adjusted method. We rank the discretionary accruals into percentile groups by their return on assets, assuming that the median discretionary accrual for each percentile group reflects measurement error. We then subtract the median from each unadjusted discretionary accrual in that percentile. Therefore, the proxy for discretionary accruals is the difference between the original discretionary accruals and the median discretionary accruals for each percentile.
3.2.2. Real earnings managementSeveral authors indicate that firms may make decisions that influence their ordinary activity in order to alter their level of earnings (Dechow & Skinner, 2000; Healy and Wahlen, 1999). However, “real actions” have not received as much attention as accruals management. Papers by Roychowdhury (2006) and Cohen, Dey, and Lys (2008) analyse real earnings practices and their relationship with discretionary accruals. In this paper, we consider these practices by studying (1) abnormal levels of cash flow from the operations (CFO), (2) abnormal levels of production costs, and (3) abnormal levels of discretionary expenses.
The normal level of cash flow from operations is a linear function of sales and change in sales (Eq. (2)). This equation is estimated for each activity sector and year, to obtain the abnormal CFO as the residual values (R_CFO).
where CFOit is the cash flow from the operations of firm i in year t, calculated as the difference between the ordinary income before taxes and the total accruals TAit. πit is the error term.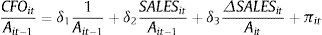
Following Cohen et al. (2008), normal levels of production costs depend on the level of sales and change in sales in the current year and the previous year (Eq. (3)). The estimations are cross-sectional, distinguishing activity sector and year. The residual values from the estimations are the proxies for the abnormal levels of production costs (R_PROCOST).
where PROCOSTit is the production cost of firm i in year t. This variable is understood as the cost of sold goods plus change in inventories during the year. π′it is the error term.
Finally, discretionary expenses are a function of one-year lagged sales (Eq. (4)) (Cohen et al., 2008). The estimations are cross-sectional, distinguishing activity sector and year. The residuals from the estimations are the proxies for the abnormal levels of discretionary expenses (R_DEXPE).
where DEXPEit is the proxy for discretionary expenses of firm i in year t. The information included in the section “Other operating expenses” in the profit and loss account is used as the proxy for discretionary expenses. π″ is the error term.4Results4.1Descriptive statistics and relationships among macroeconomic variables
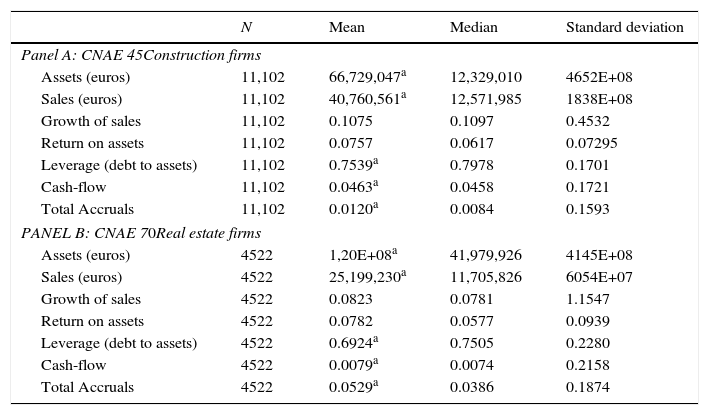
Table 2 presents descriptive statistics of construction and real estate firms. Leverage has barely changed for construction firms during the study period, but increases strongly for real estate companies (from 62% to 71.2%). However, accruals are higher in real estate firms. In fact, if we analyse jointly ROA, cash flow and total accruals, we can observe that while construction and real estate firms have similar ROA, the cash flow is significantly higher for construction companies, at the same time as total accruals are much lower. These findings imply that construction firms are more able than real estate firms to generate earnings.
Descriptives.
| N | Mean | Median | Standard deviation | |
|---|---|---|---|---|
| Panel A: CNAE 45Construction firms | ||||
| Assets (euros) | 11,102 | 66,729,047a | 12,329,010 | 4652E+08 |
| Sales (euros) | 11,102 | 40,760,561a | 12,571,985 | 1838E+08 |
| Growth of sales | 11,102 | 0.1075 | 0.1097 | 0.4532 |
| Return on assets | 11,102 | 0.0757 | 0.0617 | 0.07295 |
| Leverage (debt to assets) | 11,102 | 0.7539a | 0.7978 | 0.1701 |
| Cash-flow | 11,102 | 0.0463a | 0.0458 | 0.1721 |
| Total Accruals | 11,102 | 0.0120a | 0.0084 | 0.1593 |
| PANEL B: CNAE 70Real estate firms | ||||
| Assets (euros) | 4522 | 1,20E+08a | 41,979,926 | 4145E+08 |
| Sales (euros) | 4522 | 25,199,230a | 11,705,826 | 6054E+07 |
| Growth of sales | 4522 | 0.0823 | 0.0781 | 1.1547 |
| Return on assets | 4522 | 0.0782 | 0.0577 | 0.0939 |
| Leverage (debt to assets) | 4522 | 0.6924a | 0.7505 | 0.2280 |
| Cash-flow | 4522 | 0.0079a | 0.0074 | 0.2158 |
| Total Accruals | 4522 | 0.0529a | 0.0386 | 0.1874 |
Regarding the macroeconomic variables, Fig. 1 provides evidence of a strong and negative association between GDP and real housing price growth. The correlation between GDP growth and PVMV is −0.517, while the correlation between GDP growth and PVST is −0.141. This situation is based on 3 aspects:
- -
In 1996, the housing market was still in crisis, with prices even decreasing at the same time as GDP continued to grow.
- -
During 2001–2002, GDP growth slowed down, whereas real housing prices increased significantly.
- -
From 2004 onwards, real housing prices slowed down, whereas GDP only started to slow down in 2007.
In general terms, we should expect a different relationship between economic activity indicators and macroeconomic variables depending on the perspective analysed (GDP or housing prices).
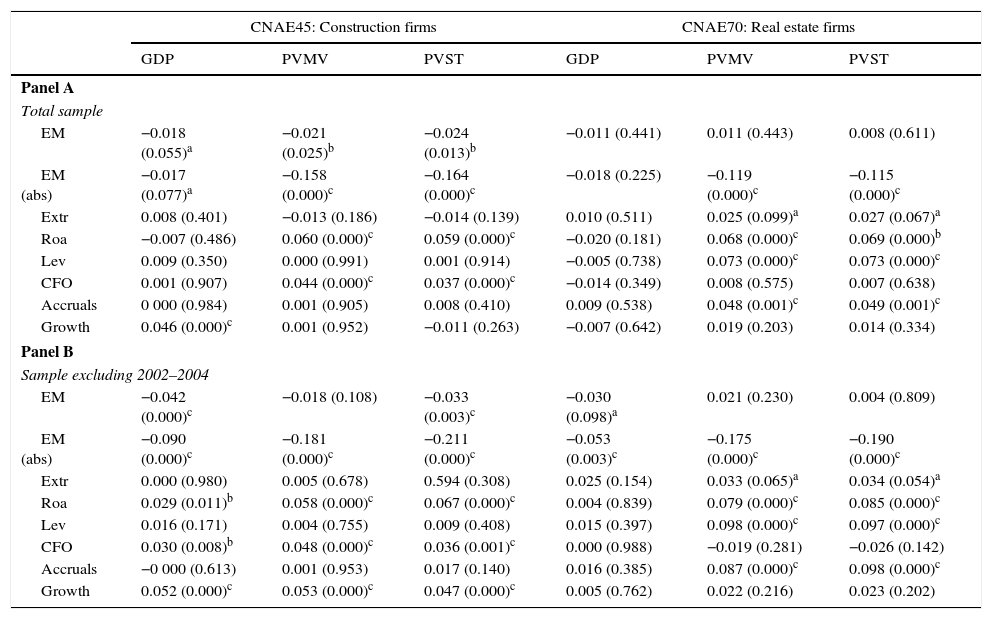
4.2Relationships between financial accounting measures and macroeconomic variablesTable 3 presents correlations between financial accounting and macroeconomic variables. There is not a clear relationship between GDP growth and financial accounting measures. Only sales growth reveals a positive relationship with GDP growth in construction companies. This fact can be explained because GDP grew more when the housing market began to move beyond the crisis. There is also a weak, but significant, negative relationship between GDP growth rate and earnings management. For real estate companies, no financial indicator is significantly related to GDP growth.
Correlations between financial measures and macroeconomic variables.
| CNAE45: Construction firms | CNAE70: Real estate firms | |||||
|---|---|---|---|---|---|---|
| GDP | PVMV | PVST | GDP | PVMV | PVST | |
| Panel A | ||||||
| Total sample | ||||||
| EM | −0.018 (0.055)a | −0.021 (0.025)b | −0.024 (0.013)b | −0.011 (0.441) | 0.011 (0.443) | 0.008 (0.611) |
| EM (abs) | −0.017 (0.077)a | −0.158 (0.000)c | −0.164 (0.000)c | −0.018 (0.225) | −0.119 (0.000)c | −0.115 (0.000)c |
| Extr | 0.008 (0.401) | −0.013 (0.186) | −0.014 (0.139) | 0.010 (0.511) | 0.025 (0.099)a | 0.027 (0.067)a |
| Roa | −0.007 (0.486) | 0.060 (0.000)c | 0.059 (0.000)c | −0.020 (0.181) | 0.068 (0.000)c | 0.069 (0.000)b |
| Lev | 0.009 (0.350) | 0.000 (0.991) | 0.001 (0.914) | −0.005 (0.738) | 0.073 (0.000)c | 0.073 (0.000)c |
| CFO | 0.001 (0.907) | 0.044 (0.000)c | 0.037 (0.000)c | −0.014 (0.349) | 0.008 (0.575) | 0.007 (0.638) |
| Accruals | 0 000 (0.984) | 0.001 (0.905) | 0.008 (0.410) | 0.009 (0.538) | 0.048 (0.001)c | 0.049 (0.001)c |
| Growth | 0.046 (0.000)c | 0.001 (0.952) | −0.011 (0.263) | −0.007 (0.642) | 0.019 (0.203) | 0.014 (0.334) |
| Panel B | ||||||
| Sample excluding 2002–2004 | ||||||
| EM | −0.042 (0.000)c | −0.018 (0.108) | −0.033 (0.003)c | −0.030 (0.098)a | 0.021 (0.230) | 0.004 (0.809) |
| EM (abs) | −0.090 (0.000)c | −0.181 (0.000)c | −0.211 (0.000)c | −0.053 (0.003)c | −0.175 (0.000)c | −0.190 (0.000)c |
| Extr | 0.000 (0.980) | 0.005 (0.678) | 0.594 (0.308) | 0.025 (0.154) | 0.033 (0.065)a | 0.034 (0.054)a |
| Roa | 0.029 (0.011)b | 0.058 (0.000)c | 0.067 (0.000)c | 0.004 (0.839) | 0.079 (0.000)c | 0.085 (0.000)c |
| Lev | 0.016 (0.171) | 0.004 (0.755) | 0.009 (0.408) | 0.015 (0.397) | 0.098 (0.000)c | 0.097 (0.000)c |
| CFO | 0.030 (0.008)b | 0.048 (0.000)c | 0.036 (0.001)c | 0.000 (0.988) | −0.019 (0.281) | −0.026 (0.142) |
| Accruals | −0 000 (0.613) | 0.001 (0.953) | 0.017 (0.140) | 0.016 (0.385) | 0.087 (0.000)c | 0.098 (0.000)c |
| Growth | 0.052 (0.000)c | 0.053 (0.000)c | 0.047 (0.000)c | 0.005 (0.762) | 0.022 (0.216) | 0.023 (0.202) |
Notes: GDP: Gross Domestic Product growth in real terms; PVMV: housing price growth in real terms according to the Housing Ministry (Ministerio de la Vivienda); PVST: housing price growth in real terms according to the Appraisal Society (Sociedad de Tasación); EM: discretionary accruals; EM (abs): absolute value of discretionary accruals; Extr: extraordinary results deflated by average total assets; ROA: earnings before interest and taxes over average total assets; Lev: debt to total assets; CFO: cash-flow deflated by average total assets; Accruals: total accruals deflated by average total assets; Growth: change in logarithm of sales.
However, we find a significant relationship between real housing price growth and financial accounting measures. In both construction and real estate firms, we can observe a significant relationship between real housing price growth and ROA, and between real housing price growth and earnings management. That is, when housing prices are high, ROA is also high, whereas earnings management is lower.
In Table 3 Panel B, the previous correlations are showed excluding the years in which real housing prices rose over 10% (2002–2004). The results change especially for construction firms, which exhibit further significant correlations between GDP growth and some accounting measures such as profitability and sales growth. These findings give evidence about the influence of the pricing bubble on the capacity of the accounting information to reflect the real economic activity of construction firms. In the case of real estate firms, the correlations do not change significantly, which raises questions as to whether financial reporting of this type of firm reflects the real economic activity.
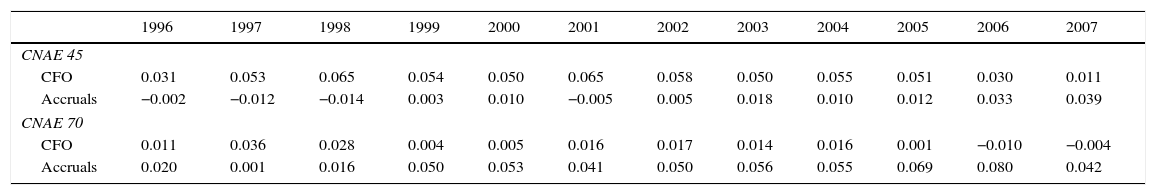
Thus, we can find specific characteristic for each sector. Construction companies present a positive relationship between PVMV/PVST and CFO. However, the results for real estate companies show a strong correlation between real housing price growth (PVMV and PVST) and both accruals and leverage. Therefore, as the bubble develops, CFO increased in construction firms, while real estate companies increased accruals. We can observe in Table 4 that, until 2005, the main component of earnings was CFO for construction firms. However, for real estate firms, starting in 1999, accruals are much higher than CFO, to the extent that CFO becomes negative from 2006 on. As indicated by Dechow, Ge, and Schrand (2010) (pp. 354), “when earnings are composed predominantly of accruals, they will be less persistent than when earnings are composed predominantly of cash flows”. This fact together with the increasing real estate companies’ leverage lead us to think that economic position of these firms was weaker than that of construction enterprises. Gill et al. (2010) indicate that the growth of real estate companies was basically due to a speculative behaviour in the sector. Specifically, they found that this behaviour was based on increasing the gross profit margin through land and work in progress inventories. Thus, it is likely that both CFO and sales growth were not associated with housing prices since the profitability of this sector was, to a certain extent, artificially obtained by accruals. Accordingly, we also find that the correlation between extraordinary items and the housing price growth rate is positive and significant.
Roa, CFO and accruals distribution (mean values) by year and economic activity.
| 1996 | 1997 | 1998 | 1999 | 2000 | 2001 | 2002 | 2003 | 2004 | 2005 | 2006 | 2007 | |
|---|---|---|---|---|---|---|---|---|---|---|---|---|
| CNAE 45 | ||||||||||||
| CFO | 0.031 | 0.053 | 0.065 | 0.054 | 0.050 | 0.065 | 0.058 | 0.050 | 0.055 | 0.051 | 0.030 | 0.011 |
| Accruals | −0.002 | −0.012 | −0.014 | 0.003 | 0.010 | −0.005 | 0.005 | 0.018 | 0.010 | 0.012 | 0.033 | 0.039 |
| CNAE 70 | ||||||||||||
| CFO | 0.011 | 0.036 | 0.028 | 0.004 | 0.005 | 0.016 | 0.017 | 0.014 | 0.016 | 0.001 | −0.010 | −0.004 |
| Accruals | 0.020 | 0.001 | 0.016 | 0.050 | 0.053 | 0.041 | 0.050 | 0.056 | 0.055 | 0.069 | 0.080 | 0.042 |
Notes: CNAE45: Construction firms; CNAE 70: Real estate firms.
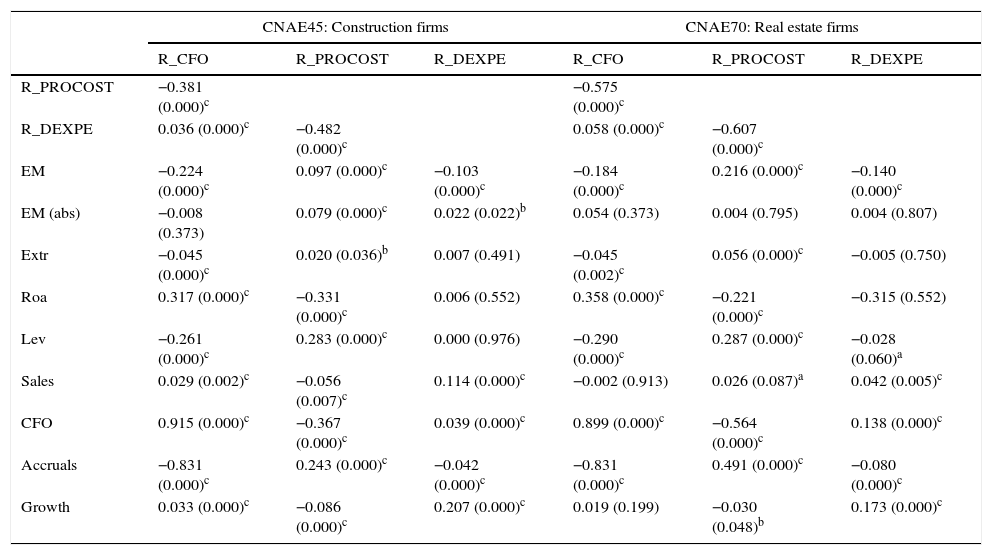
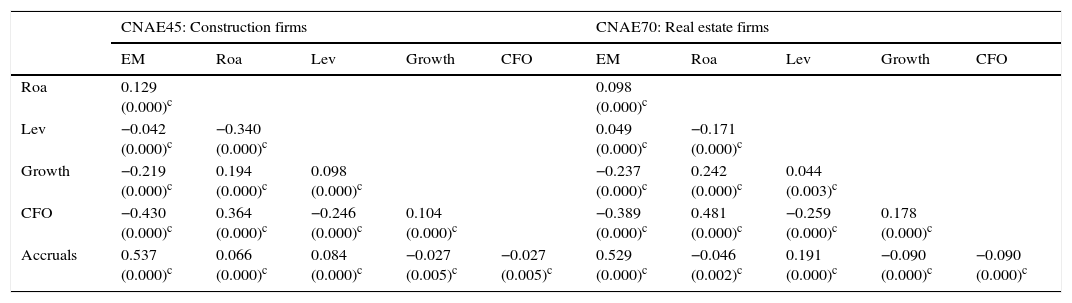
The correlations between real earnings management and the financial accounting measures are quite similar for both construction and real estate firms (Table 5).
Correlations between “real earnings management” and financial measures.
| CNAE45: Construction firms | CNAE70: Real estate firms | |||||
|---|---|---|---|---|---|---|
| R_CFO | R_PROCOST | R_DEXPE | R_CFO | R_PROCOST | R_DEXPE | |
| R_PROCOST | −0.381 (0.000)c | −0.575 (0.000)c | ||||
| R_DEXPE | 0.036 (0.000)c | −0.482 (0.000)c | 0.058 (0.000)c | −0.607 (0.000)c | ||
| EM | −0.224 (0.000)c | 0.097 (0.000)c | −0.103 (0.000)c | −0.184 (0.000)c | 0.216 (0.000)c | −0.140 (0.000)c |
| EM (abs) | −0.008 (0.373) | 0.079 (0.000)c | 0.022 (0.022)b | 0.054 (0.373) | 0.004 (0.795) | 0.004 (0.807) |
| Extr | −0.045 (0.000)c | 0.020 (0.036)b | 0.007 (0.491) | −0.045 (0.002)c | 0.056 (0.000)c | −0.005 (0.750) |
| Roa | 0.317 (0.000)c | −0.331 (0.000)c | 0.006 (0.552) | 0.358 (0.000)c | −0.221 (0.000)c | −0.315 (0.552) |
| Lev | −0.261 (0.000)c | 0.283 (0.000)c | 0.000 (0.976) | −0.290 (0.000)c | 0.287 (0.000)c | −0.028 (0.060)a |
| Sales | 0.029 (0.002)c | −0.056 (0.007)c | 0.114 (0.000)c | −0.002 (0.913) | 0.026 (0.087)a | 0.042 (0.005)c |
| CFO | 0.915 (0.000)c | −0.367 (0.000)c | 0.039 (0.000)c | 0.899 (0.000)c | −0.564 (0.000)c | 0.138 (0.000)c |
| Accruals | −0.831 (0.000)c | 0.243 (0.000)c | −0.042 (0.000)c | −0.831 (0.000)c | 0.491 (0.000)c | −0.080 (0.000)c |
| Growth | 0.033 (0.000)c | −0.086 (0.000)c | 0.207 (0.000)c | 0.019 (0.199) | −0.030 (0.048)b | 0.173 (0.000)c |
R_CFO: abnormal cash flow; R_PROCOST: abnormal production costs; R_DEXPE: abnormal operating expenses.
Consistent with prior studies, abnormal accruals show a positive correlation with R_PROCOST and a negative correlation with R_CFO. These results may indicate an overproduction strategy directed towards increasing earnings. In fact, abnormal production costs have a negative relationship with abnormal CFO. Thus, overproduction has a positive effect on abnormal accruals and a negative effect on abnormal CFO (Roychowdhury, 2006). Likewise, both high leverage and extraordinary items are accompanied by real earnings management practices aimed at increasing earnings. For both types of companies, the correlation between the level of leverage and abnormal production costs is positive, and the correlation between extraordinary items and abnormal production costs is also positive. We also find that the relationship between real earnings management and several performance measures (ROA, cash flow and growth of sales) is as expected, that is, real earnings management increases when performance decreases.
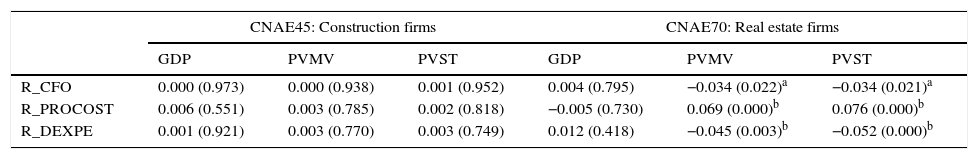
Table 6 shows the relationship between real earnings management and economic activity indicators. For construction companies, we do not find any relationship between them, but real estate companies exhibit negative correlations between real housing price growth (PVMV and PVST) and abnormal CFO, as well as between real housing price growth and abnormal discretionary expenses. However, the relationship is positive with abnormal production costs. All these results indicate the intention of improving income when housing price growth increases. No relationship is found between real earnings management and GDP growth rate.
Correlations among “real earnings management” and macroeconomic variables.
| CNAE45: Construction firms | CNAE70: Real estate firms | |||||
|---|---|---|---|---|---|---|
| GDP | PVMV | PVST | GDP | PVMV | PVST | |
| R_CFO | 0.000 (0.973) | 0.000 (0.938) | 0.001 (0.952) | 0.004 (0.795) | −0.034 (0.022)a | −0.034 (0.021)a |
| R_PROCOST | 0.006 (0.551) | 0.003 (0.785) | 0.002 (0.818) | −0.005 (0.730) | 0.069 (0.000)b | 0.076 (0.000)b |
| R_DEXPE | 0.001 (0.921) | 0.003 (0.770) | 0.003 (0.749) | 0.012 (0.418) | −0.045 (0.003)b | −0.052 (0.000)b |
Overall, these results reveal that construction and real estate firms have different strategies in relation to real earnings management. While construction firms do not use real earnings management significantly, real estate companies use them to improve their income as the bubble develops. This finding indicates an apparently aggressive accounting policy applied by real estate firms.
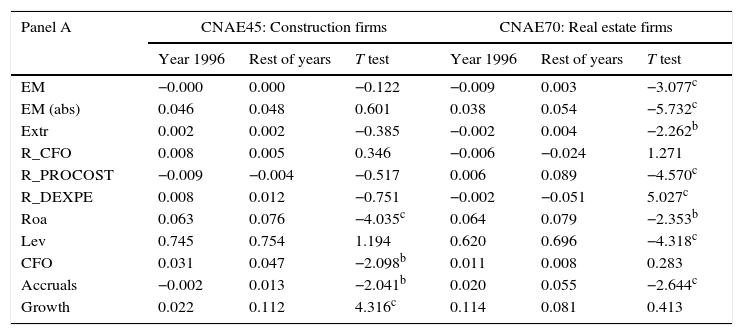
4.4Financial accounting measures and earnings management variables in economic downturnsFig. 1 indicates that during 1996 there was a decrease in both the new housing price and the overall housing price (new and old buildings). Similarly, Fig. 1 shows that in 2007 the bonanza period ended. Table 7 shows the financial accounting measures of interest in this paper during two recession years: 1996 as last year of crisis, and 2007 as the beginning of a downturn. To this end, we apply mean difference tests comparing the accounting information associated with the economic downturn with the rest of the years (economic upswing).
Financial measures during economic downturns (1996 & 2007).
| Panel A | CNAE45: Construction firms | CNAE70: Real estate firms | ||||
|---|---|---|---|---|---|---|
| Year 1996 | Rest of years | T test | Year 1996 | Rest of years | T test | |
| EM | −0.000 | 0.000 | −0.122 | −0.009 | 0.003 | −3.077c |
| EM (abs) | 0.046 | 0.048 | 0.601 | 0.038 | 0.054 | −5.732c |
| Extr | 0.002 | 0.002 | −0.385 | −0.002 | 0.004 | −2.262b |
| R_CFO | 0.008 | 0.005 | 0.346 | −0.006 | −0.024 | 1.271 |
| R_PROCOST | −0.009 | −0.004 | −0.517 | 0.006 | 0.089 | −4.570c |
| R_DEXPE | 0.008 | 0.012 | −0.751 | −0.002 | −0.051 | 5.027c |
| Roa | 0.063 | 0.076 | −4.035c | 0.064 | 0.079 | −2.353b |
| Lev | 0.745 | 0.754 | 1.194 | 0.620 | 0.696 | −4.318c |
| CFO | 0.031 | 0.047 | −2.098b | 0.011 | 0.008 | 0.283 |
| Accruals | −0.002 | 0.013 | −2.041b | 0.020 | 0.055 | −2.644c |
| Growth | 0.022 | 0.112 | 4.316c | 0.114 | 0.081 | 0.413 |
| Panel B | CNAE45: Construction firms | CNAE70: Real estate firms | ||||
|---|---|---|---|---|---|---|
| Year 2007 | Rest of years | T test | Year 2007 | Rest of years | T test | |
| EM | 0.015 | −0.001 | 2.780c | 0.025 | 0.000 | 2.624c |
| EM (abs) | 0.125 | 0.040 | 21.393c | 0.127 | 0.047 | 12.101c |
| Extr | 0.003 | 0.002 | 0.342 | 0.003 | 0.004 | −0.543 |
| R_CFO | 0.003 | 0.006 | −0.708 | −0.008 | −0.024 | 1.992b |
| R_PROCOST | −0.008 | −0.004 | −0.794 | 0.087 | 0.084 | 0.174 |
| R_DEXPE | 0.012 | 0.012 | −0.073 | −0.076 | −0.046 | −2.488b |
| Roa | 0.068 | 0.077 | −4.085c | 0.062 | 0.080 | −4.234c |
| Lev | 0.759 | 0.753 | 1.005 | 0.712 | 0.691 | 1.870a |
| CFO | 0.011 | 0.050 | −7.011c | −0.004 | 0.009 | −1.174 |
| Accruals | 0.039 | 0.010 | 5.766c | 0.042 | 0.054 | −1.267 |
| Growth | 0.092 | 0.109 | −1.140 | −0.212 | 0.108 | −4.144c |
The results for construction firms indicate that ROA and CFO are lower in recession years compared to other years. Furthermore, in 2007, both accruals and earnings management are higher than the other years. This year, construction firms probably noticed some signs of recession and tried to conceal them through abnormal accruals.
On the other hand, real estate firms show less sign of recession during 1996 compared to 2007. Although ROA is lower during both recession years, in 1996, both the magnitude and the direction of abnormal accruals are lower than in other years. In addition, real earnings management is also low compared to other years, so that these practices seek to decrease income. These facts indicate that the crisis was not so deep in 1996 for real estate firms and, since the sample comprises mainly non-listed companies, it is likely that firms are comfortable paying lower taxes. In fact, their Growth Added Value (GAV) was already positive in 1996, whereas that of the construction entities was still negative. Therefore, the year 1996 was worse for construction firms than for real estate companies.
In 2007, the recession is serious in real estate firms, as the ROA and the negative growth of sales indicate. However, there is an important difference with respect to construction firms: the mean leverage has grown from 62% to about 71% as a consequence of the bubble period. In these circumstances, 2007 presents both a high level of and positive abnormal accruals. Furthermore, abnormal discretionary expenses are lower, indicating that firms attempt to increase their income.
In sum, our results indicate that, when the crisis is beginning (2007), construction and especially real estate companies adopt an aggressive accounting policy in order to delay its effect on the financial reporting.
4.5Additional resultsWe have found that financial accounting indicators are related to housing price growth, although we have not found a strong relationship with GDP growth rate. This is a surprising fact, since the economic growth rate goes up or down with the economy.
Two things may explain this fact:
- -
Economic growth rate in construction activity is different from that in other industries. Thus, the special characteristics of this activity may result in these firms going through different stages as to other sectors.
- -
Spain is a continental European country. Guenther and Young (2000) find that accounting earnings in common-law countries will be more closely related to real economic activity. Besides, they do not find a statistically significant relationship between ROA and GDP growth rate in continental European countries like Germany and France.
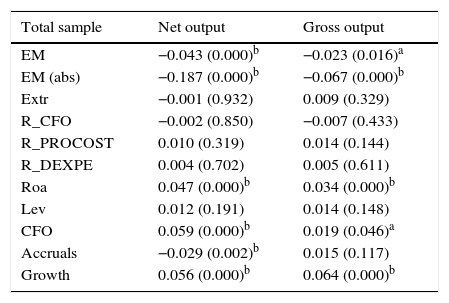
Net output (gross added value) of construction industry can facilitate a more accurate view of the real economic activity in this sector.1 However, the net output of a particular sector does not include intermediate goods and services. For this reason, we have also studied the gross output growth in real terms, that is, the sum of net output plus intermediate goods and services.
Table 8 provides evidence similar to that in Table 3. That is, there is a significant relationship not only between both net and gross output and ROA, but also between both net and gross output and several different variables. In this case, the relationship between real economic activity and the main economic and financial measures is stronger when used as a proxy both net and gross output rather than GDP or housing price growth rate.
Construction firms’ net and gross output.
| Total sample | Net output | Gross output |
|---|---|---|
| EM | −0.043 (0.000)b | −0.023 (0.016)a |
| EM (abs) | −0.187 (0.000)b | −0.067 (0.000)b |
| Extr | −0.001 (0.932) | 0.009 (0.329) |
| R_CFO | −0.002 (0.850) | −0.007 (0.433) |
| R_PROCOST | 0.010 (0.319) | 0.014 (0.144) |
| R_DEXPE | 0.004 (0.702) | 0.005 (0.611) |
| Roa | 0.047 (0.000)b | 0.034 (0.000)b |
| Lev | 0.012 (0.191) | 0.014 (0.148) |
| CFO | 0.059 (0.000)b | 0.019 (0.046)a |
| Accruals | −0.029 (0.002)b | 0.015 (0.117) |
| Growth | 0.056 (0.000)b | 0.064 (0.000)b |
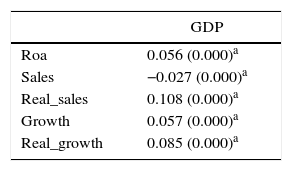
The second possible motivation is studied in Table 9. We have collected 162,100 firm-year observations of non-construction and non-real estate firms during the study period. Both ROA and sales growth are positively related to GDP growth. When inflation effects are eliminated from sales, we even find a stronger relationship with GDP growth. We must note that Guenther and Young (2000) did not find such a relationship in two continental European countries in a sample from 1983 to 1997. Therefore, it could be indirectly deduced that reporting quality in Spain has improved during the study period.
Other sectors’ GDP.
| GDP | |
|---|---|
| Roa | 0.056 (0.000)a |
| Sales | −0.027 (0.000)a |
| Real_sales | 0.108 (0.000)a |
| Growth | 0.057 (0.000)a |
| Real_growth | 0.085 (0.000)a |
ROA: earnings before interest and taxes over average total assets; Lev: debt on total assets; Sales: sales in logarithm terms; Real_sales: sales in real terms, excluding the inflation effects; Growth: change in logarithm of sales; Real_growth: sales growth, excluding the inflation effects.
Therefore, this article reveals that, in Spain, there is an association between real economic activity and firm economic position. However, we also show that, at least when speculative bubbles, GDP growth rate is not a good proxy for assessing economic activity in construction and real estate sectors. Specificities of these industries mean that the real changes undergone by them are not well represented by a generic measure of economic activity such as GDP growth rate. On the contrary, the changes in the accounting variables are better reflected by house price growth rate and, to an even greater extent, by the GAV of the sector.
5ConclusionsPapers about crises and downturns have increased, due to the current international situation. In Spain, the crisis is characterised by the role played by construction activity. In fact, it is usual that downturns worldwide are preceded by problems in housing. Accordingly, the aim of the present research is to examine the relationship between several accounting measures and two different economic activity proxies (GDP and house price growth rates), in a sample composed of construction and real estate firms in Spain.
The results indicate that although GDP growth rate may be a good proxy for economic activity when it deals with a general sample of firms, it may not be such a good proxy for construction and real estate firms. Instead, in general terms, the relationship between real housing price growth and financial accounting measures is significant. Furthermore, at least for construction companies, another finding is that insofar as the proxy for economic activity is closer to the gross added value of the own sector, the relationship with the accounting variables is higher.
However, we can observe differences between construction and real estate companies. Although ROA is not statistically different in both sectors, cash flow is considerably higher in construction than in real estate firms, whereas accruals are much higher in real estate companies. It seems that real estate companies attempt to present high ROA during economic bonanza. Since high ROA may not correspond with good economic conditions in real estate firms, it is not surprising that there is not a relationship between economic activity and either cash flow or growth of sales. Faced with low cash flow, real estate companies employed accruals, extraordinary items and even real earnings management to increase their profits. However, construction firms probably did not need to apply such an aggressive policy.
Regarding economic downturns, we observe firms behaving in a different manner depending on whether the crisis is ending or beginning. When the crisis is ending (1996), the level of earnings management is not higher than in other years. Instead, when the crisis is beginning (2007), they attempt to raise income. Other financial indicators such as ROA, cash flow and growth of sales indicate the magnitude of the crisis, as compared to other non-recessionary years.
The results of this study allow a better understanding of the quality of financial reporting prepared by construction and real estate companies during different economic contexts. Although we study two similar sectors, we show how different firms’ financial position may lead to different accounting policies. Increasing leverage and persistent high accruals may be signs alerting about enterprises in a weak financial position. In the case of real estate firms, cash flow was negative the year before the crisis became evident. Our evidence is interesting for both academics and professionals, since we provide insights into the behaviour of firms during economic upswings and downturns. Therefore, this paper helps to assess business risk to economic agents.
Limitations of the study provide avenues for future research opportunities. The study was conducted on a single country (Spain) for several reasons. First, isolating the study to a single country facilitates data collection and takes into account the Spanish specific situation during the period. Future studies could be expanded to other regions or other countries, allowing the generalisation of the results. Such studies would provide opportunities to understand differences in accounting information in construction activity during a recessionary period in the context of national culture. Finally, this paper could be extended considering other important accounting information qualities such as earnings persistence and conservatism.
Conflict of interestThe authors declare no conflict of interest.
| CNAE45: Construction firms | CNAE70: Real estate firms | |||||||||
|---|---|---|---|---|---|---|---|---|---|---|
| EM | Roa | Lev | Growth | CFO | EM | Roa | Lev | Growth | CFO | |
| Roa | 0.129 (0.000)c | 0.098 (0.000)c | ||||||||
| Lev | −0.042 (0.000)c | −0.340 (0.000)c | 0.049 (0.000)c | −0.171 (0.000)c | ||||||
| Growth | −0.219 (0.000)c | 0.194 (0.000)c | 0.098 (0.000)c | −0.237 (0.000)c | 0.242 (0.000)c | 0.044 (0.003)c | ||||
| CFO | −0.430 (0.000)c | 0.364 (0.000)c | −0.246 (0.000)c | 0.104 (0.000)c | −0.389 (0.000)c | 0.481 (0.000)c | −0.259 (0.000)c | 0.178 (0.000)c | ||
| Accruals | 0.537 (0.000)c | 0.066 (0.000)c | 0.084 (0.000)c | −0.027 (0.005)c | −0.027 (0.005)c | 0.529 (0.000)c | −0.046 (0.002)c | 0.191 (0.000)c | −0.090 (0.000)c | −0.090 (0.000)c |
EM: discretionary accruals; ROA: earnings before interest and taxes over average total assets; Lev: debt to total assets; Sales: sales in logarithm terms; Growth: change in logarithm of sales; CFO: cash-flow deflated by average total assets.
a Significance at 10%.
b Significance at 5%.