
We report the results of a study that examines university students’ perceptions about the public image of auditors through their stereotypes and their changes in attitudes after an extra-curricular activity with professionals, sponsored by a well-known and prestigious professional organisation of auditors in Spain. In our experimental study, we examine whether real life contact for students is a way to change their stereotypes on the auditing profession.
Participants completed a preliminary and also a post-survey, both pen-and-paper, in order to analyse the students’ final impressions and the evolution of their perception of auditors’ stereotypes. Both surveys were divided in three different sections: demographic data, general perceptions towards the activity, and 30 questions with regard to the perceptions of an average auditor compared to an average individual. Results indicate that, indeed, the activity changed the students’ view to consider auditors as more warm, more available to work in teams, more modest, more tender-minded, and less impulsive.
En este artículo se presentan los resultados de un estudio que examina la percepción que los estudiantes universitarios tienen de la imagen pública de los auditores a través de sus estereotipos, y su evolución tras la realización de una actividad extracurricular patrocinada por la Agrupación Territorial 1.ª, una agrupación profesional de auditores muy conocida y prestigiosa en España. En este estudio se examina si el contacto directo de los estudiantes con los profesionales es una manera de cambiar el estereotipo de los estudiantes hacia la profesión auditora.
Los participantes en el estudio completaron un cuestionario preliminar en papel antes y otro después de realizar la actividad, con la finalidad de analizar sus impresiones sobre la actividad y la evolución de sus percepciones sobre la profesión. Ambos cuestionarios se dividieron en 3 secciones: datos demográficos, percepción general de la actividad y 30 preguntas sobre la percepción de un auditor genérico comparado con un individuo genérico. Los resultados obtenidos indican que la actividad cambió la opinión de los estudiantes que pasaron a considerar a los profesionales más amigables y cercanos, más dispuestos a trabajar en grupo, humildes, comprensivos y menos impulsivos.
The purpose of this paper is to investigate the public image of the auditors’ profession. The public image of a profession is represented by stereotypes, label that was used for the first time by Walter Lippman in 1922 ‘to describe the process in which individuals use simplification for generalisation and organisation of perceptions purposes’ (Albu, Albu, Gîrbinä, & Sandu, 2011, p. 732). Stereotypes play an important part in the construction of a public attitude and in the selection process of those who want to be part of a profession, and also because students choose their degrees based on many conditionings, being one of them the specific stereotypes of the profession they are going to belong to (Arquero & Tejero, 2009).
Previous studies show traditional accountants and auditors perceived as a boring and grey group (Picard, Durocher, & Gerdron, 2014), but also the current economic crisis is having a negative impact on auditors’ credibility. Some Spanish large firms as Pescanova, Gowex or Martinsa, among others, have entered into bankruptcy due to accounting frauds with no previous sign from the auditor, increasing the expectation gap on the auditors’ role and their negative public perception. Following this perception, accounting and auditing firms have tried to improve their social image, understanding the necessity of giving an actual and fresh image to attract and retain talented members (Carnegie & Napier, 2010), as it could disincentive not only regular students, but also ‘the best and the brightest’ (Friedman & Lyne, 2001). To our best knowledge, little attention has been paid to the perception university students do have of the accounting profession when they are still students (Marriot & Marriot, 2003; Mladenovic, 2000). Additionally, this kind of studies is scarce in other contexts than the Anglo-Saxon one (Albu et al., 2011) were the market is very competitive versus countries such as Spain with a context of a high concentration level on few audit firms (Sierra, García, & Zorio, 2012).
As a consequence of several scandals involving auditors such as Pescanova or Gowex, Spanish regulators have considered several strong measures to improve audit quality following European guidelines, as the implementation of new enforcement controls (De las Heras, Cañibano, & Moreira, 2012), the reconsideration of the allowance of non-audit fees (Carmona & Momparler, 2011), or the implication of the auditor's independence (Gomez Aguilar & Ruiz-Barbadillo, 2000; Ruiz Barbadillo, Gómez Aguilar, & Biedma, 2005).
As a response to this situation, a well-known and prestigious professional organism of auditors in Spain (ICJCE) has begun to improve its visibility among university students, planning different activities to bring closer the auditing profession to the university community. Many universities around the world hold different extracurricular activities: sports, music ….and also extra training activities like round tables, special lectures from real business professionals, conferences, workshop about new researches, presentation of new manuals, lectures from important people (ministers, honorary doctors, prize-winners…). One of these extra-curricular activities has been called ‘auditor for a day’. At the end, the aim of many of these activities is to give students the possibility to orientate their future employability (Stevenson & Clegg, 2012). The majority of these activities are not official, so students can choose whether they want to have additional capacities towards their future.
Bearing all these things in mind, the objective of this paper is to analyse university students’ perception about the public image and stereotypes of auditors and their variation after being involved in an extra-curricular activity. For this ‘auditor for a day’ activity, students from different universities are greeted by the thirteen major audit firms such as: Baker Tilly, BDO, Deloitte, EY KPMG, or PWC among others. These students are invited to be part of the audit team for a day, visiting the audit client, sharing the coffee break and being present at certain discussions as part of the team for a day.
Thus, to be able to analyse the students’ evolution on the perception of auditors, participants were asked to complete a preliminary pen-and-paper survey (pre-survey) the previous day to doing the activity, and another one (post-survey) after the completion of the activity. Both surveys were divided in three different sections: demographic data, general perceptions towards the activity following Geiger and Ogilby (2000), and perceptions of an average auditor compared to an average individual, prepared by Coate, Mitschow, and Schinski (2003) and used in Zdolsek (2013).
The main contribution of the present paper is that organising real life activities for university students is a good way to deconstruct negative stereotype of auditor, improving their social image and boosting them to become auditors. More professional activities should be developed to be able to change the social view of audit profession in order to value their public interest to guarantee the integrity of businesses’ financial information. In addition, a non-Anglo-Saxon context study is carried out.
The remainder of this paper is organised as follows. The next section presents a review of the prior literature and formulates certain hypotheses and research questions. The section after that describes the sample and methods employed in testing the hypotheses. The results are then presented, followed by limitations, implications for stakeholders, suggestions for future research, and concluding remarks.
Literature review and hypothesisThe auditor's role is particularly necessary to fulfil market confidence and economic and financial stability. In accordance to this need, the professional activity has been considered as a public interest (PIOB, 2010). Thus, the image of the auditors may affect the confidence itself, as the accounting profession is a ‘…social practice with people, cultures, and myths’ (Leahman, 2005), and therefore the definition of ‘public interest’ has not a unique meaning (Baker, 2005). An approach to its definition can be found in Baker (2005), who considered that public interest, related to AICPA (American Institute of auditors called CPAs) objectives, has to be understood under the collective well-being of the community of people and institutions to which the accounting profession will serve. A similar view can be found in the academic literature considering the public interest concept close to the legitimacy theory, as ‘organisations exist to the extent that the particular society considers that they are legitimated, and if this is the case, the society “confers” upon the organisation the “state” of legitimacy’ (Deegan, 2002, p. 292). Then, the auditing profession receives the legitimacy from the society in order to raise the public interest, but the society itself might revoke the contract if it does not comply with their objectives and expectations (Mathews, 1993). As a conclusion, and in accordance to the legitimacy theory, any reverse in its reputation will have a strong and negative effect on its legitimacy.
Apart from legitimacy theory, several studies have analysed the existence of an “expectation gap” on the auditor's role (Liggio, 1974), considering this as the difference between what the public and other financial statement users perceive auditor's responsibilities to be and what auditors believe their responsibilities entail (Mc Enroe & Martens, 2001). Some authors have studied the different perceptions of the auditor's role, not only in Spain but worldwide, concluding users do not know the auditing process and the nature of the audit function and scope (Humphrey, Moizer, & Turley, 1993), and suggesting the big distance not only between auditors and stakeholders but also with judges (Lowe, 1994) or students (Frank, Lowe, & Smith, 2001).
There are some factors that explain the persistence of this gap. The different perception of the auditor role on fraud detection is one of the most relevant ones and can be found in several studies (Alleyne & Howard, 2005; García Benau, Garrido, Vico, Moizer, & Humphrey, 1999). Another factor is the existence of erroneous expectations on the auditor report, based on the misunderstanding of the auditors’ scope and responsibilities and on the frequent confusion between the auditors’ and directors’ responsibilities (Okafor & Otalor, 2013; Saladrigues & Grañón, 2014).
The literature on the “expectation gap” has been growing for the last decades directly related to those scandals affecting auditor's role (Jaramillo, García Benau, & Chávez, 2011). In this context, some authors have analysed auditors’ public image in Spain (García Benau et al., 1999), and particularly the effects on their reputation (Cameran, Moizer, & Pettinicchio, 2010; Piot, 2005), concluding reputation is crucial for any financial services firms but even more important for auditors, as reputable auditors perform higher quality audit reports (Krishnamurthy, Zhou, & Zhou, 2006).
When considering the existence of stereotypes on the auditor's public image, Hinton (2000) found that there are three conditions defining the presence of stereotypes: the group must be distinguished from the mass by certain characteristics, some others characteristics must be attributed to the group, and when identifying someone belonging to the group, the stereotypical characteristics are fully applied to him. Thus, we can understand that those characteristics related to accountants can be considered as stereotypes according to Hinton definition. Stereotypes are important because they represent the attitude of society to different groups (Carnegie & Napier, 2010), so auditors and accountants professional bodies are concerned about this social perception and their consequences. For example, some experiences related to negative stereotypes in society appeared to discourage the ‘best’ students from pursuing an accounting major (Saemann & Crooker, 1999). As previously explained, for the last few decades, many authors have studied the social perception on the accountants, from popular culture as shown from movies (Dimnik & Felton, 2006) to literature (Evans & Fraser, 2012) and humour (Miley & Read, 2012) concluding that the general perception of the accounting professional is grey and boring, closer to a bean counter than a prestigious and active professional. But this representation of the accountant, even though boring and grey, Picard et al. (2014) has some positive characteristics as the professional is expected to be honest and truthful, careful with money and both reliable and polite (Bougen, 1994; Carnegie & Napier, 2010; Friedman & Lyne, 2001). But recently, there has been a growing lack of confidence on the auditor's credibility. Some of the latest financial scandals have brought the reaction of international regulators (as Public Company Accounting Oversight Board – PCAOB or European Union) in order to recover the confidence on the auditor's role. As a result of that new response to the audit failure, the audit standards and requirements were changed to improve the public interest and to prevent the conflict of interests, as the previous ones were issued by the accounting profession. Indeed, for example, the Spanish Government has recently approved the new Act 22/2015, of July 20th, on Auditing, in line with the European Directive (2014/56 EU) in order to increase the quality of auditing and to strengthen the social trust of financial information.
Additionally, audit firms are aware of this negative image also among university students. Larkin (1991) revealed that high school and college students think that ‘accountants are dull, boring number crunchers’ (Larkin, 1991, p. 41) and that this situation affects their recruitment processes to attract bright new candidates (Jeacle, 2008), so most of them have tried to improve their image, presenting colourful brochures remarking the global message of the dynamic and multidisciplinary career (Picard et al., 2014), the dynamism of the profession (Davison, 2010, 2011), or the fun activities held by the companies (Jeacle, 2008).
Finally, some papers have shown different behaviours depending on auditors’ gender because Hames (1994) argues that men and women not only perceive the world differently, they also engage the world differently. While men see their role as performing a series of transactions, women characterise themselves as more interactive and supportive. However, there are also different stereotypes. Grey (1998) found that professionalism equated with desexualisation, particularly on how accountants dress and behave. The masculine suit was considered asexual and acceptable while a woman's length of skirt meant the difference between being viewed as a ‘bimbo’ or as a professional, considering perceptions of women providing non-essential support services. Jonnergård, Stafsudd, and Elg (2010) show that women achieve less performance evaluations than men-auditors and have lower career ambitions and expectations. Ittonen and Peni (2012) evidence that firms with female audit engagement partners have higher audit fees. A recent study shows that audit firms with female-dominated partnership structures are negatively related with aggressive accounting practices in audit clients (Montenegro & Bras, 2015).
In this context, based on previous arguments in the literature, we would like to test the existence of stereotypes on the auditor's role and personal characteristics through a specific activity related to auditing, so the following research questions appear.
RQ1: Is the activity of shadowing an auditor during one workday well considered by undergraduate students?
RQ2: What is the initial stereotype of auditors for undergraduate students?
RQ3: Can the image of the auditor's role be improved when knowing and experiencing the auditor's work day?
RQ4: Does the gender affect the students’ perceptions about audit stereotypes?
We expect a well-evaluated activity and a bad initial stereotype of auditors from undergraduate students, because of the crisis perceptions in the society. Additionally, we think that the extra-curricular activity could improve the students’ perceptions when knowing the real auditors’ work day and that gender could affect them.
Sample and methodologyThe participants in this study were undergraduate students enrolled and selected to shadow for a whole workday an audit team to experience a day as an auditor in November 2014. Lecturers of Accounting and Auditing from different universities located in the area of Madrid (Spain) were asked to make a selection among their students to join the experience under voluntary basis through a motivation letter. Those students were summoned to an introductory meeting the previous day of the activity where they were explained it in detail and they were given the information about their assigned company and auditor team to shadow the following day. At the end of the meeting they were asked to complete a preliminary pen-and-paper survey (pre-survey) which was anonymously filled in and immediately returned. None of the 58 participants refused to complete the survey that was divided in three different sections: demographic data, general perceptions towards the activity and perception of an average auditor compared to an average individual.
In order to measure the general perceptions towards the activity (see Annexe A for details), we used a modification of the eleven item questionnaire prepared by Geiger and Ogilby (2000), previously used in a pilot study on introductory accounting students by Watkins and Ogilby (1996). Items 10 and 11 were related to the instructor and the expected final grade of the accounting course, so they were not appropriate in this case and were eliminated from the questionnaire. Three new items related to general liking of accounting and the possibility of becoming and auditor were included. Students responded to the 12 perception statements on a five-point Likert-type scale ranging from strongly agree (“5”) to strongly disagree (“1”).
We also wanted to measure students’ perceptions of the auditor profession so we used a modification of the NEO Personality Assessment Inventory (Costa & McRae, 1992) consisting of 30 questions prepared by Coate et al. (2003) and later used in Zdolsek (2013). This instrument (see Annexe B for details), used to obtain perceptions of an average auditor compared to an average individual, is hierarchically organised to measure the personality traits in terms of five basic dimensions: Extraversion, Agreeableness, Conscientiousness, Emotional Stability (called also Neuroticism), and Openness to Experience. Within the NEO Personality Assessment, each of the 5 dimensions is divided into 6 characteristics, hence the 30 items linked to 30 personal characteristics. The students were asked to compare an average auditor to an average individual for each of the 30 characteristics on a Likert-type nine-point scale where 1 meant strongly disagree and 9 meant strongly agree, while the median value response of 5 indicates that an auditor is an ordinary individual in relation to the inquired characteristic.
A post-survey, also pen-and-paper, was conducted with the students after the completion of the activity to analyse their final impressions and evolution on the perception of both the activity and the auditing career. The post-survey was also divided in the three previously mentioned sections: demographic data, general perceptions towards the activity and perception of an average auditor compared to an average individual, the only difference being the tense in the second section, general perceptions towards the activity.
Both questionnaires were anonymous, but respondents provided their demographic data (birth date, gender, university, degree, academic year) on both of them so that pre- and post-questionnaires could be matched for each student.
As it was stated before, all 58 selected students answered the pre-survey, but only 43 of them answered the post-survey. Students who did not answer the post-questionnaire were excluded from the study.
The scales in our study were tested for internal consistency. Cronbach's alpha was 0.556 for the general perceptions towards the activity pre-test and 0.639 for the post-test. Both values are a little bit below the acceptable values of alpha, ranging from 0.70 to 0.95. This is due to poor correlation between some items, in particular TIME, LOOK/ENJOY, DIFFICULTY and BORING. However, for the purpose of the present study, those values do not affect the final results because our questionnaire is not summative. But both the Cronbach's alpha for the pre- (0.795) and the post-test (0.893) for the perceptions of the auditor profession scales demonstrated strong reliability (Bland & Altman, 1997).
Statistical methods such as descriptive and inferential statistics are used to get the objectives proposed in this research. There are many approaches available for statistical inference such as chi-squared test, Mann–Whitney test, Wilcoxon signed-rank test, or Kruskal–Wallis test (Cohen, Manion, & Morrison, 2000). In our case we want to analyse responses to the items with groups being the independent variable and those responses do not fit any parameterised distribution so the Wilcoxon signed-rank test for the paired pre–post-test responses comparison and the Mann–Whitney U test for the gender analysis (Wilcoxon, 1945) at 0.05 significance-level will be used. That test provides the same type of results as an analysis of variance, but based on the ranks and not the means of the responses. Also, as the authors want to analyse the responses as a whole, and not only by item, a multivariate extension of the Wilcoxon signed-rank test proposed by Leach (1991) and a multivariate extension of the Mann–Whitney U test proposed by Hettmansperger (1984) will be used.
Missing data at variable levels pose a problem because loss of data can lead to loss of statistical power and bias in parameter estimates. In the present study the missing data, all of them due to non-response to some of the questions, represent a very small percentage. Because of the survey design, the missing data cannot be estimated, thus those cases were not considered in the analysis and pairwise deletion was used.
Results and discussionThe participants come from nine different universities, public and private, out of the 14 existing in the area of Madrid (Spain), and most of them are studying Business Administration, alone (37% of the participants) or in a dual degree (26% of the participants) together with Law, Human Resources, Marketing or Computer Science, or a dual degree of Finance (25% of participants) with Accounting, Law or Economics. Most of the participants were born in 1994 (45% of participants), but the range varies from 1988 to 1995 and only 43% were female. Finally, 55% of participants are doing their third year, but it varies from the second to the sixth year.
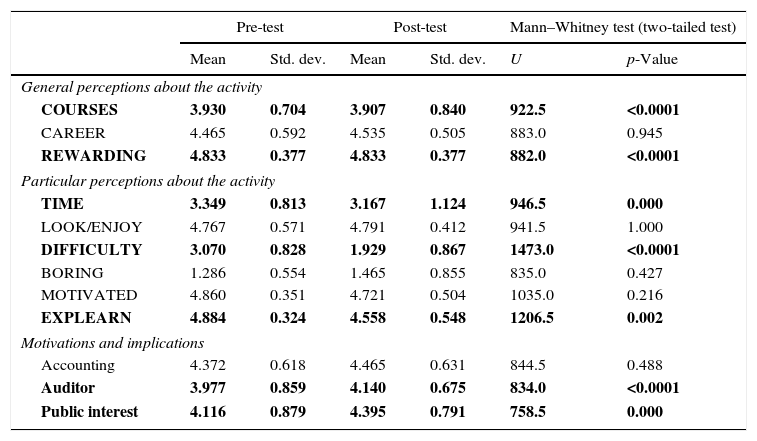
According to the activity proposed, and answering the first research question (RQ1), the majority of the students evaluated very well the activity. As it can be seen in Table 1, they considered it as useful for their future business courses (average 3.9 out of 5), for their future career (average around 4.5 out of 5) and personally rewarding (average 4.8 out of 5). Although the means are similar in the pre- and post-tests, there actually are statistically significant differences1 related to the general perceptions about the activity.
Evaluation of the activity with auditors.
| Pre-test | Post-test | Mann–Whitney test (two-tailed test) | ||||
|---|---|---|---|---|---|---|
| Mean | Std. dev. | Mean | Std. dev. | U | p-Value | |
| General perceptions about the activity | ||||||
| COURSES | 3.930 | 0.704 | 3.907 | 0.840 | 922.5 | <0.0001 |
| CAREER | 4.465 | 0.592 | 4.535 | 0.505 | 883.0 | 0.945 |
| REWARDING | 4.833 | 0.377 | 4.833 | 0.377 | 882.0 | <0.0001 |
| Particular perceptions about the activity | ||||||
| TIME | 3.349 | 0.813 | 3.167 | 1.124 | 946.5 | 0.000 |
| LOOK/ENJOY | 4.767 | 0.571 | 4.791 | 0.412 | 941.5 | 1.000 |
| DIFFICULTY | 3.070 | 0.828 | 1.929 | 0.867 | 1473.0 | <0.0001 |
| BORING | 1.286 | 0.554 | 1.465 | 0.855 | 835.0 | 0.427 |
| MOTIVATED | 4.860 | 0.351 | 4.721 | 0.504 | 1035.0 | 0.216 |
| EXPLEARN | 4.884 | 0.324 | 4.558 | 0.548 | 1206.5 | 0.002 |
| Motivations and implications | ||||||
| Accounting | 4.372 | 0.618 | 4.465 | 0.631 | 844.5 | 0.488 |
| Auditor | 3.977 | 0.859 | 4.140 | 0.675 | 834.0 | <0.0001 |
| Public interest | 4.116 | 0.879 | 4.395 | 0.791 | 758.5 | 0.000 |
In bold, the statistically significant differences between the pre- and post-test.
If we analyse the activity in depth, it does not seem to take a seemingly excessive amount of time (mean around 3.3 and 3.1 out of 5) and the students enjoyed this activity (mean 4.7 out of 5). This is a very high mark in the pre- and in the post-test, with no statistically significant differences. It also points out that the expected difficulty average of the activity was 3.07 in the pre-test and decreased to 1.9 in the post test, meaning that the students considered the activity as not-difficult. In order to evaluate the activity, it is also interesting to note that the mean of the students’ perceptions about ‘this activity was boring’ is very low (1.4 out of 5), even less in the pre-test. Moreover, the activity was very motivating for them in both cases, pre (4.8 out of 5) and post (4.7 out of 5) evaluations. None of the last two answers have statistically significant differences. Another important answer in order to evaluate the activity with real auditors is the expectation to learn a lot in the activity (4.8 out of 5), although there are statistically significant differences after the experience, decreasing a little in the post-test (4.5 out of 5). In any case, the students recognised they had learnt a lot with the activity although they could think many different routines than those learnt in the university.
Analysing the students’ attraction to accounting, the mean is very high (around 4.4). That is why it is not surprising the high average to become an auditor in the pre-test (3.9 out of 5) and even higher in the post-test (4.1 out of 5). This difference is not statistically significative. Another variable that increased its mean when the students did the activity was the consideration that auditing is a profession of public interest, 4.1 in the pre-test and 4.3 in the post-test. It means that the students realised the role of public interest of the auditors’ activity. In these two last questions related directly with the activity, the students improved their perceptions in the post-test so that the activity also boosted the students to become auditors because auditors’ work is considered a profession of public interest. This result could show that the students might not have a proper view and information about what the auditors do and what can be expected from the auditor activity.
Hence, according to students’ perceptions, we can answer the first research question saying that the activity of shadowing an auditor during one workday is very well considered by the undergraduate students that did this activity.
Considering the work of Costa and McRae (1992), Coate et al. (2003) and more recently Zdolsek (2013), we have tested the existence of some of the stereotypes on the profession, by using a block of adjectives to define the auditing profession. The qualifications are measured from 1 (totally disagreed) to 9 (totally agreed). Replies for that second section of the questionnaire show students’ perception of an average representative of the “auditing profession” in comparison to an average individual, as we can see in Table 2. It is generally assumed that participants have different personal cognitive metrics when expressing that perception about a specific characteristic in any questionnaire, so both Coate et al. (2003) and Zdolsek (2013) cluster their students’ replies into 3 groups, to allow easier interpretation. The student replies of 7, 8 or 9 were clustered into the first group (Group 1=high response values); those of 4, 5, or 6 were clustered into the second group (Group 2=intermediate response values); and 1, 2, or 3 were clustered intothe third group (Group 3=low response values).
Perception of auditors’ personality characteristics.
| Item | Personal characteristic | Group 1 values 7–9% of respondents | Group 2 values 4–6% of respondents | Group 3 values 1–3% of respondents | |
|---|---|---|---|---|---|
| Extroversion | 1 | Warmth | 57 | 39 | 4 |
| 2 | Gregarious | 77 | 21 | 2 | |
| 3 | Assertiveness | 90 | 10 | 0 | |
| 4 | Excitement | 83 | 15 | 2 | |
| 5 | Activity | 91 | 7 | 2 | |
| 6 | Positive emotions | 54 | 44 | 2 | |
| Agreeableness | 7 | Trust-R | 5 | 51 | 44 |
| 8 | Straightforward | 86 | 9 | 5 | |
| 9 | Altruism | 49 | 42 | 9 | |
| 10 | Compliance | 14 | 51 | 35 | |
| 11 | Modesty | 29 | 62 | 9 | |
| 12 | Tender-minded | 35 | 53 | 12 | |
| Conscientiousness | 13 | Competence | 95 | 5 | 0 |
| 14 | Order | 97 | 3 | 0 | |
| 15 | Dutiful | 91 | 5 | 4 | |
| 16 | Achievement | 77 | 21 | 2 | |
| 17 | Self-discipline | 96 | 2 | 2 | |
| 18 | Deliberation | 93 | 7 | 0 | |
| Emotional Stability | 19 | Anxiety | 39 | 52 | 9 |
| 20 | Hostility-R | 9 | 43 | 48 | |
| 21 | Depression-R | 9 | 50 | 41 | |
| 22 | Self-conscious | 0 | 7 | 93 | |
| 23 | Impulsive-R | 2 | 19 | 79 | |
| 24 | Vulnerability-R | 29 | 50 | 21 | |
| Open to experience | 25 | Fantasy | 36 | 52 | 12 |
| 26 | Aesthetics | 14 | 55 | 31 | |
| 27 | Feelings-R | 2 | 40 | 58 | |
| 28 | Actions | 72 | 28 | 0 | |
| 29 | Ideals | 82 | 18 | 0 | |
| 30 | Values | 53 | 43 | 4 | |
In opposition to common stereotypes, participants perceive auditors to be more extroverted than the average individual. Indeed they think they are very friendly, they have a strong tendency of not being alone but prefer the company of others and they are regarded as greater thrill and excitement seekers and as having more leadership tendencies than the average individual.
Almost no difference exists between the perception of an auditor and that of the average individual in the agreeable dimension of personality. The participants regard auditors as agreeable as the average individual, although they have a tendency to be blunt. Interestingly enough, auditors were thought of as being more sympathetic than the average individual.
The widest noticeable distinction between the perception of an auditor and that of the average individual is in the conscientiousness dimension of personality. Auditors are regarded as being more organised than the average individual, as having a tendency to be very cautious and diligent and not being casual about their responsibilities. Additionally, they are perceived as more emotionally stable and of as being less easily dejected than the average individual. They are more immune to stress than the average individual but, interestingly, less easy-going. They are also perceived as less impulsive and calmer than the average individual. Furthermore, they are less self-conscious than the average individual.
Finally, in general, participants perceive auditors to be more open to different experiences than the average individual. They are more open-minded and intellectually curious and are perceived as willing to try new things.
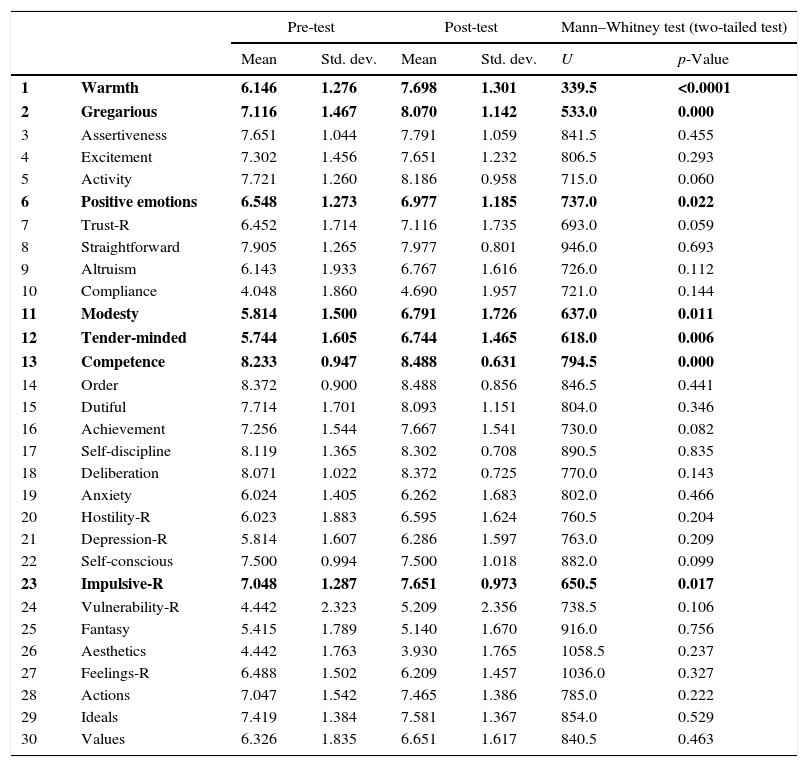
According to the results for the test on the existence and evolution of the students’ stereotypes on auditors (see Table 3), the highest values of the audit profession for the students were the order (8.372 out of 9), the competence (8.233 out of 9) and the straightforwardness (7.905 out of 9). In these three positive variables, their mean increased after the real life activity with auditors. The lowest values of the audit profession perceived by students were the compliance (4.048 out of 9), the aesthetics (4.442 out of 9) and the vulnerability (4.442 out of 9), although this last characteristic of the audit profession is reverse (R in Table 3 after the adjectives). It means that the students considered the audit profession very stressful (number 24), even higher in the post-test, after the real experience. The other two characteristics are also interesting to be pointed out. The compliance is the capacity of not yielding in the conflicts, that is, the audit profession is seen by students as an independent profession because auditors keep their opinions even with managers’ pressure. And this perception is even better after the activity although not significantly. Additionally, the artistic spirit is not a qualification of audit profession for students, even worse valuated after the real activity with real auditors. This could be due to the huge amount of technical rules and standards that auditors must follow in their jobs, with less room for creativity. This characteristic (number 26) together with fantasy (number 25) and not stable feelings (number 27) are the only adjectives that decreased after doing the activity. The rest of the characteristics of audit profession increased their value after the activity, meaning that after the experience with real auditors, students considered the audit profession as more modest and tender-minded but even more anxious and vulnerable to stress.
Evaluation of the audit profession for students.
| Pre-test | Post-test | Mann–Whitney test (two-tailed test) | |||||
|---|---|---|---|---|---|---|---|
| Mean | Std. dev. | Mean | Std. dev. | U | p-Value | ||
| 1 | Warmth | 6.146 | 1.276 | 7.698 | 1.301 | 339.5 | <0.0001 |
| 2 | Gregarious | 7.116 | 1.467 | 8.070 | 1.142 | 533.0 | 0.000 |
| 3 | Assertiveness | 7.651 | 1.044 | 7.791 | 1.059 | 841.5 | 0.455 |
| 4 | Excitement | 7.302 | 1.456 | 7.651 | 1.232 | 806.5 | 0.293 |
| 5 | Activity | 7.721 | 1.260 | 8.186 | 0.958 | 715.0 | 0.060 |
| 6 | Positive emotions | 6.548 | 1.273 | 6.977 | 1.185 | 737.0 | 0.022 |
| 7 | Trust-R | 6.452 | 1.714 | 7.116 | 1.735 | 693.0 | 0.059 |
| 8 | Straightforward | 7.905 | 1.265 | 7.977 | 0.801 | 946.0 | 0.693 |
| 9 | Altruism | 6.143 | 1.933 | 6.767 | 1.616 | 726.0 | 0.112 |
| 10 | Compliance | 4.048 | 1.860 | 4.690 | 1.957 | 721.0 | 0.144 |
| 11 | Modesty | 5.814 | 1.500 | 6.791 | 1.726 | 637.0 | 0.011 |
| 12 | Tender-minded | 5.744 | 1.605 | 6.744 | 1.465 | 618.0 | 0.006 |
| 13 | Competence | 8.233 | 0.947 | 8.488 | 0.631 | 794.5 | 0.000 |
| 14 | Order | 8.372 | 0.900 | 8.488 | 0.856 | 846.5 | 0.441 |
| 15 | Dutiful | 7.714 | 1.701 | 8.093 | 1.151 | 804.0 | 0.346 |
| 16 | Achievement | 7.256 | 1.544 | 7.667 | 1.541 | 730.0 | 0.082 |
| 17 | Self-discipline | 8.119 | 1.365 | 8.302 | 0.708 | 890.5 | 0.835 |
| 18 | Deliberation | 8.071 | 1.022 | 8.372 | 0.725 | 770.0 | 0.143 |
| 19 | Anxiety | 6.024 | 1.405 | 6.262 | 1.683 | 802.0 | 0.466 |
| 20 | Hostility-R | 6.023 | 1.883 | 6.595 | 1.624 | 760.5 | 0.204 |
| 21 | Depression-R | 5.814 | 1.607 | 6.286 | 1.597 | 763.0 | 0.209 |
| 22 | Self-conscious | 7.500 | 0.994 | 7.500 | 1.018 | 882.0 | 0.099 |
| 23 | Impulsive-R | 7.048 | 1.287 | 7.651 | 0.973 | 650.5 | 0.017 |
| 24 | Vulnerability-R | 4.442 | 2.323 | 5.209 | 2.356 | 738.5 | 0.106 |
| 25 | Fantasy | 5.415 | 1.789 | 5.140 | 1.670 | 916.0 | 0.756 |
| 26 | Aesthetics | 4.442 | 1.763 | 3.930 | 1.765 | 1058.5 | 0.237 |
| 27 | Feelings-R | 6.488 | 1.502 | 6.209 | 1.457 | 1036.0 | 0.327 |
| 28 | Actions | 7.047 | 1.542 | 7.465 | 1.386 | 785.0 | 0.222 |
| 29 | Ideals | 7.419 | 1.384 | 7.581 | 1.367 | 854.0 | 0.529 |
| 30 | Values | 6.326 | 1.835 | 6.651 | 1.617 | 840.5 | 0.463 |
In bold, the statistically significant differences between the pre- and post-test.
In our students’ sample, the initial auditor stereotype is better than expected, because the main adjectives about audit profession have high marks (higher than 6 out of 9). We found that on average, students considered the auditor as an efficient, organised, with high level of self-discipline, and cautious in professional thoughts. This good stereotype could be associated with the high level of engagement with the audit profession because the students selected were very motivated to accounting. Indeed, accounting teachers did the selection of students according with their outstanding marks.
However at the same time, they are dull and far from creativity and poor in dealing with stress, which are in line with previous literature on accounting stereotypes (Carnegie & Napier, 2010). But when meeting the day-to-day life of auditors, by the activity proposed, some of the perceptions changed, as students have found that auditors are more friendly and cheerful and ready to work in a group than they expected, and more self-effacing than they perceived. On the other hand, certain and positive perceptions remained on the same level, as those referred to the competence, dutifulness and order, among others, showing that the activity promoted by the professional body has had an improvement on the image, reducing negative stereotypes.
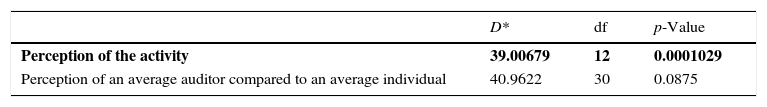
The third research question (RQ3) is concerned about the students’ change of opinion after the completion of the activity. Therefore, as it has been already stated, participants were asked to complete two surveys, one before the activity (pre-test) and another one at the completion of the activity (post-test). The Leach (1991) multivariate extension of the Mann–Whitney rank test (as cited by Sheu & O’Curry, 1996) was implemented in R. As the computed p-value (p-value=0.0001029) is lower than the significance level (alpha=0.05), the multivariate extension of the Mann–Whitney rank test for two paired samples allows us to reject the null hypothesis, and accept the alternative hypothesis for the perception of the activity. So the two groups of answers are statistically different. But the p-value for the perception of an average auditor compared to an average individual (p-value=0.0875) is higher than the significance level (alpha=0.05), thus there is not enough evidence to reject null hypothesis of the pre- and post-test responses being different in the case of the perception of an average auditor compared to an average individual. This fact might be due to the short time interval between the both test, not giving the respondents enough time to reflect on the daily auditing work and the auditors’ professional image.
If the 12 questions that comprised the general perceptions towards the activity and the 30 items about the perception of an average auditor compared to an average individual are analysed individually it can be observed that for most of them they are rated higher in the post-survey than in the pre-survey (see Tables 1 and 4). As it has been already mentioned, those differences are statistically significative (p-value smaller than 0.05) only in some (11) of the items (in bold in Tables 1 and 4).
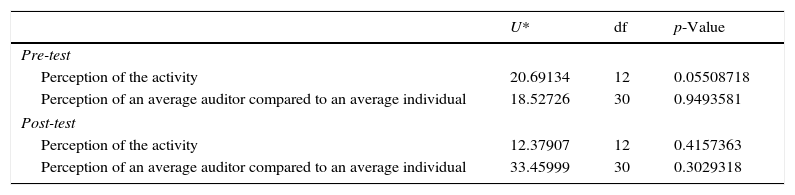
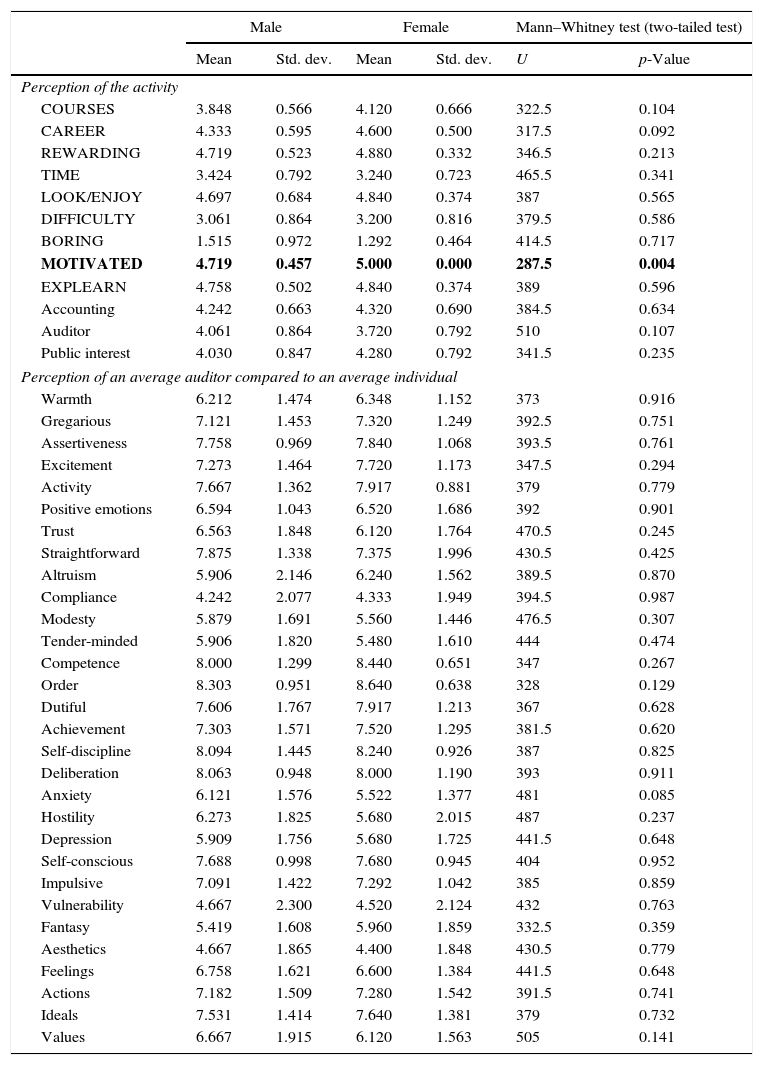
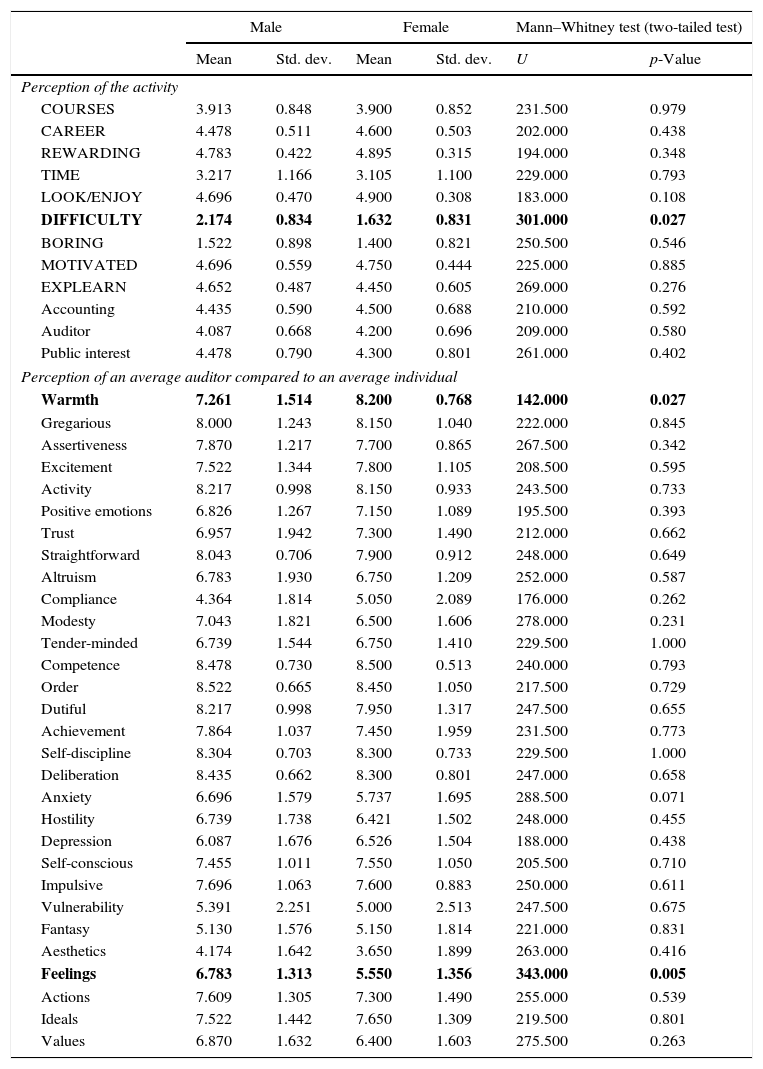
In relation to gender (RQ4), there is almost no difference by gender for both the pre- and the post-survey, the opposite result that we have hypothesised initially. As the computed p-value (see Table 5) of the Hettmansperger (1984) multivariate extension of the Mann–Whitney U test, implemented in R (p-value=0.05508718) for the perception of the activity pre-test is higher than the significance level (alpha=0.05), thus there is not enough evidence to reject the null hypothesis. The result is similar for the perception of the auditor compared to an average individual (p-value=0.9493581). For the post-test (see also Table 5), both p-values of the Hettmansperger (1984) multivariate extension of the Mann–Whitney U test for the perception of the activity (p-value=0.4157363) and for the perception of the auditor compared to an average individual (p-value=0.3029318) are also higher than the significance level (alpha=0.05), thus there is not enough evidence to reject the null hypothesis. Therefore it can be assumed that the two groups (Male vs. Female) of answers are statistically equal for both the pre- and the post-test. But if each item is analysed separately, for the pre-survey (see Table 6) the only difference is on Motivated (p-value=0.004), while for the post-survey (see Table 7) the differences are in Difficulty (p-value=0.027), Warmth (p-value=0.027) and Feelings (p-value=0.005). In the first case (Motivated in pre-survey), values for female are higher (Mean=5, Std. dev.=0) than those for males (Mean=4.719, Std. dev.=0.457). This could be because female study more hours than male in undergraduate level or because they are more excited with new activities out of the university. In the case of the post-survey, for Difficulty female values are smaller in average (Mean=1.632, Std. dev.=0.831) than those for males (Mean=2.174, Std. dev.=0.834), even if in both cases they are small. This could be because students do not suffer discrimination in their studies and they assume that they will have the same chances in future jobs. However, when they really work, they will realise it. In the valuation for auditing warmth, female change their opinion and their values are higher in average (Mean=8.2, Std. dev.=0.768) than those for males (Mean=7.261, Std. dev.=1.514). Perhaps initially females had had worst stereotype about auditors than men and the real life experience changed their view. And finally for Feelings, values for female are smaller (Mean=5.55, Std. dev.=1.356) than those for males (Mean=6.783, Std. dev.=1.313), meaning than women students think than auditors are less emotionally stable than for men, fact that we cannot explain it with only this information.
Hettmansperger multivariate extension of the Mann–Whitney U test.
| U* | df | p-Value | |
|---|---|---|---|
| Pre-test | |||
| Perception of the activity | 20.69134 | 12 | 0.05508718 |
| Perception of an average auditor compared to an average individual | 18.52726 | 30 | 0.9493581 |
| Post-test | |||
| Perception of the activity | 12.37907 | 12 | 0.4157363 |
| Perception of an average auditor compared to an average individual | 33.45999 | 30 | 0.3029318 |
In bold, the statistically significant differences between genders.
Mann–Whitney test for the pre-test by gender.
| Male | Female | Mann–Whitney test (two-tailed test) | ||||
|---|---|---|---|---|---|---|
| Mean | Std. dev. | Mean | Std. dev. | U | p-Value | |
| Perception of the activity | ||||||
| COURSES | 3.848 | 0.566 | 4.120 | 0.666 | 322.5 | 0.104 |
| CAREER | 4.333 | 0.595 | 4.600 | 0.500 | 317.5 | 0.092 |
| REWARDING | 4.719 | 0.523 | 4.880 | 0.332 | 346.5 | 0.213 |
| TIME | 3.424 | 0.792 | 3.240 | 0.723 | 465.5 | 0.341 |
| LOOK/ENJOY | 4.697 | 0.684 | 4.840 | 0.374 | 387 | 0.565 |
| DIFFICULTY | 3.061 | 0.864 | 3.200 | 0.816 | 379.5 | 0.586 |
| BORING | 1.515 | 0.972 | 1.292 | 0.464 | 414.5 | 0.717 |
| MOTIVATED | 4.719 | 0.457 | 5.000 | 0.000 | 287.5 | 0.004 |
| EXPLEARN | 4.758 | 0.502 | 4.840 | 0.374 | 389 | 0.596 |
| Accounting | 4.242 | 0.663 | 4.320 | 0.690 | 384.5 | 0.634 |
| Auditor | 4.061 | 0.864 | 3.720 | 0.792 | 510 | 0.107 |
| Public interest | 4.030 | 0.847 | 4.280 | 0.792 | 341.5 | 0.235 |
| Perception of an average auditor compared to an average individual | ||||||
| Warmth | 6.212 | 1.474 | 6.348 | 1.152 | 373 | 0.916 |
| Gregarious | 7.121 | 1.453 | 7.320 | 1.249 | 392.5 | 0.751 |
| Assertiveness | 7.758 | 0.969 | 7.840 | 1.068 | 393.5 | 0.761 |
| Excitement | 7.273 | 1.464 | 7.720 | 1.173 | 347.5 | 0.294 |
| Activity | 7.667 | 1.362 | 7.917 | 0.881 | 379 | 0.779 |
| Positive emotions | 6.594 | 1.043 | 6.520 | 1.686 | 392 | 0.901 |
| Trust | 6.563 | 1.848 | 6.120 | 1.764 | 470.5 | 0.245 |
| Straightforward | 7.875 | 1.338 | 7.375 | 1.996 | 430.5 | 0.425 |
| Altruism | 5.906 | 2.146 | 6.240 | 1.562 | 389.5 | 0.870 |
| Compliance | 4.242 | 2.077 | 4.333 | 1.949 | 394.5 | 0.987 |
| Modesty | 5.879 | 1.691 | 5.560 | 1.446 | 476.5 | 0.307 |
| Tender-minded | 5.906 | 1.820 | 5.480 | 1.610 | 444 | 0.474 |
| Competence | 8.000 | 1.299 | 8.440 | 0.651 | 347 | 0.267 |
| Order | 8.303 | 0.951 | 8.640 | 0.638 | 328 | 0.129 |
| Dutiful | 7.606 | 1.767 | 7.917 | 1.213 | 367 | 0.628 |
| Achievement | 7.303 | 1.571 | 7.520 | 1.295 | 381.5 | 0.620 |
| Self-discipline | 8.094 | 1.445 | 8.240 | 0.926 | 387 | 0.825 |
| Deliberation | 8.063 | 0.948 | 8.000 | 1.190 | 393 | 0.911 |
| Anxiety | 6.121 | 1.576 | 5.522 | 1.377 | 481 | 0.085 |
| Hostility | 6.273 | 1.825 | 5.680 | 2.015 | 487 | 0.237 |
| Depression | 5.909 | 1.756 | 5.680 | 1.725 | 441.5 | 0.648 |
| Self-conscious | 7.688 | 0.998 | 7.680 | 0.945 | 404 | 0.952 |
| Impulsive | 7.091 | 1.422 | 7.292 | 1.042 | 385 | 0.859 |
| Vulnerability | 4.667 | 2.300 | 4.520 | 2.124 | 432 | 0.763 |
| Fantasy | 5.419 | 1.608 | 5.960 | 1.859 | 332.5 | 0.359 |
| Aesthetics | 4.667 | 1.865 | 4.400 | 1.848 | 430.5 | 0.779 |
| Feelings | 6.758 | 1.621 | 6.600 | 1.384 | 441.5 | 0.648 |
| Actions | 7.182 | 1.509 | 7.280 | 1.542 | 391.5 | 0.741 |
| Ideals | 7.531 | 1.414 | 7.640 | 1.381 | 379 | 0.732 |
| Values | 6.667 | 1.915 | 6.120 | 1.563 | 505 | 0.141 |
In bold, the statistically significant differences between genders.
Mann–Whitney test for the post-test by gender.
| Male | Female | Mann–Whitney test (two-tailed test) | ||||
|---|---|---|---|---|---|---|
| Mean | Std. dev. | Mean | Std. dev. | U | p-Value | |
| Perception of the activity | ||||||
| COURSES | 3.913 | 0.848 | 3.900 | 0.852 | 231.500 | 0.979 |
| CAREER | 4.478 | 0.511 | 4.600 | 0.503 | 202.000 | 0.438 |
| REWARDING | 4.783 | 0.422 | 4.895 | 0.315 | 194.000 | 0.348 |
| TIME | 3.217 | 1.166 | 3.105 | 1.100 | 229.000 | 0.793 |
| LOOK/ENJOY | 4.696 | 0.470 | 4.900 | 0.308 | 183.000 | 0.108 |
| DIFFICULTY | 2.174 | 0.834 | 1.632 | 0.831 | 301.000 | 0.027 |
| BORING | 1.522 | 0.898 | 1.400 | 0.821 | 250.500 | 0.546 |
| MOTIVATED | 4.696 | 0.559 | 4.750 | 0.444 | 225.000 | 0.885 |
| EXPLEARN | 4.652 | 0.487 | 4.450 | 0.605 | 269.000 | 0.276 |
| Accounting | 4.435 | 0.590 | 4.500 | 0.688 | 210.000 | 0.592 |
| Auditor | 4.087 | 0.668 | 4.200 | 0.696 | 209.000 | 0.580 |
| Public interest | 4.478 | 0.790 | 4.300 | 0.801 | 261.000 | 0.402 |
| Perception of an average auditor compared to an average individual | ||||||
| Warmth | 7.261 | 1.514 | 8.200 | 0.768 | 142.000 | 0.027 |
| Gregarious | 8.000 | 1.243 | 8.150 | 1.040 | 222.000 | 0.845 |
| Assertiveness | 7.870 | 1.217 | 7.700 | 0.865 | 267.500 | 0.342 |
| Excitement | 7.522 | 1.344 | 7.800 | 1.105 | 208.500 | 0.595 |
| Activity | 8.217 | 0.998 | 8.150 | 0.933 | 243.500 | 0.733 |
| Positive emotions | 6.826 | 1.267 | 7.150 | 1.089 | 195.500 | 0.393 |
| Trust | 6.957 | 1.942 | 7.300 | 1.490 | 212.000 | 0.662 |
| Straightforward | 8.043 | 0.706 | 7.900 | 0.912 | 248.000 | 0.649 |
| Altruism | 6.783 | 1.930 | 6.750 | 1.209 | 252.000 | 0.587 |
| Compliance | 4.364 | 1.814 | 5.050 | 2.089 | 176.000 | 0.262 |
| Modesty | 7.043 | 1.821 | 6.500 | 1.606 | 278.000 | 0.231 |
| Tender-minded | 6.739 | 1.544 | 6.750 | 1.410 | 229.500 | 1.000 |
| Competence | 8.478 | 0.730 | 8.500 | 0.513 | 240.000 | 0.793 |
| Order | 8.522 | 0.665 | 8.450 | 1.050 | 217.500 | 0.729 |
| Dutiful | 8.217 | 0.998 | 7.950 | 1.317 | 247.500 | 0.655 |
| Achievement | 7.864 | 1.037 | 7.450 | 1.959 | 231.500 | 0.773 |
| Self-discipline | 8.304 | 0.703 | 8.300 | 0.733 | 229.500 | 1.000 |
| Deliberation | 8.435 | 0.662 | 8.300 | 0.801 | 247.000 | 0.658 |
| Anxiety | 6.696 | 1.579 | 5.737 | 1.695 | 288.500 | 0.071 |
| Hostility | 6.739 | 1.738 | 6.421 | 1.502 | 248.000 | 0.455 |
| Depression | 6.087 | 1.676 | 6.526 | 1.504 | 188.000 | 0.438 |
| Self-conscious | 7.455 | 1.011 | 7.550 | 1.050 | 205.500 | 0.710 |
| Impulsive | 7.696 | 1.063 | 7.600 | 0.883 | 250.000 | 0.611 |
| Vulnerability | 5.391 | 2.251 | 5.000 | 2.513 | 247.500 | 0.675 |
| Fantasy | 5.130 | 1.576 | 5.150 | 1.814 | 221.000 | 0.831 |
| Aesthetics | 4.174 | 1.642 | 3.650 | 1.899 | 263.000 | 0.416 |
| Feelings | 6.783 | 1.313 | 5.550 | 1.356 | 343.000 | 0.005 |
| Actions | 7.609 | 1.305 | 7.300 | 1.490 | 255.000 | 0.539 |
| Ideals | 7.522 | 1.442 | 7.650 | 1.309 | 219.500 | 0.801 |
| Values | 6.870 | 1.632 | 6.400 | 1.603 | 275.500 | 0.263 |
In bold, the statistically significant differences between genders.
The auditing profession has a public interest role, as the auditors’ report is a key factor for the confidence of the market so that any negative impact on the perception of the auditors’ image might affect their social legitimacy. Indeed, the latest financial frauds have affected the social perception of auditors. Thus the aim of this study was to analyse university students’ perceptions about the public image and stereotypes of auditors and their variation after being involved in an extra-curricular activity outside the university.
Using a pre-test/post-test instrument before and after the activity (consisting on shadowing an auditor throughout one working day) we have found that the proposed activity is a good way to boost students to become auditors. Although social psychology stereotype theory suggests that social perceptions are difficult to change because they are over-determined (Wells, 2010), we think that this kind of activities is a way to improve stereotypes from the first step of a professional, in the university, the pre-stage of becoming professional.
We have also discovered that better than expected stereotypes can be found on the image that university students – and then future professionals – have on the auditing profession. In accordance with certain previous experiences promoted by the ICJCE, and in line with previous literature we found that students highlight the order, the competence, the self-discipline, the thoroughness, the assertiveness and the commitment of audit profession, positive characteristics related to their stereotypes. Thus undergraduate students do not have so negative stereotype for the audit profession as was expected due to the recent auditing scandals. While as a whole there is no significant difference between their opinion before and after the activity, some characteristics do improve and the differences are statistically significant after being in contact with auditors’ daily work. Students have perceived the shadowed auditors as more friendly, cheerful, ready to work in groups, modest, tender-minded, competent and less impulsive than before the activity. Only slight differences have been found between genders.
This study has interesting implications for the audit profession, as activities to show their daily work increase their positive public interest image and their good stereotype. This positive perception would improve the social role of the auditing and accounting firms, and would enhance the confidence on the financial information supply chain. Additionally, real life activities could boost students to become auditors and change the social negative stereotypes of audit professionals in people's minds. There are also some positive implications for universities because real life activities seem to increase students’ motivation so this type of extra-curricular activities should become more frequent.
Finally, any study is not free of limitations. We collected data from 58 students enrolled in the activity in year 2014. In order to be sure of our conclusions and to avoid any possible bias a larger sample with the students from the coming years will be considered in a future study. Also broader samples that might include students not selected for the activity, acting as a control group, could enrich the results and add to these conclusions, establishing differences if any. Furthermore, a new study with the mentioned larger sample will allow the authors verify the internal consistency of the instrument and, therefore, the validity of the conclusions.
Conflict of interestThe authors declare no conflict of interests.
The authors thank the collaboration of students who have participated in the survey. They also want to extend that thanks to the First Territorial Association of the Institute of Chartered Accountants of Spain and audit firms for its support in this study.
Participants responded to the 12 perception statements on a five-point Likert scale ranging from strongly agree (“5”) to strongly disagree (“1”). Verbs inside parenthesis (a/b) correspond to the pre-test (a) or to the post-test (b) version of the questionnaire.
- 1.
This activity will help me do well in my future business courses. (COURSES)
- 2.
This activity will help me do well in my career. (CAREER)
- 3.
(Doing/Having done) well in this activity would be personally rewarding. (REWARDING)
- 4.
(I expect/I had) to spend more time on this activity than on my other activities. (TIME)
- 5.
(I am looking forward to/I liked doing) this activity. (LOOK/ENJOY)
- 6.
This activity (will be/has been) difficult. (DIFFICULTY)
- 7.
This activity (will be/has been) boring. (BORING)
- 8.
I (am/was) highly motivated to do well in this activity. (MOTIVATED)
- 9.
I (expect to learn/learned) a lot in this activity. (EXPLEARN)
- 10.
I like accounting. (Accounting)
- 11.
In the future, I would like to become an auditor. (Auditor)
- 12.
I consider auditing to be a public interest (Publicinterest)
Items 1–9 are from Geiger and Ogilby (2000). Items 10–12 were proposed by the authors.
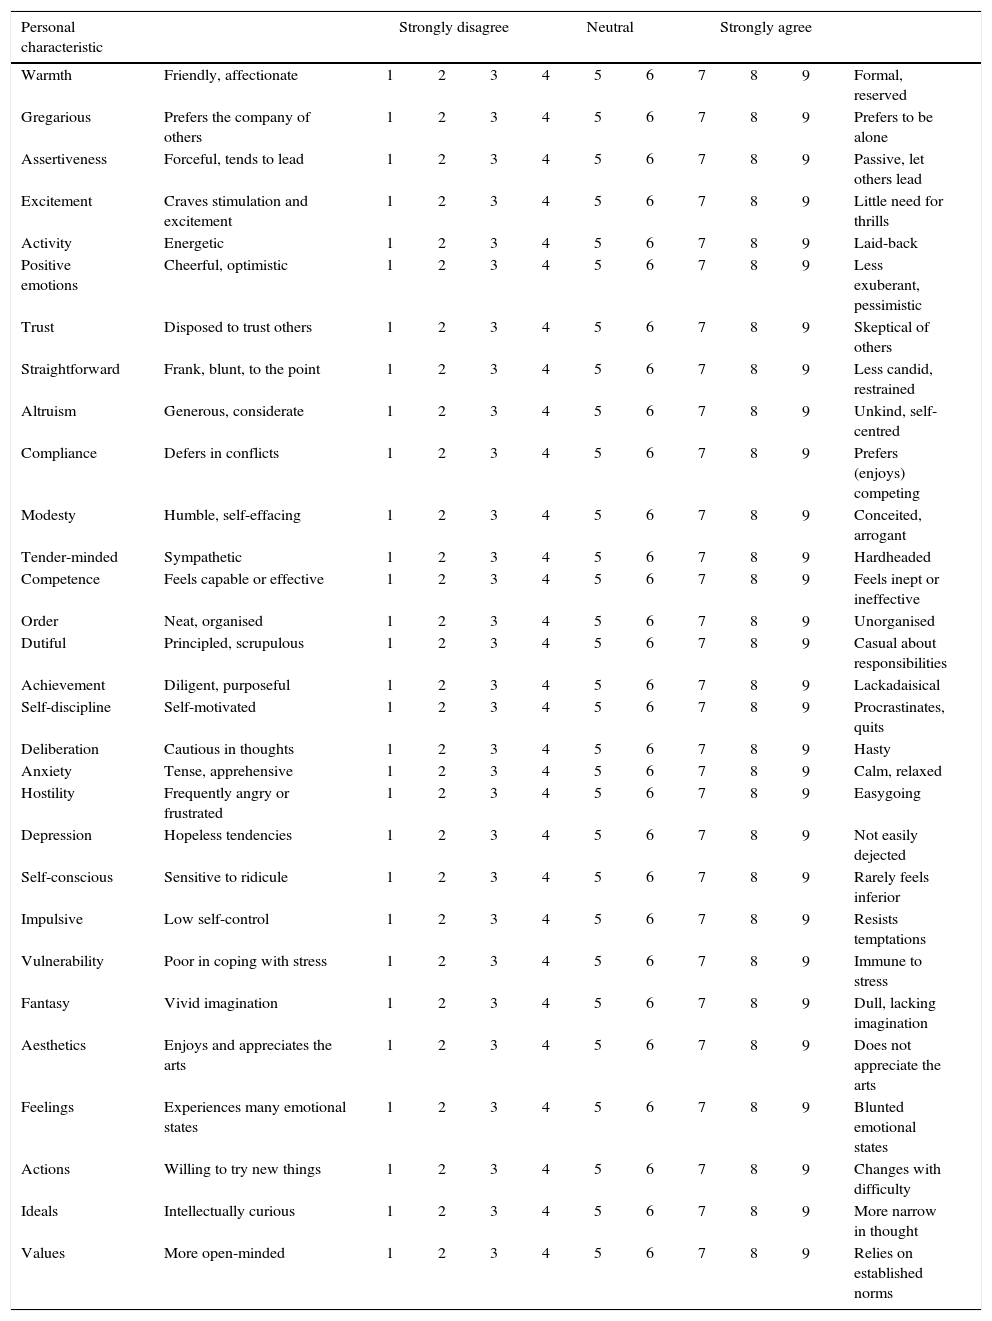
Participants responded to the 30 to students’ perceptions of an average (ordinary) auditor compared to an average (ordinary) individual, with respect to 30 personality traits. Participants were asked to circle a numeric response for each trait on a nine-point scale between the two extremes of the trait to express the strength of their opinion regarding the specific terms used (a 5 indicating that an accountant was a typical individual with respect to that trait).
| Personal characteristic | Strongly disagree | Neutral | Strongly agree | ||||||||
|---|---|---|---|---|---|---|---|---|---|---|---|
| Warmth | Friendly, affectionate | 1 | 2 | 3 | 4 | 5 | 6 | 7 | 8 | 9 | Formal, reserved |
| Gregarious | Prefers the company of others | 1 | 2 | 3 | 4 | 5 | 6 | 7 | 8 | 9 | Prefers to be alone |
| Assertiveness | Forceful, tends to lead | 1 | 2 | 3 | 4 | 5 | 6 | 7 | 8 | 9 | Passive, let others lead |
| Excitement | Craves stimulation and excitement | 1 | 2 | 3 | 4 | 5 | 6 | 7 | 8 | 9 | Little need for thrills |
| Activity | Energetic | 1 | 2 | 3 | 4 | 5 | 6 | 7 | 8 | 9 | Laid-back |
| Positive emotions | Cheerful, optimistic | 1 | 2 | 3 | 4 | 5 | 6 | 7 | 8 | 9 | Less exuberant, pessimistic |
| Trust | Disposed to trust others | 1 | 2 | 3 | 4 | 5 | 6 | 7 | 8 | 9 | Skeptical of others |
| Straightforward | Frank, blunt, to the point | 1 | 2 | 3 | 4 | 5 | 6 | 7 | 8 | 9 | Less candid, restrained |
| Altruism | Generous, considerate | 1 | 2 | 3 | 4 | 5 | 6 | 7 | 8 | 9 | Unkind, self-centred |
| Compliance | Defers in conflicts | 1 | 2 | 3 | 4 | 5 | 6 | 7 | 8 | 9 | Prefers (enjoys) competing |
| Modesty | Humble, self-effacing | 1 | 2 | 3 | 4 | 5 | 6 | 7 | 8 | 9 | Conceited, arrogant |
| Tender-minded | Sympathetic | 1 | 2 | 3 | 4 | 5 | 6 | 7 | 8 | 9 | Hardheaded |
| Competence | Feels capable or effective | 1 | 2 | 3 | 4 | 5 | 6 | 7 | 8 | 9 | Feels inept or ineffective |
| Order | Neat, organised | 1 | 2 | 3 | 4 | 5 | 6 | 7 | 8 | 9 | Unorganised |
| Dutiful | Principled, scrupulous | 1 | 2 | 3 | 4 | 5 | 6 | 7 | 8 | 9 | Casual about responsibilities |
| Achievement | Diligent, purposeful | 1 | 2 | 3 | 4 | 5 | 6 | 7 | 8 | 9 | Lackadaisical |
| Self-discipline | Self-motivated | 1 | 2 | 3 | 4 | 5 | 6 | 7 | 8 | 9 | Procrastinates, quits |
| Deliberation | Cautious in thoughts | 1 | 2 | 3 | 4 | 5 | 6 | 7 | 8 | 9 | Hasty |
| Anxiety | Tense, apprehensive | 1 | 2 | 3 | 4 | 5 | 6 | 7 | 8 | 9 | Calm, relaxed |
| Hostility | Frequently angry or frustrated | 1 | 2 | 3 | 4 | 5 | 6 | 7 | 8 | 9 | Easygoing |
| Depression | Hopeless tendencies | 1 | 2 | 3 | 4 | 5 | 6 | 7 | 8 | 9 | Not easily dejected |
| Self-conscious | Sensitive to ridicule | 1 | 2 | 3 | 4 | 5 | 6 | 7 | 8 | 9 | Rarely feels inferior |
| Impulsive | Low self-control | 1 | 2 | 3 | 4 | 5 | 6 | 7 | 8 | 9 | Resists temptations |
| Vulnerability | Poor in coping with stress | 1 | 2 | 3 | 4 | 5 | 6 | 7 | 8 | 9 | Immune to stress |
| Fantasy | Vivid imagination | 1 | 2 | 3 | 4 | 5 | 6 | 7 | 8 | 9 | Dull, lacking imagination |
| Aesthetics | Enjoys and appreciates the arts | 1 | 2 | 3 | 4 | 5 | 6 | 7 | 8 | 9 | Does not appreciate the arts |
| Feelings | Experiences many emotional states | 1 | 2 | 3 | 4 | 5 | 6 | 7 | 8 | 9 | Blunted emotional states |
| Actions | Willing to try new things | 1 | 2 | 3 | 4 | 5 | 6 | 7 | 8 | 9 | Changes with difficulty |
| Ideals | Intellectually curious | 1 | 2 | 3 | 4 | 5 | 6 | 7 | 8 | 9 | More narrow in thought |
| Values | More open-minded | 1 | 2 | 3 | 4 | 5 | 6 | 7 | 8 | 9 | Relies on established norms |