


There is now a great concern for environmental problems and countries around the world are trying to take steps to foster economic growth without compromising future generations. In this research, we use indicators proposed in the Environmental Performance Index (EPI) based on two essential issues related to sustainable development: (i) environmental stresses on human health; (ii) protecting ecosystems and natural resources. The objective of this research focuses on analysing the EPI and the variables that can influence it. This is important because of the potential repercussions at the macroeconomic level, for example the influence it may have on the valuation of certain agents in assessing the policies of a certain country, as well as at the microeconomic level due to its relationship with other types of indexes that can be related directly to the company's valuation and the effect on investment. We conducted multivariate analysis using the HJ-Biplot method to contextualize the countries grouped by geographic area and the variables related to the environmental indicators included in the EPI. The sample comprised 24 countries in Latin America. The findings obtained from the empirical analysis point to socioeconomic factors, such as education, determining factors of environmental performance in the countries analyzed. In addition, political ideology influences environmental performance when analysing the environmental health of the countries. Size also positively influences the EPI. From the biplot analysis, we also find that the variables for environmental health are more closely related to the countries located in the geographic area of the Caribbean (Cuba, the Dominican Republic, Haiti, Jamaica and Trinidad and Tobago). Other variables associated with ecosystem vitality, such as air pollution (effects on nature), are more closely related to Mesoamerica (Costa Rica, Honduras and Panama, among other countries). Countries in South America, however, are shown to be more concerned about climate change; these countries include Argentina, Chile and Brazil.
En la actualidad existe una gran preocupación por los problemas medioambientales y los países de todo el mundo tratan de adoptar medidas para fomentar el crecimiento económico sin comprometer a las generaciones futuras. En este estudio utilizamos los indicadores propuestos en el Índice de Desempeño Ambiental (EPI, por sus siglas en inglés), basados en dos cuestiones fundamentales relacionadas con el desarrollo sostenible: (i) las presiones medioambientales sobre la salud humana y (ii) proteger los ecosistemas y los recursos naturales. El objetivo de este estudio se centra en analizar el EPI y las variables que pueden influir en él. Esto es importante a causa de las posibles repercusiones a nivel macroeconómico, como la influencia que pueda tener en la valoración de ciertos agentes al evaluar las políticas de determinado país, así como a nivel microeconómico, debido a su relación con otros tipos de índices que pueden relacionarse directamente con la valoración de la empresa y su efecto sobre una inversión. Realizamos un análisis multivariable utilizando el método HJ-Biplot para contextualizar los países agrupados por áreas geográficas y las variables relacionadas con los indicadores medioambientales incluidos en el EPI. La muestra incluyó a 24 países de Latinoamérica. Los hallazgos obtenidos del análisis empírico apuntan a factores socioeconómicos, como la educación, factores determinantes del cumplimiento de las normas medioambientales en los países analizados. Además, la ideología política influye en el cumplimiento de las normas medioambientales al analizar la salud medioambiental de los países. El tamaño también influye positivamente en el EPI. A partir del análisis biespacial, también encontramos que las variables para la salud medioambiental están más relacionadas con los países ubicados en el área geográfica del Caribe (Cuba, República Dominicana, Haití, Jamaica y Trinidad y Tobago). Otras variables asociadas con la vitalidad del ecosistema, como la contaminación del aire (efectos en la naturaleza), están más estrechamente relacionadas con Mesoamérica (Costa Rica, Honduras y Panamá, entre otros países). Sin embargo, se muestra que los países de Sudamérica están más preocupados por el cambio climático; entre estos países se encuentran Argentina, Chile y Brasil.
In recent years, society in general has shown great and growing interest in environmental issues, both microeconomic and macroeconomic. From the microeconomic point of view, stakeholders are increasingly interested in determining the environmental performance of companies and using this information to make decisions about their investments. Therefore, companies are encouraged to incorporate social and environmental criteria in their strategic management; such information is reflected in environmental indexes, such as the Dow Jones Sustainability Stock Index, used to obtain alternative funds from non-conventional investors concerned about sustainable development and social well-being (Curran & Moran, 2007).
From the macroeconomic point of view, the environmental performance of countries can be defined as the capacity of a country to produce environmental public goods (Duit, 2005). Therefore, each country needs to render accounts to its citizens about the environmental policies that it implements and political candidates should try to please the voters, bearing in mind that the citizens will want to obtain information about the environmental performance of the different countries. Those countries that encourage companies to be responsible in environmental terms will obtain two advantages: first, their companies can be rewarded by the stock market, an effect that has been studied in previous research (Ortas & Moneva, 2011); second, voters will be pleased with their political candidates.
Although the relationship between environmental performance and several variables has been analyzed extensively by previous studies at the firm level (Al-Tuwaijri, Christensen & Hughes, 2004; Clarkson, Li, Richardson & Vasvari, 2008; Gallego-Álvarez, Ortas, Vicente-Villardón & Álvarez Etxeberria, 2017), in this research we focused on analysing countries’ environmental performance and the determinant factors. The choice of countries rather than companies for analysing environmental issues is based on the fact that citizens are increasingly demanding services and activities developed in the public sphere as these directly affect their environmental well-being and governments control most daily activities of citizens in relation to environmental issues such as the consumption of energy and other resources, the generation of waste and environmental planning, both in the short and long term. This applies to the entire community, giving rise to an approach to citizens as consumers of public services that will allow determination of the demand for information from different stakeholders with respect to environmental performance (Frías-Aceituno & Marques Rodríguez-Ariza, 2013).
Correa-Ruiz and Moneva-Abadía (2011, p. 200) identify an existing void in the literature, stating “it is also necessary to call for explorations of mechanisms for improved accountability and transparency in the public realm”, referring, inter alia, to the environmental and sustainability aspects of the public sector and to the orientation of a sustainable budget among countries in terms of social and environmental matters; this requires in-depth analysis of some of the explanatory factors that may affect the environmental performance of countries, such as the size of the population, political ideology, volume of spending and political competition (Navarro, Alcaraz & Ortiz, 2010).
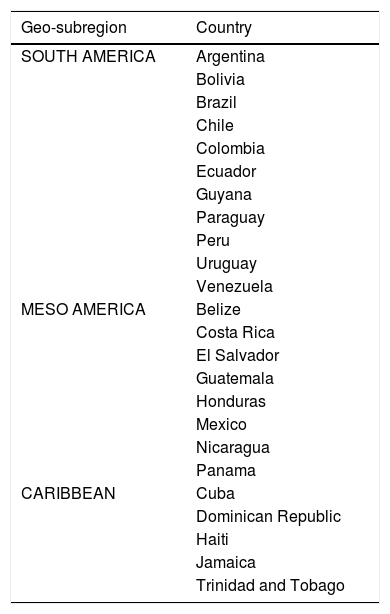
Concretely, we focus on the Environmental Performance Index (EPI), which offers a composite index of current national environmental protection efforts, drawn up by Esty et al. (2008), who form part of a group of environmental experts at Yale University and Columbia University. The indicators focus on two overarching environmental objectives: (i) reducing environmental stresses to human health, and (ii) promoting ecosystem vitality and sound natural resource management. To analyze these objectives, we have used the following indicators: air and water effects on the ecosystem, biodiversity and habitat, productive natural resources, climate change, burden of disease and air and water pollution effects on environmental health. The sample used comprises the 24 countries selected by Esty et al. (2008) and incorporates the advantages derived from considering different geographic contexts. In the case of Latin America, we can distinguish South America, Mesoamerica and the Caribbean.
In addition, we analyze which socioeconomic and institutional factors have an impact on the environmental situation, first jointly and then considering the two most relevant dimensions into which the EPI is divided (environmental health and ecosystem vitality). Among the socioeconomic factors, we consider those associated with wealth or economic development and education. Among the institutional factors, we examine those related to the internal characteristics of the countries (government effectiveness), style of public administration (control of corruption) and political factors (political ideology). Some of these variables have already been used in previous papers using population size, political ideology, expenditure volume or political competence to analyze how these variables influence the development of social and environmental practices of a specific country, such as that of Navarro, Alcaraz and Ortiz (2010) in the case of Spain.
In addition to proposing a Tobit regression model for cross-sectional data, we also carry out a multivariate analysis using a statistical technique, the HJ-Biplot, with the objective of contextualizing the countries grouped into geographical areas of Latin America and the variables related to environmental indicators included in the EPI.
The findings obtained from the empirical analysis point to socioeconomic factors, such as education, as determinant factors of environmental performance in the countries analyzed. Moreover, political ideology also influences environmental performance when the environmental heath of a country is examined. With respect to the control variables analyzed, country size positively affects environmental performance, contrary to the country's wealth measured by its gross domestic product (GDP). At least in part, the country's wealth is not the only variable that must be analyzed when considering its environmental performance; rather education, the political regime or population density are factors that currently have great relevance and they must be considered to study a country's performance (Fiorino, 2011). This is the case of the countries under study, for which we are able to verify that both education and population density are positive and statistically significant variables; the political regime joins these when environmental health is included in the study.
From the HJ-Biplot analysis, we also demonstrate that those variables related to environmental health are more closely related to the countries located in the geographic area of the Caribbean (Cuba, the Dominican Republic, Haiti, Jamaica and Trinidad and Tobago). Other variables associated with ecosystem vitality, such as air pollution (effects on nature), are more closely related to Mesoamerica (Costa Rica, Honduras and Panama, among other countries). Countries in South America, however, are shown to be more concerned about climate change; these countries include Argentina, Chile and Brazil.
This research reinforces and contributes to the prior literature as follows. The study expands and improves on previous investigations of the EPI as a measure of environmental performance. Thus, in the first place, economic and institutional variables are used together, in contrast to other studies that use only one type of variable or carry out research from a theoretical point of view. Second, the countries and environmental variables are contextualized using the HJ-Biplot methodology, which provides a graphic representation showing that the EPI can be divided into two categories, one related to environmental health and the other related to ecosystem vitality; this classification is equal to the dimensions into which the EPI is divided. Third, through this methodology, we are able to verify that in Latin America environmental concerns are different: on the one hand, there are countries that are more concerned about environmental health; on the other hand, there are those concerned about ecosystem vitality. In addition, this classification is corroborated through the Tobit regression analysis, which shows that economic variables such as education play a fundamental role in the environmental performance measured by the EPI and its components, especially environmental health, although political ideology is also considered relevant and significant.
The paper is structured as follows. In Section “Theoretical framework” we describe the theoretical framework. Section “Research hypotheses” develops the research hypotheses in relation to the factors that may influence EPI. Section “Sample, variables and methodology” describes the research methods: sample, variables and analytic techniques, including the HJ-Biplot methodology and Tobit regression. In Section “Results of empirical analysis”, the results of the empirical analysis are provided, which are then discussed in section “Discussion of results”. Section “Conclusions” summarizes the main conclusions.
Theoretical frameworkDifferent researchers have offered definitions of environmental performance in the business world. For example, Lober (1996) indicates that environmental performance concerns the commitment of organizations to preserve and protect the natural environment considering its multidimensional characteristics, such as maintaining the quality of water, air, soil, etc. Others argue that environmental performance refers to the effects of commercial activities and products in the natural environment, such as the consumption of resources, the generation of waste and emissions. Epstein (1996) lists several components of environmental performance, such as minimizing pollutants, conserving resources, reducing waste, conserving energy, marketing safe products and notifying potential risks, among others.
However, environmental performance is also a concern in the public sphere, which is the object of study in this research. The Organization for Economic Co-Operation and Development (OECD) considers the following objectives as the most relevant for environmental performance in the public sphere: helping individual governments to evaluate progress in achieving their environmental objectives; promoting continuous dialogue on environmental policies; encouraging greater accountability on the part of governments in relation to public opinion. Therefore, it is necessary to establish a mechanism to check whether the environmental policies that are developed at the local, regional, national and global levels actually correspond to what was initially planned. This implies the adoption of qualitative or quantitative indicators capable of measuring the progress and setbacks that take place in our countries, regions and cities with respect to the environmental objectives initially established (Böhringer & Löschel, 2006). In general, this information system should be based on batteries of selected indicators through a dialogue with all interested parties. In this regard, for Bell and Morse (2003), an indicator must meet a series of requirements: an indicator must be relevant to a problem according to the definition used; an indicator must be measurable; the set of indicators must cover the entire field of sustainability according to the definition used; the data must be available for all countries and must be available from public sources.
In this regard, in recent years there has been an increase in the development of indicators of an environmental nature. One of the first initiatives in this regard took place in 1992 at the United Nations Conference on Environment and Development held in Rio de Janeiro, also known as the Earth Summit. Specifically, Chapter 40 of Agenda 21 shows the great importance of developing sustainability indicators (including environmental indicators) that are accepted internationally to provide a solid basis for decision-making at all levels and contribute to sustainable development. These indicators are classified into various areas, such as biodiversity, water, energy, transport and agriculture.
The need to have a set of common indicators around the world, allowing global comparison, has also been argued by a long list of academics and organizations worldwide. In this context, different organizations, such as the OECD and the United Nations (UN), have begun to design indicator batteries to facilitate the relevant information for decision-making, policy formulation and impact control. With this objective, the OECD has developed a set of indicators following the pressure-state-response model proposed by Rapport and Friend (1979). This model follows a logic according to which human activity exerts pressure on the environment and on environmental and natural resources, altering the initial state to a greater or lesser extent.
The pressure-state-response model allows us to propose a set of consistent indicators that consider environmental problems comprehensively and analyze all the connections and interrelationships that occur between the origin of the problems and their consequences. For Pintér, Hardi, Martinuzzi and Halla (2012), a good system of indicators will allow organizations to make objective decisions and have information available to help join forces to achieve the proposed objectives, as well as enabling subsequent evaluation. In short, it is about considering three types of indicators: pressure indicators that quantify the environmental impact of different economic sectors; state indicators that reflect the real situation of the environment; response indicators that show the measures adopted to mitigate the negative effects of human activity on the environment. Both the OECD and UN have developed environmental indicators, although the latter organization has adapted these to the concept of sustainable development including not only environmental but also economic and social aspects.
In relation to the theoretical framework supporting our research – analysing how certain factors influence the environmental performance of countries – we refer to economic theory. This theory suggests that the control of environmental pollution improves as the country develops and therefore rich countries not only can but also must invest in the control of pollution and other environmental improvements (Esty & Porter, 2005). Based on the same criterion, Jahn (1998) considers that countries with greater economic growth are better able to handle environmental problems because they have the financial resources to do so. However, this same author also found that in rich countries, such as Germany, Japan, Canada, the United States and Switzerland, there was no relationship between wealth and environmental performance. The reason for this is that rich countries can invest money to improve their environment in contrast to poorer countries, but they also tend to create environmental problems because they have a high level of consumption that can lead to an increase in their levels of pollution, generating more waste and the use of more natural resources. Based on economic theory, it is important to highlight the arguments related to the market, that is, the objective of environmental information is to offer useful data to shareholders and capital markets since this can influence the positive or negative valuation of shares, as reflected in previous studies (Ortas & Moneva, 2011).
Another theory that can be applied in this research is that of ecological modernization, which is based on the relationship between economic growth and environmental degradation and argues that this relationship creates new conditions for the protection of the environment (Duit, 2005). Other aspects considered in this theory are the role of science and technology, the importance of market dynamics, the role of economic agents and the ideology of social movements (Mol & Sonnenfeld, 2000). Therefore, together with economic factors we have to consider another series of factors that can affect environmental performance (e.g. political, structural, competitiveness), as manifested in studies such as that by Esty and Porter (2005). These authors find significant differences in the environmental performance of countries that have similar economic levels, which suggests that environmental outcomes do not simply depend on economic development, but also on other institutional, political or structural factors.
Fiorino (2011) also shows that effective, innovative and adaptable governance is a necessary condition for countries seeking a transition towards sustainability. Governance aspects include the integration of policies, the improvement of social capital, the improvement of participation and the adoption and implementation of elections in a more adaptive manner. In the literature on governance, some researchers have focused on the type of political regime, concluding that democratic regimes show higher levels of environmental performance than authoritarian regimes, also finding that high levels of democracy are associated with growth in GDP (Farzin & Bond, 2006). Finally, there are theories that consider reality as a plurality of agents using social information generated by economic entities (D’Onofrio, 2006). Such social information is also of interest to employees, customers, the general public, public administrations and organizations, NGOs, etc. In this regard, we employ social contract theory (companies have an implicit contract with society to use natural resources and in return offer products, services and waste to the environment in a manner that society expects to be reciprocal) and stakeholder theory (social information, specifically related to the environment, is presented by firms because a large group of social agents is interested in this and in the performance of the entity and without their support, explicit or implicit, the existence of the company would be endangered).
Analysing the theoretical framework, in our research we use an index derived from the Environmental Sustainability Index (ESI) called the EPI; this allows us to measure environmental performance and focus on two objectives: (i) a reduction in environmental stresses to human health; (ii) the protection of ecosystems and natural resources (Esty et al., 2008). The EPI includes a category of environmental health policies with the objective of referring to the effect that the environment has on quality of life globally, with a view to reducing the environmental pressure on human health. Therefore, the EPI uses a set of indicators to reflect environmental health: environmental burden of disease, air pollution (effects on human health) and water (effects on human health). It also includes indicators related to ecosystem vitality aimed at reducing the loss or degradation of ecosystems and natural resources. These indicators are as follows: air pollution effects on ecosystems, water effects on ecosystems, biodiversity and habitat, productive natural resources (forestry, fisheries and agriculture) and climate change (Esty et al., 2008).
In addition to environmental indicators, in this research we also consider socioeconomic and institutional factors that represent the institutional environment (Link, 2012) and that can affect environmental performance at the country level. The institutional factors used in this research are as follows: governmental effectiveness, political stability and control of corruption (Emerson, Hsu & Levy, 2012, cited by De Sherbinin et al., 2012). We also incorporate factors that represent wealth and economic development, such as gross domestic product (GDP) per capita (International Monetary Fund, 2013; World Bank, 2013). GDP is considered important because it reflects the capacity of a country to offer its citizens good living conditions, taking into account economic, social and environmental aspects. In addition, a country with good GDP will improve its health services, access to education and working conditions and will protect its citizens from corruption and will ultimately provide a more sustainable habitat (Cracolici, Cuffaro & Nijkamp, 2010). These determinants have previously been examined in studies that analyze their influence on environmental performance (Scruggs, 2001; Swamy & Fikkert, 2000).
In the next section, we analyze each of the factors mentioned to propose our research hypotheses.
Research hypothesesIn light of the above, several factors seem to be involved in the environmental performance of countries. These can be grouped as socioeconomic factors (economic development, education) and institutional factors (government effectiveness, control of corruption and political ideology).
Wealth and economic developmentMost authors who have studied the relationship between country wealth and environmental performance have found a positive relationship. In this regard, Esty and Porter (2005) argue that the most competitive countries in the world tend to show better environmental performance. Similarly, Scruggs (2001), using a sample of 17 countries in industrialized democracies and constructing an index of environmental performance to serve as the dependent variable, found higher per capita income to be positively related to environmental performance.
To represent economic wealth, we use the variable GDP per capita. This measure of GDP depends on several components, such as private consumption, investment, public consumption, changes in inventories, total exports and total imports (Swamy & Fikkert, 2000). The level of GDP of a country can be considered a relevant aspect in terms of its capacity to provide citizens with good living conditions from an economic, social and environmental point of view. It is necessary to increase GDP per capita to improve the standard of living of the population and provide better social welfare services, as well as ensuring better access to education, better working conditions and a healthier and more sustainable environment. What we intend to demonstrate with the following hypothesis is that the higher a country's GDP, the better its environmental conditions measured using the EPI. Thus, we propose:H1 The economic wealth of a country presents a significant and positive relationship with its environmental performance.
The level of education is also a fundamental factor in the environmental performance of a country. A well-educated and trained population will demand a greater volume of information concerning the problems and performance of the environment. In this regard, Duit (2005) considers that a country with a high level of education and culture will be better able to handle environmental problems and initiate environmental cooperation programmes. According to Cracolici et al. (2010), CO2 emissions and literacy rates are variables capable of capturing the differences between countries in terms of social and environmental dimensions and authors such as McGillivary (2005) have obtained similar results with respect to the rate of literacy. From the above, the following hypothesis is proposed:H2 The level of education of a country shows a significant and positive relationship with its environmental performance.
The effectiveness of public administration and the government of a country can be relevant drivers in the development of environmental performance. Effectiveness in this regard covers issues such as the quality of the bureaucracy, the competence of public officials, the independence of the civil service from political pressures and the credibility of the government's commitment to policies (Kaufmann, Kraay & Mastruzzi, 2008). There is a slightly positive relationship between governmental effectiveness and sound environmental performance according to Esty et al. (2008). In particular, government effectiveness correlates positively with the performance of greenhouse gas emissions per capita, ozone in health, growing inventory and water quality indicators. The effectiveness of the government shows a slightly negative correlation with the performance in the sulphur dioxide indicator. Based on the above, the following hypothesis is proposed:H3 Government effectiveness in a country shows a significant and positive relationship with the country's environmental performance.
Corruption has a negative effect on economic growth. In this regard the previous literature presents a negative relationship between corruption and environmental performance, arguing that corruption reduces the income of a country and that this level of low income can generate high levels of pollution. According to Duit (2005), it is argued that the quality of institutions is a crucial factor in explaining the variation in governance and the economy. Well-functioning institutions – in terms of transparency, the rule of law and low levels of corruption – alleviate the problems of collective action by providing a structure for rules and sanctions within the institutional sphere. Authors such as Welsch (2004) have found a negative impact of corruption on environmental performance, demonstrating that countries with high levels of corruption tend to have low levels of environmental performance, while countries with low levels of corruption obtain high levels in the EPI. Thus, the following hypothesis is proposed:H4 The control of corruption in a country shows a significant and positive relationship with its environmental performance.
According to Neumayer (2003) an aspect of interest for analysis is whether the political tendency of the ruling party in a country might have some impact, either positive or negative, on environmental performance. Previous research has shown that a more consensual democracy is beneficial for a higher level of environmental performance. In this regard, Scruggs (2001) considers that in democracies environmental protection is strengthened through the free dissemination of new interests, the mobilization of voters (or leaders), etc. All this culminates in better environmental conditions. More specifically, in a study of 21 OECD countries, Neumayer (2005) found a statistically significant effect of left-wing parties in reducing emissions. Likewise, some authors consider that the participation of different agents in the political process tends to favour sound environmental performance, a result that is maintained even when controlling for certain socioeconomic variables (Scruggs, 2001).
Initially, one might think that left-leaning governments would tend to carry out programmes or activities aimed at good environmental performance, while those with other types of ideologies are more often focused on social policies. However, because there is insufficient previous evidence to predict which political trend may be more prone to good environmental performance, the following research hypothesis is formulated:H5 The political tendency of the ruling party of a country shows a significant and positive relationship with its environmental performance.
With our research goals in mind, we selected several countries of Latin America as our target population. This population was chosen in the interest of extending and generalizing the results obtained in previous studies and overcoming two of their limitations: the countries studied and the techniques used in the data analysis. In this regard, previous studies have usually focused on specific geographical contexts, such as Western industrialized countries (Scruggs, 2003), 21 OECD countries (Neumayer, 2003), 17 industrialized democracies (Scruggs, 2001) and 131 countries (Hosseini & Kaneko, 2011). In this research, the sample used refers to the 24 countries selected by Esty et al. (2008) (see Appendix A) and incorporates the advantages derived from considering different geographic areas in the case of Latin America: South America, Mesoamerica and the Caribbean.
The selection of Latin American countries is justified because their economies are based to a large extent on mineral extraction and the production of raw materials; historically, protecting the environment has not been a concern in the productive management of natural resources in this region of the world. This has led to pollution in areas in which productive activity is concentrated, in addition to the destruction of habitats and a non-quantified decrease in renewable natural resources. Some authors, such as Katz and Del Favero (1995), have summarized the problems Latin American countries face as follows: the deterioration of renewable resources and the loss of natural habitats (caused either by direct exploitation or by the secondary effects of pollution), as well as urban problems and issues caused by pollution (human health and well-being). Moreover, Latin America is a region four times larger than Eastern and Western Europe together and comprises one of the most valuable ecosystems on the planet. Aide and Grau (2004) affirm that in rural areas an important conservation strategy has been to invest in sustainable development projects to alleviate the problems caused by deforestation and its consequences: carbon emissions, destruction of habitats and a loss of biodiversity. These same authors propose that social policy and conservation should focus on the recovery of the ecosystems of lands that have been abandoned.
Data were obtained directly from information sources (country) at the national level, so they are subject to certain reporting requirements and the quality established by the entity responsible for data collection. All data sources are available to the public and include official statistics calculated at the government level and data compiled by researchers or international organizations. Some of the most important sources of data are as follows: the World Resources Institute, the World Bank, the Climate Analysis Indicator Tool (CAIT), the International Energy Agency, the UN, the Department of Economic and Social Affairs, the WHO/UNICEF Joint Monitoring Programme for Water Supply and Sanitation, the World Database on Protected Areas and the UN Environment Programme (see http://epi.yale.edu).
Dependent variableThe dependent variable Envperindex used is the EPI, devised by Esty et al. (2008). This index has also been used by Malul, Hadad and Ben-Yair (2009). These authors consider that the EPI provides a composite index of current national environmental protection efforts. This index comprises objectives, policy categories and indicators corresponding to environmental health and ecosystem vitality. The performance indicators are tracked in well-established policy categories, which are then combined to create a final score. Each score is converted to a scale of 0–100 by simple arithmetic calculation, with 0 being the worst observed value and 100 the best observed value. EPI breaks down into two subcategories that are also examined: (i) “environmental health” and (ii) “ecosystem vitality”. These each represent 50% of the final EPI score; i.e. there is an equal division between human and natural issues. Within the “environmental health” subcategory, the environmental burden of disease indicator is weighted at 50% because it is the most complete and precise measure of environmental health burdens. The water and air pollution (effects on humans) indicators comprise the remaining 50% of this subcategory, each representing a quarter of the total score for “environmental health”. Within the “ecosystem vitality” subcategory, the climate change indicator carries 50% of the weight. The air pollution (effects on ecosystems) indicator is weighted at 5% in this subcategory. The remaining indicators: water (effects on ecosystems), biodiversity and habitat and productive natural resources (forestry, fisheries, agriculture) are each weighted to cover the remaining 45% of this subcategory.
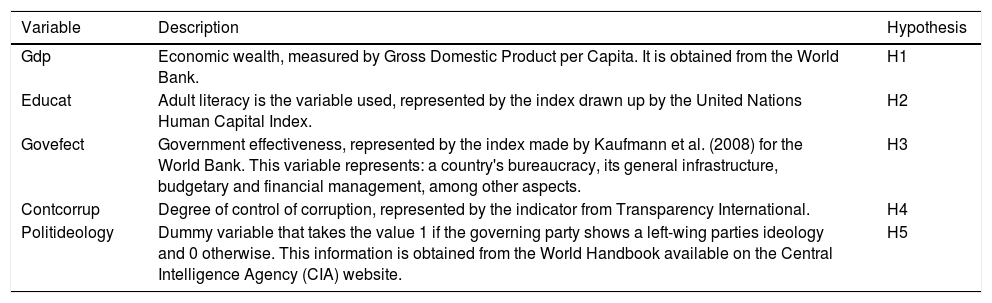
Independent and control variablesTable 1 shows the explanatory variables proposed to test the hypotheses outlined in section “Research hypotheses”: GDP, Educat, Govefect, Contcorrup and Politideology.
Independent variables.
| Variable | Description | Hypothesis |
|---|---|---|
| Gdp | Economic wealth, measured by Gross Domestic Product per Capita. It is obtained from the World Bank. | H1 |
| Educat | Adult literacy is the variable used, represented by the index drawn up by the United Nations Human Capital Index. | H2 |
| Govefect | Government effectiveness, represented by the index made by Kaufmann et al. (2008) for the World Bank. This variable represents: a country's bureaucracy, its general infrastructure, budgetary and financial management, among other aspects. | H3 |
| Contcorrup | Degree of control of corruption, represented by the indicator from Transparency International. | H4 |
| Politideology | Dummy variable that takes the value 1 if the governing party shows a left-wing parties ideology and 0 otherwise. This information is obtained from the World Handbook available on the Central Intelligence Agency (CIA) website. | H5 |
In addition and aiming to avoid biased results, several control variables are proposed related to institutional factors: country size, OECD, developing and emerging countries, regulatory quality, rule of law and political stability.
Country size, Size, is measured by population density. In this respect, Grafton and Knowles (2004), in an international study of 53 countries, propose that population size is a relevant factor for examining the environmental performance of a region or country. They also use the variables proposed in the ESI, namely an index anterior to the EPI. OECD is a dummy variable that takes the value 1 if the country belongs to the OECD and zero otherwise. Develcount is a dummy variable that takes the value 1 if the country belongs to the group of developing countries and zero otherwise. Emergmark is a dummy variable that takes the value 1 if the country belongs to an emerging market economy and zero otherwise.
Regulatory quality, Regquality, is another control variable used in this research to represent the ability of the government to implement and formulate sound policies and regulations that allow and promote the development of the private sector. This variable is measured by an index devised by Kaufmann et al. (2008) for the World Bank. Rulelaw was also developed by Kaufmann et al. (2008) to represent the trust that agents have for the norms and rules of society. Finally, Politstabi represents perceptions of the likelihood that the government will be destabilized or overthrown by unconstitutional or violent means, including politically motivated violence and terrorism. This variable is measured by an index devised by Kaufmann et al. (2008) for the World Bank.
Multivariate analysis: the HJ-Biplot techniqueThe analysis of several economic problems requires the storage of large volumes of data. To exploit the data and attain a better understanding of the behaviour of several processes, it is important to identify the salient features underlying them. This reduction in the dimensionality of the problem makes it possible to summarize the information captured by a large number of variables in a smaller number of variables. The technique chosen in this research is the biplot analysis, which has been used in other environmental studies (e.g. Aerni, 2009), but has not been applied to the EPI. This permits checking whether the indicators proposed by the EPI are similar in different countries, or in other words, whether environmental concerns are similar in different geographic areas.
According to Gabriel (1971), Gabriel and Odoroff (1990), Gower and Hand (1996), this technique consists of depicting graphically a data matrix X (nxp) derived from analysing n individuals according to p numerical characteristics. In this study, the n individuals are the 24 countries of Latin America presented in Appendix A, grouped into 3 geographic areas; the p numerical characteristics are the policy categories proposed in the EPI in the last available year (2010), essentially the environmental burden of disease, air pollution (effects on human health) and water pollution (effects on human health), air effects on ecosystems, water effects on ecosystems, biodiversity and habitat, productive natural resources (forestry, fisheries and agriculture) and climate change.
The biplot offers a visual representation (usually in two or three dimensions), based on two types of vectors derived from two types of information: individuals (in rows) and variables (in columns); in our research, these relate to 24 countries of Latin America and the policy categories proposed in the EPI. Hence, the vectors graphically represent individuals or rows and variables or columns. In Gabriel (1971) and Gabriel and Odoroff (1990), the method for obtaining the vectors is not specified and we therefore chose the least squares method and decomposition into vectors and singular values of X. However, it is argued that although this reflects the statistical and geometric properties of the variables adequately, individuals are not appropriately represented.
Galindo (1985) generalizes the concept of simultaneous representation by creating a new type of biplot, the HJ-Biplot, which is applicable to the whole data set, allowing individuals and variables to be represented with the same quality of representation. This improves on other approaches, such as that of Gabriel (1971) and Gabriel and Odoroff (1990). In this regard, Galindo (1985, 1986) defines the HJ-Biplot as a multivariate graphical representation of matrix X (nxp) through vectors for rows and for columns, so that both vectors can be depicted in the same reference systems with the highest quality of representation. Bachero, Esteban and Ivars (2000) define the HJ-Biplot as a multivariate technique derived from principal components analysis (PCA) with an important objective: to reduce the volume of data in order to obtain information. To achieve this aim, it is necessary to analyze the initial points in the cloud in hyperspace using a simplified configuration in a space of smaller dimensions.
In terms of the interpretation of biplots, points represent individuals (in our study, the countries grouped by geographic area) and axes reflect variables (in our study, certain variables related to environmental health and ecosystem services). According to Gower and Hand (1996), the interpretation is based on the angles between the vectors: variables with vectors displaying a small angle show similar behaviours, points of close individuals correspond to similar individuals and points of remote individuals depict non-similar individuals.
Also, if there is a small angle between an individual and a variable, it indicates that the individual is significant in explaining the variable and that the variable has a high value for the individual. The distance between the points reflects the variability of those points in the study. By analysing the length of the variables, we obtain their variability, providing an idea of the dispersion in the graphic. When the variables are close, they can be said to be highly correlated, with similar behaviour; when they take different directions, they are highly correlated in an inverse sense; if they are perpendicular, they are independent (Blasius, Eilers & Gower, 2009).
Regarding the angles, the smaller the angle between two vectors that join the centre of gravity with the points representing the variables, the more concentrated the characters; ultimately, the covariance of variables is obtained by observing the angle.
The software used to implement the HJ-Biplot was developed by Vicente-Villardón (2010) and contains the classical biplot, HJ biplots and simple correspondence analysis of a contingency table. Other statistical programmes for biplots developed by InfoStat (2004) and by Rohlf (2002) have also been used.
Regression model of analysisIn addition to the HJ-Biplot analysis, we also propose a regression model to check our research hypotheses. From the aforementioned dependent, independent and control variables, we propose the following model (1) in which the EPI index is a function of the socioeconomic and institutional factors of a country. The objective of the dependency models is to predict the impact of a set of explanatory variables, considered simultaneously, on the environmental performance of a country according to the EPI. Therefore, this model serves to demonstrate empirically which variables most affect environmental performance. Herein, EPI=f (economic wealth, education, government effectiveness, degree of control of corruption, left-wing, size, OECD and non-OECD countries, developing countries, emerging markets, regulatory quality, rule of law, political stability). Concretely, model (1) can be estimated empirically using Eq. (1):
where Envperindexi is the environmental performance index; GDPi is economic wealth measured by GDP per capita; Educati is adult literacy represented by the UN Human Capital Index; Govefecti is government effectiveness, represented by the index developed by Kaufmann et al. (2008) for the World Bank; Contcorrupi is the degree of control of corruption represented by the indicator used by Transparency International; Politideologyi is a dummy variable that takes the value 1 if the ruling party is left-wing, and zero otherwise; Sizei is the size of the public body measured by population density; OECDi is a dummy variable that takes the value 1 if the country belongs to the OECD, and 0 otherwise; Develcounti is a dummy variable that takes the value 1 if the country belongs to a developing country, and zero otherwise; Emergmarki is a dummy variable that takes the value 1 if the country belongs to an emerging market economy, and zero otherwise; Regqualityi is regulatory quality represented by the index created by Kaufmann et al. (2008) for the World Bank; Rulelawi is rule of law represented by the index created by Kaufmann et al. (2008) for the World Bank; Politstabii is political stability, represented by the index devised by Kaufmann et al. (2008) for the World Bank.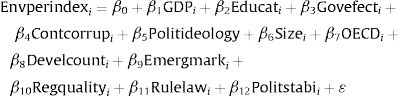
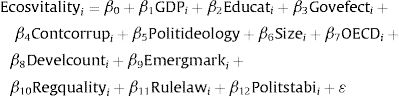
Model (1) and Eq. (1) are complemented by the subcategories of the EPI. In this regard, we propose two additional models in which the dependent variables are Envirhealth and Ecosvitality. Thus, Eqs. (2) and (3) are as follows:
where Envirhealth is the environmental health index and Ecosvitality is the ecosystem vitality index.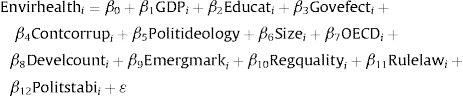
The decision of which analytic technique should be used depends on the nature of the dependent variable and the type of function that is proposed to relate X and Y. In this case, because the dependent variables in this study, Envperindex, Envirhealth and Ecosvitality take values in a specific range [0–100], they are left- and right-side censored. Thus, the above models were checked empirically through Tobit regressions. According to the maximum likelihood method, the Tobit models provide efficient, consistent estimates of coefficients because when the likelihood function is maximized, it incorporates information from both censored and uncensored observations. The basic Tobit model supposes that there is a latent variable (yit*) that can be explained by observable variable(s) (xit).
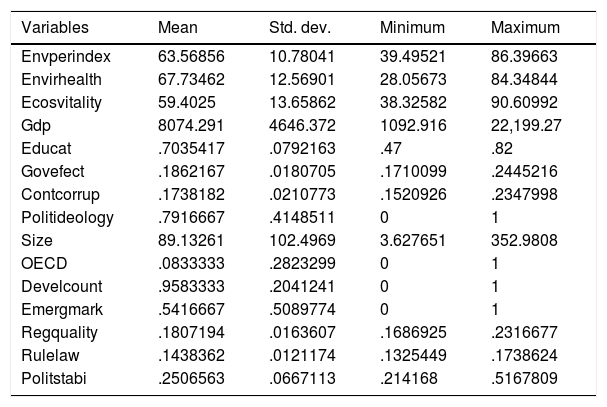
Results of empirical analysisUnivariate analysis: mean, standard deviation and correlation matrixTable 2 shows the descriptive statistics of the dependent, independent and control variables, including the minimum, maximum, mean and standard deviation values. As can be seen from the table, there is a wide dispersion in terms of economic wealth measured by GDP per capita; specifically, there are minimum values of 1092.916 and maximum values of 22,199.27. Similarly, the variable Size has a population density of 3.627651 minimum and 352.9808 maximum. On average, environmental performance is 63.56856, with a minimum value of 39.49521 and a maximum value of 86.396632.
Descriptive statistics.
| Variables | Mean | Std. dev. | Minimum | Maximum |
|---|---|---|---|---|
| Envperindex | 63.56856 | 10.78041 | 39.49521 | 86.39663 |
| Envirhealth | 67.73462 | 12.56901 | 28.05673 | 84.34844 |
| Ecosvitality | 59.4025 | 13.65862 | 38.32582 | 90.60992 |
| Gdp | 8074.291 | 4646.372 | 1092.916 | 22,199.27 |
| Educat | .7035417 | .0792163 | .47 | .82 |
| Govefect | .1862167 | .0180705 | .1710099 | .2445216 |
| Contcorrup | .1738182 | .0210773 | .1520926 | .2347998 |
| Politideology | .7916667 | .4148511 | 0 | 1 |
| Size | 89.13261 | 102.4969 | 3.627651 | 352.9808 |
| OECD | .0833333 | .2823299 | 0 | 1 |
| Develcount | .9583333 | .2041241 | 0 | 1 |
| Emergmark | .5416667 | .5089774 | 0 | 1 |
| Regquality | .1807194 | .0163607 | .1686925 | .2316677 |
| Rulelaw | .1438362 | .0121174 | .1325449 | .1738624 |
| Politstabi | .2506563 | .0667113 | .214168 | .5167809 |
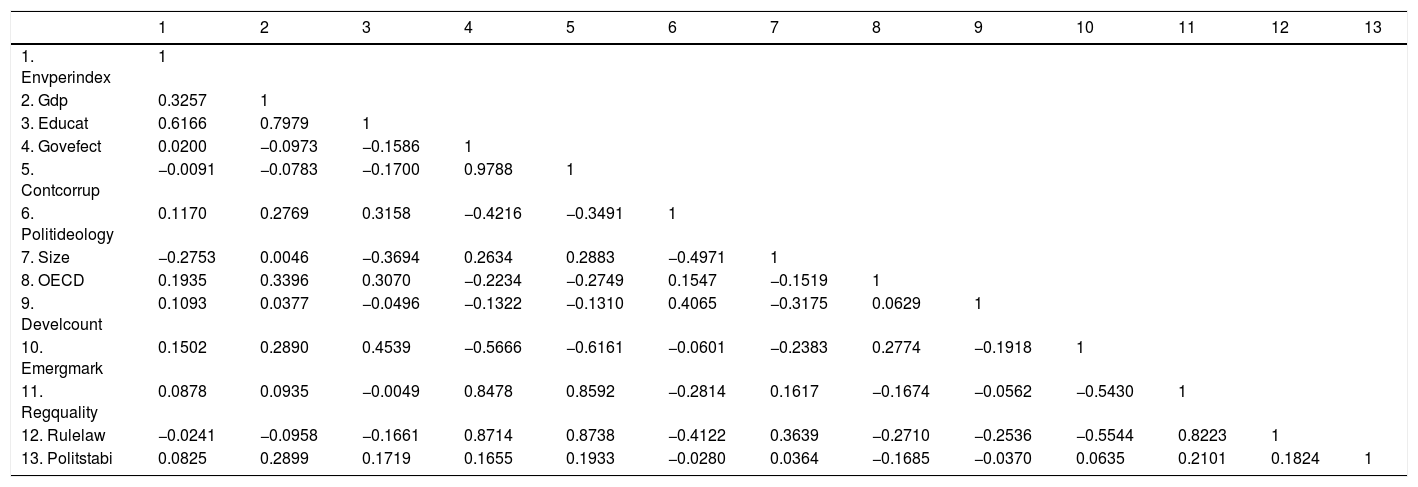
Table 3 shows the correlation matrix, which points to the non-existence of high correlations between the dependent variable and the independent and control variables. There is no multicollinearity problem among the variables used in this research.
Correlation matrix.
| 1 | 2 | 3 | 4 | 5 | 6 | 7 | 8 | 9 | 10 | 11 | 12 | 13 | |
|---|---|---|---|---|---|---|---|---|---|---|---|---|---|
| 1. Envperindex | 1 | ||||||||||||
| 2. Gdp | 0.3257 | 1 | |||||||||||
| 3. Educat | 0.6166 | 0.7979 | 1 | ||||||||||
| 4. Govefect | 0.0200 | −0.0973 | −0.1586 | 1 | |||||||||
| 5. Contcorrup | −0.0091 | −0.0783 | −0.1700 | 0.9788 | 1 | ||||||||
| 6. Politideology | 0.1170 | 0.2769 | 0.3158 | −0.4216 | −0.3491 | 1 | |||||||
| 7. Size | −0.2753 | 0.0046 | −0.3694 | 0.2634 | 0.2883 | −0.4971 | 1 | ||||||
| 8. OECD | 0.1935 | 0.3396 | 0.3070 | −0.2234 | −0.2749 | 0.1547 | −0.1519 | 1 | |||||
| 9. Develcount | 0.1093 | 0.0377 | −0.0496 | −0.1322 | −0.1310 | 0.4065 | −0.3175 | 0.0629 | 1 | ||||
| 10. Emergmark | 0.1502 | 0.2890 | 0.4539 | −0.5666 | −0.6161 | −0.0601 | −0.2383 | 0.2774 | −0.1918 | 1 | |||
| 11. Regquality | 0.0878 | 0.0935 | −0.0049 | 0.8478 | 0.8592 | −0.2814 | 0.1617 | −0.1674 | −0.0562 | −0.5430 | 1 | ||
| 12. Rulelaw | −0.0241 | −0.0958 | −0.1661 | 0.8714 | 0.8738 | −0.4122 | 0.3639 | −0.2710 | −0.2536 | −0.5544 | 0.8223 | 1 | |
| 13. Politstabi | 0.0825 | 0.2899 | 0.1719 | 0.1655 | 0.1933 | −0.0280 | 0.0364 | −0.1685 | −0.0370 | 0.0635 | 0.2101 | 0.1824 | 1 |
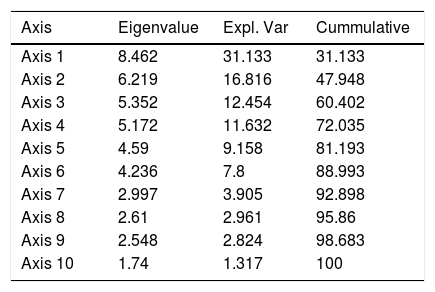
This section presents results in the various tables and figures obtained from the multbiplot software. According to Galindo (1986), several measures are essential for the correct implementation of HJ-Biplot: specifically, eigenvalues and explained variance (Table 4) and the relative contribution of the factor to the element (Table 5), through which it is possible to detect the variables responsible for the position of the axes and thus their configuration.
Eigenvalues and explained variance.
| Axis | Eigenvalue | Expl. Var | Cummulative |
|---|---|---|---|
| Axis 1 | 8.462 | 31.133 | 31.133 |
| Axis 2 | 6.219 | 16.816 | 47.948 |
| Axis 3 | 5.352 | 12.454 | 60.402 |
| Axis 4 | 5.172 | 11.632 | 72.035 |
| Axis 5 | 4.59 | 9.158 | 81.193 |
| Axis 6 | 4.236 | 7.8 | 88.993 |
| Axis 7 | 2.997 | 3.905 | 92.898 |
| Axis 8 | 2.61 | 2.961 | 95.86 |
| Axis 9 | 2.548 | 2.824 | 98.683 |
| Axis 10 | 1.74 | 1.317 | 100 |
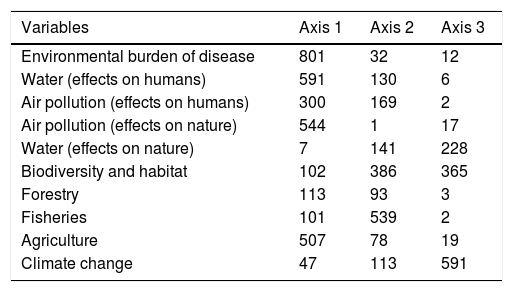
Relative contribution of the factor to the element.
| Variables | Axis 1 | Axis 2 | Axis 3 |
|---|---|---|---|
| Environmental burden of disease | 801 | 32 | 12 |
| Water (effects on humans) | 591 | 130 | 6 |
| Air pollution (effects on humans) | 300 | 169 | 2 |
| Air pollution (effects on nature) | 544 | 1 | 17 |
| Water (effects on nature) | 7 | 141 | 228 |
| Biodiversity and habitat | 102 | 386 | 365 |
| Forestry | 113 | 93 | 3 |
| Fisheries | 101 | 539 | 2 |
| Agriculture | 507 | 78 | 19 |
| Climate change | 47 | 113 | 591 |
From Table 4 it can be deduced that there is a dominant axis (1) that takes 31.133% of the total inertia of the system and also that the trend in the eigenvalues is truncated in the fourth axis, achieving an accumulative inertia of 72.035. The remaining factors provide a lower information load; therefore, we opt to retain the first three factorial axes for the classification. Table 5 presents the contribution of each factor to the element, which lets us know the variables responsible for the positions of the axes and their configuration.
Hence, the variables Environmental burden of disease, Water (effects on humans) and Air pollution (effects on nature) make a high contribution to Axis 1 and a low contribution to the remaining axes. At the same time, Climate change displays a higher contribution to Axis 3 and Biodiversity and habitat and Fisheries present a high contribution to Axis 2.
When analysing the contributions to the different axes, the first axis is explained by most indicators linked to environmental health, such as the environmental burden of disease and water pollution effects on human health (801, 591), in addition to air pollution (effects on nature) and agriculture (544, 507). The second factorial axis is almost exclusively determined by Biodiversity and habitat and Fisheries (383, 539). As for the third factorial axis, only Climate change stands out.
Regarding the plot, the graphic representation of the three geographical areas that include the countries analyzed are presented in Fig. 1. This figure shows the location of three geographical areas of our biplot in the countries analyzed.

All the countries grouped into three geographical areas are represented by points (in Fig. 1, +) in four quadrants. In quadrants 1 (upper-right) and 3 (lower-left), the countries most represented correspond to the area of South America; in quadrant 2 (upper-left) those most represented are those from the Caribbean; in quadrant 4 (lower-right) they are those from Mesoamerica.
In Fig. 2, the following variables are displayed: Environmental burden of disease, Air pollution (effects on human health) and water pollution (effects on human health), Air effects on ecosystems, Water effects on ecosystems, Biodiversity and habitat, Productive natural resources (forestry, fisheries and agriculture) and Climate change. The first three variables concern environmental health, while the remaining variables are associated with ecosystem services, according to the EPI.

As commented above, the interpretation of the variables is based on the angles between the vectors, such that variables with vectors forming small angles are those with similar behaviours. As can be seen in Fig. 2, the variables linked to environmental health, such as Environmental burden of disease and Water pollution (effects on human health), show small angles and therefore exhibit similar behaviours. Similarly, for ecosystem services (variables: Climate change, Biodiversity and habitat and Fisheries), the variables are quite close, also showing a small angle. Hence, they are highly correlated and behave in a similar way. Moreover, we clearly observe two easily identifiable slopes, the variables close to Axis 1 or the horizontal axis, representing environmental health (Environmental burden of disease and Water effects on human health) and the variables close to Axis 2 or the vertical axis, representing ecosystem vitality (Water effects on nature, Climate change, Biodiversity and habitat and Fisheries).
In Fig. 3, the geographic areas and the variables representing environmental health and ecosystem services are displayed jointly.

In Fig. 3 the geographic areas represented by points (+) and the variables (vectors) representing environmental health and ecosystem vitality are displayed jointly. According to the interpretation, if there is a small angle between an individual and a variable, it means that the individual is significant in explaining the variable and that the variable is of great value for the individual.
In this figure, it can also be observed that the variables relating to environmental health (Environmental burden of disease and Water pollution effects on human health) are more closely related to countries located in the geographic area of the Caribbean (Cuba, the Dominican Republic, Haiti, Jamaica and Trinidad and Tobago). In contrast, other variables associated with ecosystem services, such as Air pollution (effects on nature), are more closely related to Mesoamerica, consisting of Costa Rica, Honduras, Panama and other countries. The South American countries are shown to be more concerned with climate change and air pollution (effects on humans); among the countries included in this area are Argentina, Chile and Brazil. The results shown in Fig. 3 confirm that Latin America is widely accepted as a repository for some of the world's richest biodiversity, containing 40% of the Earth's plant and animal species and probably the highest flora diversity in the world.
To validate the results obtained as far as geographical areas and variables are concerned, we applied cluster analysis, taking as the basis the information supplied by the HJ-Biplot. By applying this technique, we obtain the possible groupings of the geographical areas of Latin America as a function of the variables that represent environmental health and ecosystem services and we can then determine which variables are responsible for the different groupings. Jain and Dubes (1988) define cluster analysis as a data exploration tool that is complemented with techniques for visualizing the data in a simpler way. What cluster analysis does is seek natural groupings from a set of individuals. This set can be made up of a population or a sufficiently representative sample of the population. Fig. 4 presents the geographic areas and the variables representing environmental health and ecosystem services in clusters.

An analysis of Fig. 4 shows that there are three well-defined clusters. Cluster 1 is represented by the Latin American countries pertaining to the geographical area of Mesoamerica; Cluster 2 groups the countries located in the geographical area of South America; Cluster 3 corresponds to the geographical area of the Caribbean. At the same time and coinciding with the HJ-Biplot analysis, the same variables can be corroborated as predominant in each of the areas. This result reinforces and adds robustness to the previous analysis.
In Fig. 4, it can also be observed that the variables related to environmental health are more closely related to the countries located in the geographic areas of the Caribbean and to a lesser extent to countries in South America. Other variables associated with ecosystem vitality are more closely related to Mesoamerica and South America. This corresponds to the multivariate analysis (Fig. 3, factorial plane 1–2, including the countries and the indicators in the EPI), which provided two easily identifiable slopes, the variables close to Axis 1 or the horizontal axis, representing environmental health and the variables close to Axis 2 or the vertical axis, representing ecosystem vitality.
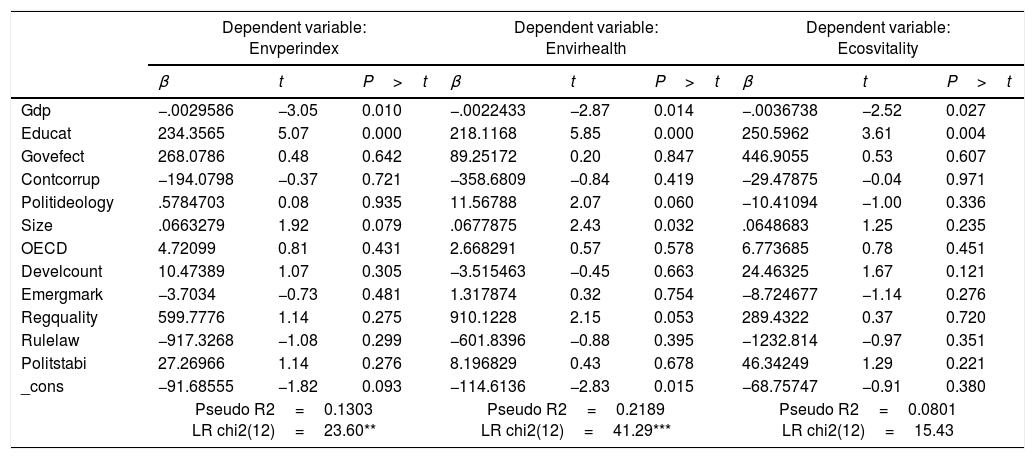
Regression analysisThe results obtained in the estimation of model (1) proposed using Tobit regression are synthesized in Table 6, corresponding to Eqs. (1)–(3). The model estimated to determine the explanatory factors of the countries’ EPI (Envperindex) has an explanatory power of 13.03%, with a 95% confidence interval (CI). In terms of the explanatory power of the independent and control variables, two of the five independent variables proposed are statistically significant. More specifically, statistically significant negative effects are detected for GDP (95% CI) and statistically significant positive effects are detected for Educat (95% CI). In contrast, the independent variables Govefect, Contcorrup and Politideology display non-significant effects. Concerning the control variables, Size shows a significant and positive effect regarding the dependent variable, EPI; in contrast, the rest of the control variables show a non-significant effect with regard to the dependent variable.
Regression analysis.
| Dependent variable: Envperindex | Dependent variable: Envirhealth | Dependent variable: Ecosvitality | |||||||
|---|---|---|---|---|---|---|---|---|---|
| β | t | P>t | β | t | P>t | β | t | P>t | |
| Gdp | −.0029586 | −3.05 | 0.010 | −.0022433 | −2.87 | 0.014 | −.0036738 | −2.52 | 0.027 |
| Educat | 234.3565 | 5.07 | 0.000 | 218.1168 | 5.85 | 0.000 | 250.5962 | 3.61 | 0.004 |
| Govefect | 268.0786 | 0.48 | 0.642 | 89.25172 | 0.20 | 0.847 | 446.9055 | 0.53 | 0.607 |
| Contcorrup | −194.0798 | −0.37 | 0.721 | −358.6809 | −0.84 | 0.419 | −29.47875 | −0.04 | 0.971 |
| Politideology | .5784703 | 0.08 | 0.935 | 11.56788 | 2.07 | 0.060 | −10.41094 | −1.00 | 0.336 |
| Size | .0663279 | 1.92 | 0.079 | .0677875 | 2.43 | 0.032 | .0648683 | 1.25 | 0.235 |
| OECD | 4.72099 | 0.81 | 0.431 | 2.668291 | 0.57 | 0.578 | 6.773685 | 0.78 | 0.451 |
| Develcount | 10.47389 | 1.07 | 0.305 | −3.515463 | −0.45 | 0.663 | 24.46325 | 1.67 | 0.121 |
| Emergmark | −3.7034 | −0.73 | 0.481 | 1.317874 | 0.32 | 0.754 | −8.724677 | −1.14 | 0.276 |
| Regquality | 599.7776 | 1.14 | 0.275 | 910.1228 | 2.15 | 0.053 | 289.4322 | 0.37 | 0.720 |
| Rulelaw | −917.3268 | −1.08 | 0.299 | −601.8396 | −0.88 | 0.395 | −1232.814 | −0.97 | 0.351 |
| Politstabi | 27.26966 | 1.14 | 0.276 | 8.196829 | 0.43 | 0.678 | 46.34249 | 1.29 | 0.221 |
| _cons | −91.68555 | −1.82 | 0.093 | −114.6136 | −2.83 | 0.015 | −68.75747 | −0.91 | 0.380 |
| Pseudo R2=0.1303 LR chi2(12)=23.60** | Pseudo R2=0.2189 LR chi2(12)=41.29*** | Pseudo R2=0.0801 LR chi2(12)=15.43 | |||||||
The overall results obtained for the model estimated allow us to accept H2, namely that there is a positive relationship between the level of education in a country and the EPI. In addition, we can accept H1, but with the opposite sign to that expected, i.e. the economic wealth of a country shows a significant and negative relationship with its EPI. This result can be justified because although countries can invest money in improving their environmental impact, they also tend to create environmental problems due to their high level of consumption; this causes an increase in pollution and waste levels. Authors such as Janh (1998) have also obtained similar results for other countries, including Germany, Japan, Canada, the United States and Switzerland. In our research, although the geographical environment is different, we have countries considered to be emerging market economies with great economic potential such as Brazil, Argentina, Mexico and Chile. The other hypotheses (H3, H4 and H5) are rejected because of the lack of statistical significance of the variables proposed to test them.
Concerning the multivariate analysis (Fig. 3, factorial plane 1–2, including the countries and the indicators in the EPI), which provided two easily identifiable slopes, the variables close to Axis 1 or the horizontal axis, representing environmental health, and the variables close to Axis 2 or the vertical axis, representing ecosystem vitality, the EPI (Envperindex) as overall index is also divided into two dimensions that are exactly the same. We broke down the initial regression model into two models as described in section “Sample, variables and methodology”, one in which the dependent variable was environmental health (Envirhealth) and the other in which the dependent variable was ecosystem vitality (Ecosvitality). This provides a better understanding of how the different explanatory variables affect the two large components of the EPI.
The results of the regression analysis show that the dependent variable environmental health (Envirhealth) provides a better model with an explanatory power of 21.89% (99% CI). Three of the five independent variables proposed are statistically significant. More specifically, there is a statistically significant negative effect for GDP (99% CI) and a statistically significant positive effect for Educat (99% CI). In addition, Politideology shows a statistically significant positive effect (90% CI). In contrast, the independent variables Govefect and Contcorrup show a non-significant effect. Concerning the control variables, Size and Regquality show a significant and positive effect regarding the dependent variable, but the other control variables show a non-significant effect with regard to the dependent variable environmental health (Envirhealth). Accordingly, when the ruling party is left-wing, education and political ideology are the variables that most influence the environmental health of the countries.
With respect to the model representing ecosystem vitality, that is, when the dependent variable only includes aspects related to reducing the loss or degradation of ecosystems and natural resources, the relation is significant but negative. Thus, H1 is fulfilled but with the opposite sign to the one posited. That is, if economic growth represented by GDP increases, Ecosvitality decreases; in the case of Educat, H2 is accepted with regard to positive relationships between the level of education of a country and ecosystem vitality (see Table 6, third column).
Discussion of resultsThe findings in this study increase our knowledge of environmental performance in general and EPI in particular; through the HJ-Biplot methodology, we were able to obtain a picture of the environmental situation of Latin American countries. We have jointly used economic and institutional variables to see which exert more influence on environmental performance.
Regarding the effect of education on environmental performance, the results obtained in our research corroborate those of Duit (2005), who considers that citizens with a higher level of culture and education can be assumed to be in a better position to initiate and implement environmental cooperation schemes of their own. Likewise, Morse (2013) considers that education can entail social benefits such as a greater awareness of environmental issues, leading to greater citizenship participation in the social and environmental commitments of a country.
Regarding the effect of economic wealth, our results show a statistically significant but negative relation to the environmental performance of the countries against the results obtained by other authors such as Cracolici et al. (2010); they found that the per capita GDP of a country is an important aspect if it is to provide its citizens with good living conditions and sound social and environmental performance. Other authors such as Esty and Porter (2005) also consider that rich countries are those that have the greatest economic capacity to invest in environmental aspects, such as pollution control and other measures to improve the environment. Using a sample of several countries, such authors have found a positive relationship between GDP and EPI. In our research, the relationship between the two variables is significant but negative. This may be due to the fact that the country's wealth is not the only variable that must be analyzed when considering countries’ environmental performance; indeed, education, the political regime and population density are factors that currently have great relevance and should be considered in studying the EPI (Fiorino, 2011). This is the case for the countries under study, for which we have found that both education and population density (Size) are positive and statistically significant variables; the same applies to the political regime when it is considered as a dependent variable.
Another of the variables analyzed in terms of government effectiveness (Envirhealth) turns out to be non-significant, contrary to the results obtained by Esty et al. (2008). These authors obtained a significant and positive relationship. The lack of significance can be justified because in the research carried out by these authors, government effectiveness positively correlates with performance on greenhouse gas emissions per capita, health, ozone and water quality indicators, that is, variables that represent ecosystem vitality, the objective of which is to reduce loss or degradation of ecosystems and natural resources. In our research, we considered environmental health and for this reason the hypothesis posed initially was not fulfilled.
Regarding political ideology, the results obtained do not show a statistically significant relationship; this result is in line with that obtained by Wälti (2004), who considers that party politics seems to have no impact on environmental performance. One reason for such results may be that many studies only consider aspects related to ecosystem vitality, such as greenhouse gas emissions, deforestation, sulphur dioxide, etc., which we did include in our research, but not environmental health specifically. In the case of considering environmental health as a dependent variable, there is a positive and significant relationship, obtaining the same results as Neumayer (2003) for political ideology, namely a positive effect between green/left-wing liberal parties and emissions reductions. In short, the results obtained agree with prior proposals that governments of a leftist tendency tend to carry out programmes or activities aimed at attaining good environmental performance, especially related to environmental health. In contrast, those who with other types of ideologies concentrate more frequently on social policies. In relation to the control variables, Size presents a statistically positive relation with EPI as in previous studies, such as that of Grafton and Knowles (2004).
According to the results of this study, ecological modernization theory best fits our research as in addition to economic aspects, other aspects are also considered to determine the EPI of countries, such as the role of science and technology, the importance of market dynamics, the role of economic agents and the ideology of social movements (Mol & Sonnenfeld, 2000). Therefore, we can indicate that along with economic factors it is necessary to consider other aspects that can affect the EPI (e.g. political factors, structural factors, competitiveness), as manifested in studies such as that of Esty and Porter (2005). These authors find significant differences in the environmental performance of countries with similar economic levels, which suggests that environmental outcomes do not simply depend on economic development, but also on other institutional, political or structural factors.
In addition to the initial model, the results obtained by applying the HJ-Biplot methodology add more detail to the research as two easily identifiable slopes were obtained: variables close to axis 1 or the horizontal axis (representing environmental health) and variables close to axis 2 or the vertical axis (representing ecosystem vitality). Since EPI is also divided into two dimensions that exactly coincide with these slopes, decomposing the initial regression model into two models based on the subcategories provides a better understanding of how the different explanatory variables affect the two main components of the EPI.
The results we obtain when environmental performance is separated into its two components, environmental health and ecosystem vitality, are consistent with the findings by Jahn (1998), who considers that although countries may be able to invest money to improve their environment, they also tend to create environmental problems owing to the their high level of consumption, which can lead to an increase in their pollution levels, thereby also generating more waste and using up more natural resources. Thus, Jahn (1998) found that in rich countries, such as Germany, Japan, Canada, the United States and Switzerland, there was no relation between a country being wealthier and the EPI.
Other important aspect that arises from the analysis of environmental health is that certain factors are more important for the countries located in the geographical area of the Caribbean (Cuba, the Dominican Republic, Haiti, Jamaica and Trinidad and Tobago). For Mitra and Rodríguez-Fernández (2010), the proximity of these variables concerning environmental health to the geographical area of the Caribbean can be explained by the immense importance of tourism in this area, especially for countries in the Caribbean such as the Dominican Republic. During the last 20–30 years, this situation has also meant an increase in job opportunities in the cities associated with expanding tourism, while textile industries have stimulated rural–urban migration and forest recovery on the abandoned lands in the mountains.
For other regions of Latin America, factors associated with ecosystem vitality, such as climate change, are interesting for the agricultural system in South America, as Seo (2010, p. 506) found in his research, which indicated “that current choices and land values of agricultural systems across South America are sensitive to climate”. The main objective of the countries in South America is to combat desertification and mitigate the effects of drought through effective action at all levels, with a view to contributing to sustainable development in affected areas to ensure long-term security. This is of particular importance in relation to climate indicators such as temperature, precipitation and evaporation, which are the components of the aridity index used to delimit the arid, semi-arid and the dry sub-humid areas in the region. The global warming trend is likely to change the distribution patterns of such indicators and redefine the boundaries of the aforementioned areas. These changes, as predicted by future scenarios, should be given due consideration in the formulation of public policies towards combating desertification.
Other variables associated with ecosystem vitality, such as air pollution (effects on nature), are of more concern in Mesoamerica. One of the greatest worries there is that the air enters cities in a relatively clean state through the semi-rural and economically sound middle-class area and leaves through the developing neighbourhoods with a significant number of pollutants (Bustamante, Monge & Gonzalez, 2011). According to Corbera, Kosoyc and Martínez (2007), it is necessary to increase spending on the conservation of natural resources in some countries of Mesoamerica, whereas others require financial sustainability to consolidate their efforts in this regard.
Our findings show the great importance of environmental concerns in Latin American countries. Three aspects are involved in this phenomenon: first, there is personal concern that predisposes human beings to protect the aspects of the natural environment that directly affect them; second, there is the social aspect, whereby people consider how the environment affects other persons and communities; finally, there is purest environmental aspect, which affects all things.
ConclusionsThis research has focused on analysing the economic and institutional aspects that influence the environmental performance of a group of 24 countries in Latin America. Economic theory and ecological modernization theory have been discussed, considering that within economic theory it is important to highlight arguments related to the market; that is, the objective of environmental information is to offer useful data to shareholders and capital markets, since this can influence the positive or negative valuation of shares (Ortas & Moneva, 2011).
In this paper, environmental performance was measured by the EPI devised by Esty et al. (2008). The findings obtained from the empirical analysis point to socioeconomic factors, such as education, being determinant factors of environmental performance in Latin American countries. In addition, the variable related to political ideology influences environmental performance when analysing the environmental health of countries. Size also positively influences the EPI and thus the country's wealth is not the only variable that must be analyzed when considering the environmental performance of a country. In accordance with these results, education, the political regime and population density are factors that are currently of great relevance and must be considered in studying such performance (Fiorino, 2011).
This research generates a series of novel contributions in relation to previous research. First, different types of economic and institutional factors are examined. We reinforce the previous literature on the subject that has only analyzed one type of determinant, whether of an economic or institutional nature, or has presented only a theoretical perspective. Second, the study is contextualized in the environment specifically related to Latin American countries. Third, in this regard, the HJ-Biplot methodology is used, which provides a graphic representation of the difference in the environmental performance of the countries in relation to two aspects of great relevance currently, namely environmental health on the one hand and ecosystem vitality on the other. This classification coincides with the division of dimensions in the EPI.
Fourth, in addition to the biplot analysis, we analyzed different models of dependence through Tobit regression with the purpose of examining which economic and institutional factors had a greater impact on environmental performance. In this regard, we show that economic factors, such as educational level, play a fundamental role in environmental performance and its components. In addition, in the study of the determinants of environmental health as a subcategory, we have shown that education is conjoined with political ideology as a determining factor when the ruling party is left-wing. Fifth, we contribute to the prior literature by obtaining empirical support for ecological modernization theory. In addition to economic aspects, other aspects are considered to determine the environmental performance of countries, namely institutional, political and structural factors.
The results obtained offer real-world implications for the countries of Latin America and can be useful for policymakers. The governments of these countries should make a greater effort to address educational issues and concerns, because if a country's income is not sufficiently high to ensure sustainability, a good educational grounding can be the best alternative. Population density is also an important factor to be considered in order to achieve sound environmental performance as it has been evidenced in our research. This may be due to the fact that this variable is very heterogeneous among the different countries in the sample, especially noting Guyana, which has a very low population density (3.63), and Haiti, which has a very high population density (352.98). Therefore, it can be argued that improvements in environmental performance can best be achieved by limiting future increases in population density.
Another important aspect is the political regime of the countries, with democratic regimes showing higher levels of environmental performance than authoritarian regimes. These results can be attributed to the availability of information, the opportunities to demonstrate and the independence of scientific researchers. In addition, governments must also bear in mind that the wealth of a country does not always lead to better environmental performance. The reason for this may be that although countries can invest money in improving their environment, they also tend to create environmental problems due to their high level of consumption. They have higher levels of pollution, through generating more waste and the use of more natural resources. The truth is that having an effective government leads to better environmental performance. Therefore, an effective, innovative and adaptable government is a necessary condition for countries to achieve a transition towards sustainability. As has been argued in this research, for Fiorino (2011), among the aspects that should be considered by governments are the integration of policies, the improvement of social capital, the improvement of participation and the adoption and implementation of elections in a more adaptive manner.
Considering the aforementioned points, it is necessary to point to possible future research that will resolve some of the limitations of this paper. First, it is necessary to consider factors other than those analyzed in this research, which might act as determinants of environmental performance. Second, it would be interesting – and indeed might be necessary – to extend the sample to countries from different continents to offer results that are more generalizable. In addition to increasing the number of countries analyzed, the temporal period should be increased. In this regard, obtaining panel data would offer research results with greater predictive capacity and empirical richness. Finally, continuing a line of research on this subject in an attempt to ensure environmental sustainability should be one of the priorities of environmental authorities around the world.
Conflict of interestThe authors declare no conflicts of interest.