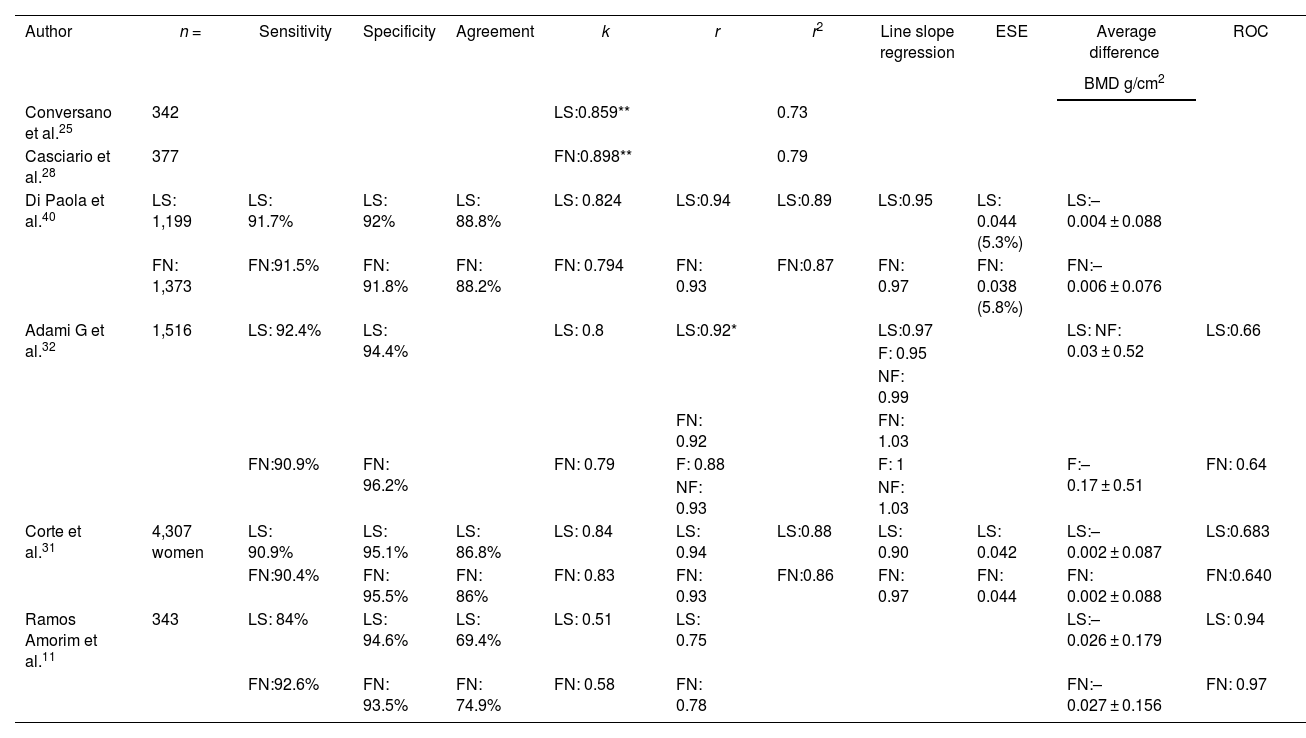
Osteoporosis is a skeletal disorder characterized by decreased bone mineral density (BMD) and a disruption of bone microarchitecture, leading to an increased fracture risk. Traditionally, BMD has been measured using X-ray densitometry (DXA). However, Radiofrequency Echographic Multi Spectometry (REMS) has emerged as a promising technique for the assessment of osteoporosis. Various studies have evaluated the feasibility and precision of REMS, showing significant correlations with DXA in different anatomical sites and populations, including post-menopausal women, renal transplant patients, and those with rheumatoid arthritis, among others. REMS has also demonstrated the ability to detect bone artifacts and provide reliable measurements in their presence. While DXA remains the gold standard for diagnosing osteoporosis, REMS has proven to be an effective and promising tool in assessing BMD and fracture risk. Its capability to rule out artifacts and offer precise measurements in diverse populations highlights its potential as a complement or alternative in the evaluation of osteoporosis.
La osteoporosis es una enfermedad esquelética caracterizada por una disminución de la densidad mineral ósea (DMO) y la alteración de la microarquitectura ósea, lo que resulta en un incremento del riesgo de fractura. Tradicionalmente, se ha medido haciendo una densitometría por rayos X (DXA). Sin embargo, la multiespectrometría ecográfica por radiofrecuencia (REMS) ha emergido como una técnica prometedora para la evaluación de esta enfermedad. Diferentes estudios han evaluado la factibilidad y la precisión del REMS, y han mostrado correlaciones significativas con DXA en diferentes sitios anatómicos y distintas poblaciones, incluyendo mujeres postmenopáusicas, hombres, pacientes con artritis reumatoide y trasplantados renales, entre otros. El REMS también ha demostrado su capacidad para detectar artefactos óseos y proporcionar mediciones confiables en su presencia. Aunque la DXA sigue siendo el estándar de oro para el diagnóstico de la osteoporosis, el REMS se ha revelado como una herramienta eficaz y prometedora en la valoración de la DMO y el riesgo de fractura. Su capacidad para descartar artefactos y ofrecer mediciones precisas en diversas poblaciones resalta su potencial como complemento o alternativa a la evaluación de la osteoporosis.
Osteoporosis is a systemic skeletal disease that increases the risk of fractures due to decreased bone mass and deterioration of bone microarchitecture.1 Bone mineral density (BMD) measured by X-ray densitometry (DXA) is considered the gold standard for diagnosing this condition. However, it has limitations, such as its reliance on radiation and the potential for errors in the acquisition and interpretation of densitometric images.2 Although DXA radiation exposure is relatively low, it should not be considered entirely risk-free; it is essential to follow the principle of keeping it "as low as reasonably achievable”.1,3
The Food and Drug Administration (FDA) approved DXA measurement of BMD in 1988. In 1994, the World Health Organization (WHO) defined osteoporosis based on the T-score, which compares a patient’s BMD with a young adult reference population.4 The disease is diagnosed when BMD is 2.5 standard deviations below the mean for a young adult.4,5 Despite this precise definition, its sensitivity is limited, and many patients with fractures do not meet this criterion.6
The reference points for BMD measurements are the hip and spine, as fractures in these areas are the most accurate predictors of osteoporotic fractures. Additionally, fractures in these anatomical sites significantly impair quality of life.7,8 These regions are also preferred for monitoring due to their high sensitivity to changes in bone density.8
BMD obtained by DXA reflects only a portion of bone strength, which is determined by the sum of several skeletal characteristics. These characteristics are divided into four main components: composition, microarchitecture, size, and shape. Studies have shown that BMD accounts for only 50–70% of the variation in bone strength, as it describes aspects related to the quantity of bone tissue but tends to overestimate information about bone quality. Factors such as geometry, morphology, microarchitectural parameters, the density of trabecular and cortical compartments, and elastic properties are not assessed by current DXA methods, which could explain why many fractures occur in patients whose bone densitometries do not indicate osteoporosis.9,10
Among the disadvantages of DXA are its reliance on X-rays, lack of portability, the need for highly specialized personnel, and the requirement for a specific location with enough space to ensure the operator is more than 1 m away from the equipment. Furthermore, DXA quality control can be compromised by issues in both pre- and post-processing image.10,11
In fact, many DXA results contain errors (over 90% in one study), mainly due to problems in analysis, interpretation, patient positioning (9% of femoral acquisitions and 8% of lumbar acquisitions), artifacts (such as osteophytes, aortic calcifications, and fractures), and demographic errors.10,12,13 Post-acquisition errors can also occur, such as the need for the technician to relocate the automatic identification of the region of interest (ROI) to ensure a reliable result.10
Many patients are neither assessed nor treated for osteoporosis, and the lack of screening and diagnosis is a significant contributor to the so-called "osteoporosis treatment crisis," despite the widespread availability of safe and effective medications to prevent fractures.14 The proportion of women undergoing DXA scans, as well as those diagnosed with osteoporosis, has steadily declined over the past decade, which has contributed to the reversal in the rate of decline in hip fracture incidence. Osteoporosis screening remains low, even after a fracture occurs.15
Unfortunately, approximately 75% of osteoporosis cases remain undiagnosed due to the lack of accurate and widely available diagnostic tools.16 Therefore, new imaging approaches may help increase the number of individuals screened and improve fracture risk prediction.17 In this context, alternative imaging techniques are being explored. Although some show promise, they have limitations. Non-ionizing techniques, such as magnetic resonance imaging and quantitative ultrasound (QUS), may offer potential solutions. In this regard, Radiofrequency Ecographic Multispectrometry (REMS) could provide an innovative approach.2,9,17
AimTo conduct a non-systematic narrative review of the literature on the usefulness of REMS (Radiofrequency Echographic Multi Spectrometry) in the diagnosis of osteoporosis and its correlation with BMD measured by DXA.
Materials and methodsA non-systematic narrative review of the English and Spanish literature was conducted. The search focused on articles published between 1990 and 2023, in databases such as PubMed, Embase, and Lilacs. The following MeSH (Medical Subject Headings) terms were used: Osteoporosis [Majr], Radiofrequency Echographic Multi Spectrometry [Majr], Diagnosis [Majr], Densitometry [Majr], and these were combined using Boolean operators (AND, OR). Additionally, the retrograde clustering strategy was employed.
ResultsAfter the initial search, 53 articles were identified for screening. Thirteen were excluded: 4 due to duplicate results, 2 because they were abstracts, and 7 because they were unrelated to the search objective. After reviewing the titles and abstracts, 40 manuscripts were selected, providing the information needed for this review (Fig. 1).
Quantitative ultrasoundQuantitative ultrasound (QUS) was first used by Langton et al. in 1984 for diagnosing osteoporosis and estimating fracture risk. The calcaneus was initially chosen due to its accessibility and volume, and because it is a cancellous bone with parallel lateral and medial surfaces. This study demonstrated that the frequency-dependent attenuation slope in calcaneus could discriminate between osteoporotic and non-osteoporotic patients.18 QUS applies sound waves at frequencies ranging from approximately 0.2–2 MHz. Bone properties progressively alter the shape, intensity, and velocity of the propagated waves. It can be used in either transmission or reflection mode and allows the assessment of parameters such as bone quality, elasticity, microarchitecture, and strength.19
QUS devices can be classified according to the site where they measure bone properties (phalanges, wrist, tibia, hip, spine), the manufacturer, or the type of ultrasound transmission (most used).
There are four types of ultrasound transmission: transverse trabecular, transverse cortical, axial cortical, and pulsed echo measurement devices (Table 1).20,21
Classification of quantitative ultrasound devices.
Quantitative US device | Characteristics | Measurement site | FDA approved |
---|---|---|---|
Transverse trabecular transmission | Allows ultrasound probes to travel through trabecular bone, 2 transducers: transmitter and receiver are placed on each side of the bone | Calcaneus | Yes |
Acquires BUA, SOS, and SI parameters | |||
Transverse cortical transmission | Ultrasound waves travel through the cortical bone using transducers on both sides of the measured bone | Phalanges and distal radius | No |
Cortical axial transmission | Guided US waves that travel through cortical bone | Phalanges | Few have been approved |
Radio | |||
The transducers (transmitter and receiver) are placed along the axis of the measured bone and the waves travel along the diaphysis | Tibia | ||
Pulsed echocardiogram (REMS) | Integrates the analysis of US images and backscattered radio frequency signals. | Lumbar spine and femoral neck | Yes |
BUA: Broad-band Ultrasound Attenuation; REMS: Radiofrequency Ecographic Multi Spectrometry; SI: Stiffness Index; SOS: Speed of Sound.
In trabecular and cortical transverse transmission ultrasound techniques, ultrasound waves travel through trabecular bone. This requires transducers—one functioning as a transmitter and the other as a receiver—placed on either side of the bone. The two conventional and initial parameters measured by transverse QUS are ultrasound attenuation and speed of sound, obtained using the substitution technique. In this technique, the signal transmitted through the skeletal site in response to broadband excitation is compared with the signal transmitted through a reference medium with known attenuation and speed of sound. The frequency-dependent attenuation is derived from spectral analysis of the two signals.19
Ultrasonic attenuation or broadband ultrasound attenuation (BUA) is defined as the slope at which attenuation increases with frequency, typically between 0.2 and 0.6 MHz, and is measured in decibels per MHz (dB/MHz). Ultrasonic velocity or speed of sound (SOS) is measured in meters per second (m/s).20 BUA and SOS can be combined to give an additional parameter called the stiffness index (SI = 0.67 × BUA + 0.28 × SOS − 420).19
Conventional ultrasound, BUA, and SOS measurements require two transducers and are therefore only applicable to appendicular sites (e.g., wrist, tibia, phalanges), but not to central anatomical sites.22 Their limited prognostic power arises from the lack of clear relationships with the health status of the hip or spine, which are the fracture sites associated with the highest costs and most severe reductions in patient quality of life. It is important to note that pulsed echo measurement devices require only a single transducer, making them applicable to central sites such as the hip and spine, where transmission (transverse) measurements are difficult.
In the axial transmission technique, a transmitter and receiver are used to measure the speed of sound through the cortical layer of bone, parallel to its long axis. Unlike transverse transmission, this technique does not require a transducer on either side of the bone.19
The current position of the International Society for Clinical Densitometry (ISCD) regarding QUS is that the only validated skeletal site is the calcaneus. Its ability to predict fragility fractures has been demonstrated only in subjects older than 65 years, and it can be used to identify a population at very low risk of fracture, for whom diagnostic assessment is not required. However, the ISCD also specifies that DXA measurements of the lumbar spine and femur are preferred for therapeutic decision-making, and QUS cannot be used for therapeutic monitoring of patients.
Additionally, comparisons of QUS performance with DXA have produced conflicting results. While QUS may be valuable as a screening tool, clinical and therapeutic decisions should be based on DXA confirmation at central sites.22 Therefore, QUS results cannot routinely be used to initiate treatment without further DXA confirmation, since QUS does not measure BMD, the current diagnostic criterion for osteoporosis. A method is required to convert or adapt ultrasound results to DXA grading.23
Despite limited clinical data and issues associated with calcaneus ultrasound, pulsed echo ultrasound has been approved by the FDA for measuring BMD, T-score, and Z-score (parameters not assessed by other ultrasound devices), and for monitoring bone changes in clinical practice—an application that has not been previously studied using ultrasound. The goal is not to replace BMD measurements but rather to complement them and increase accessibility.23
This technique may prove useful for subjects requiring intensive screening and treatment in high-risk populations.
Pulsed echo measuring devicesTrabecular bone, being a dispersive medium, allows the bone trabeculae to scatter ultrasound waves.24 This scattering can be quantified sonographically through backscatter. By using regression models of experimental data and in vivo bone measurements, ultrasound backscatter has been linked to microarchitectural parameters, providing complementary information to traditional bone mass measurements.24
Notable parameters include:
- •
Integrated Reflection Coefficient (IRC)
- •
Broadband Backscatter (BUB)
- •
Apparent Backscatter (AIB)24
- •
Slope of Apparent Backscatter (TSAB)
- •
Frequency Slope of Apparent Backscatter (FSAB)
These parameters hold significant potential to reflect key aspects such as the structure, density, composition, and mechanical properties of trabecular bone.10
Pulsed Echography (PE) distinguishes itself from other ultrasound-based devices by its versatility. Its design, requiring only a single transducer, makes it ideal for measurements at critical skeletal locations like the spine and hip and allows for separate analysis of trabecular and cortical bone.24
A prominent technology among pulsed echo devices is Radiofrequency Echographic Multi-Spectrometry (REMS), which diagnoses osteoporosis by measuring bone mineral density (BMD) and predicts fracture risk through the calculation of the Fragility Score. This is achieved by automatically processing unfiltered ultrasound signals obtained from the hip and spine measurements.9
The process is based on the spectral measurement of unfiltered backscatter ultrasound pulses, specifically from the lumbar spine or proximal femur. Unlike conventional techniques, REMS retains all information related to the features of the insonicated bone9 Bone condition is assessed by comparing the acquired spectrum to corresponding osteoporosis models, one representing the pathological state and the other the healthy one. The acquired signals provide detailed information about bone quantity and quality, enabling the characterization of bone fragility and the prediction of fracture probability (Fig. 2).9,22
Radiofrequency Ecographic Multi Spectrometry (REMS) data: A) REMS analysis characterized by processing of unfiltered native signals from multiple scan lines; B) Spectrum derived from each scan line; C) Comparison with spectral patterns of healthy (green) and osteoporotic (red) subjects.
REMS is inherently integrated with ultrasound imaging. B-mode imaging is crucial for two reasons: it determines the region of interest (ROI) for bone calculations via an automatic segmentation algorithm, and it facilitates the acquisition of multiple radiofrequency signals, providing a reliable basis for subsequent spectral analysis.
With REMS, each ultrasound line is converted into a radiofrequency signal, and the software differentiates between cartilage, cortical, and trabecular bone in these signals. The trabecular portion is specifically selected for analysis, ensuring that signal artifacts in the cortical bone do not influence the results.25
Finally, to determine bone mineral density, REMS compares the specific spectrum of the bone in question with a database of reference spectral patterns. From this comparison, the T-score and Z-score are derived using the normative database from the National Health and Nutrition Examination Survey (NHANES). This allows the classification of the patient into categories such as normal bone mass, osteopenia, or osteoporosis.9
Ultrasound measurement procedure for bone assessmentPreliminary adjustments- •
Initially, a preliminary ultrasound inspection determines the focus (21–100 mm) and depth (60–210 mm). These are the only parameters requiring manual adjustment based on the patient's specific anatomy to observe the desired interface, such as the vertebral surface or femoral neck.
- •
The convex ultrasound probe is positioned transabdominal, below the sternum.
- •
Once the L1 vertebra is located, the transducer is moved to L4, following the visual and auditory cues from the EchoStudio™ software.
- •
This process takes about 80 s (approximately 20 s per vertebra).
- •
After scanning, image processing takes 1−2 min. A total of 100 radiofrequency images are generated and stored for subsequent offline analysis.26
- •
The convex ultrasound probe is placed parallel to the axis of the femoral neck, allowing for visualization of the interface between the femoral head, neck, and trochanter.
- •
Once the acquisition begins, the operator maintains the image for 40 s, following the equipment's instructions. Afterward, the operator waits for 60 s while the equipment automatically processes the data.
- •
The radiofrequency spectrum extracted from the bone being studied is compared with anthropometrically similar models stored in a predefined database, which includes both pathological and non-pathological bone profiles.27
- •
Based on this comparison, BMD is quantified, and the diagnostic categorization is determined (Fig. 3).
- •
The "osteoporosis score" is determined, reflecting the portion of the spectrum identified as osteoporotic following spectral analysis.
- •
Using this score, a BMD value is calculated through linear equations.
- •
Finally, the "fragility score" is calculated, providing an estimate of fracture risk that is independent of BMD.27,28
The fragility score (FS) is a metric designed to estimate fracture risk independent of bone mineral density (BMD).9 It focuses on identifying specific structural features of bones that are susceptible to fracture by analyzing unfiltered backscattered radiofrequency signals from the lumbar spine and hip.26,27
This score quantifies overall skeletal fragility and can differentiate between individuals with and without fractures. It is typically lower in controls and inversely correlates with BMD values measured by DXA. The score assigns a value ranging from 0 to 100, based on a comparison between the patient's specific spectrum and reference spectra obtained from "frail" patients with osteoporotic fractures and "non-fragile" patients without fractures.9,26,27,29
To assess fracture risk in patients, the REMS T-score can be combined with FS values. This is done using a combination matrix, which classifies patients on a progressive risk scale from R1 to R7. This classification considers both the hip and spine and provides a percentage estimate of fracture risk over 5 years (Fig. 4).29
Key findings from relevant studiesGrecco et al. found a strong linear correlation between the fragility score and FRAX (with femoral BMD) for estimating the 10-year fracture risk: major fractures (r = 0.71; p < 0.001) and hip fractures (r = 0.70).26 However, correlations weakened when using the FRAX based solely on risk factors: for major osteoporotic fractures, r = 0.051, and for hip fractures, r = 0.46.26
Pisani et al. examined the effectiveness of the FS in identifying individuals at risk of fragility fractures over 5 years.30 The area under the curve (AUC) for the lumbar spine FS in distinguishing between women with and without incident fragility fractures was 0.811 (p < 0.0001), significantly higher than the T-scores obtained by REMS (0.636; p = 0.02) and DXA (0.603; p = 0.001).30 For the hip, the FS showed an AUC of 0.780 (p < 0.001), compared to the REMS hip T-score (0.637; p = 0.03) and DXA (0.611; p = 0.02). In women, an FS greater than 37.2 had an odds ratio (OR) of 9.23 (95% CI: 6.47–13.17; p < 0.0001), while for the REMS and DXA T-scores, the ORs were 3.58 (95% CI: 2.57–4.99; p < 0.0001) and 2.5 (95% CI: 1.81–3.44; p < 0.0001), respectively.30 In men, the AUC was 0.780 (p < 0.0001) for the spine and 0.809 for the hip (p < 0.0001), surpassing the T-scores from both REMS and DXA in both cases.30
Therefore, it can be concluded that the FS could serve as a viable alternative for assessing bone fragility using a non-ionizing research instrument, without requiring detailed knowledge of clinical risk factors and BMD.13,26
Accuracy and correlation between REMS and DXAThe various studies comparing the performance of REMS and DXA are summarized in Table 2.
Performance of the REMS in the different cohorts.
Author | n = | Sensitivity | Specificity | Agreement | k | r | r2 | Line slope regression | ESE | Average difference | ROC |
---|---|---|---|---|---|---|---|---|---|---|---|
BMD g/cm2 | |||||||||||
Conversano et al.25 | 342 | LS:0.859** | 0.73 | ||||||||
Casciario et al.28 | 377 | FN:0.898** | 0.79 | ||||||||
Di Paola et al.40 | LS: 1,199 | LS: 91.7% | LS: 92% | LS: 88.8% | LS: 0.824 | LS:0.94 | LS:0.89 | LS:0.95 | LS: 0.044 (5.3%) | LS:–0.004 ± 0.088 | |
FN: 1,373 | FN:91.5% | FN: 91.8% | FN: 88.2% | FN: 0.794 | FN: 0.93 | FN:0.87 | FN: 0.97 | FN: 0.038 (5.8%) | FN:–0.006 ± 0.076 | ||
Adami G et al.32 | 1,516 | LS: 92.4% | LS: 94.4% | LS: 0.8 | LS:0.92* | LS:0.97 | LS: NF: 0.03 ± 0.52 | LS:0.66 | |||
F: 0.95 | |||||||||||
NF: 0.99 | |||||||||||
FN: 0.92 | FN: 1.03 | ||||||||||
FN:90.9% | FN: 96.2% | FN: 0.79 | F: 0.88 | F: 1 | F:–0.17 ± 0.51 | FN: 0.64 | |||||
NF: 0.93 | NF: 1.03 | ||||||||||
Corte et al.31 | 4,307 women | LS: 90.9% | LS: 95.1% | LS: 86.8% | LS: 0.84 | LS: 0.94 | LS:0.88 | LS: 0.90 | LS: 0.042 | LS:–0.002 ± 0.087 | LS:0.683 |
FN:90.4% | FN: 95.5% | FN: 86% | FN: 0.83 | FN: 0.93 | FN:0.86 | FN: 0.97 | FN: 0.044 | FN: 0.002 ± 0.088 | FN:0.640 | ||
Ramos Amorim et al.11 | 343 | LS: 84% | LS: 94.6% | LS: 69.4% | LS: 0.51 | LS: 0.75 | LS:–0.026 ± 0.179 | LS: 0.94 | |||
FN:92.6% | FN: 93.5% | FN: 74.9% | FN: 0.58 | FN: 0.78 | FN:–0.027 ± 0.156 | FN: 0.97 |
ROC: Receiver Operating Characteristic; ESE: Estimated Standard Error; LS: Lumbar Spine; FN: Femoral Neck; F: Fracture; NF: No Fracture.
Conversano et al. evaluated 342 patients aged 51–60 years using DXA BMD and REMS at the lumbar spine.25 Subjects were divided into two groups: a baseline population to construct the US spectral model and a study population to assess repeatability and accuracy. The diagnostic accuracy of REMS was 91.1%, with a mean of 10.1% (κ = 0.859; p < 0.0001). A κ value greater than 0.8 indicates almost perfect agreement between DXA and US classifications, while a κ value above 0.75 indicates excellent reproducibility and is typically high in methods with very good precision. A significant correlation was also observed between REMS and DXA (r² = 0.73).
Casciaro et al. studied the feasibility and accuracy of REMS at the femoral neck compared to DXA in 377 individuals aged 61–70 years.28 After subdividing the patients to construct the spectral model and assess repeatability, the US-based accuracy was 94.7% (κ = 0.898; p < 0.0001). A significant correlation was found between REMS and DXA (r² = 0.79).
Di Paola et al. assessed the precision and accuracy of REMS compared with DXA in 1914 postmenopausal women aged 51–70 years. In this study, REMS showed good agreement with DXA; the mean BMD difference (bias ± 2 SD) was −0.004 ± 0.088 g/cm² for the lumbar spine and −0.006 ± 0.076 g/cm² for the femoral neck. Regression analysis demonstrated a significant correlation between the two technologies: for the lumbar spine, the slope was 0.95 with an r = 0.94 (p < 0.001), with an estimated standard error (ESE) of 5.3%. For the femoral neck, the slope was 0.97 (r = 0.93; p < 0.001), with an ESE of 5.8%.
In a similar multicenter study from the European Union, Cortet et al. evaluated 4307 Caucasian women aged 30–90 years, with a focus on detecting patients with prior fragility fractures.31 This study demonstrated a strong correlation between BMD measurements from REMS and DXA, with r = 0.94 for the lumbar spine and r = 0.93 for the femoral neck. In the femoral neck assessment, the sensitivity was 90.4%, and the specificity was 95.5%. For the lumbar spine, sensitivity was 90.9%, and specificity was 95.1%.
In Latin America, a study conducted by Amorim-Ramos et al. in Brazil with 343 subjects11 found the average difference in BMD (bias ± 1.96 SD) to be −0.026 ± 0.179 g/cm² for the lumbar spine and −0.027 ± 0.156 g/cm² for the femoral neck.
REMS for fracture risk predictionAdami et al. conducted a prospective, observational study to evaluate the effectiveness of the REMS T-score in identifying individuals at high risk for fragility fractures.32 They compared REMS and DXA results in Caucasian women aged 30–90 years and monitored the occurrence of new fractures over 5 years. Participants were divided into two groups based on fracture occurrence: the F′ group (with fractures) and the NF′ group (without fractures). Of the 1516 enrolled women, 1370 completed follow-up, and 14% experienced fragility fractures.32 Significant differences in the REMS and DXA T-scores were observed between the two groups (p < 0.001). With a T-score threshold of −2.5, REMS identified individuals with fractures with a sensitivity of 65.1% and a specificity of 57.7% (OR = 2.6; p < 0.001), while DXA showed a sensitivity of 57.1% and a specificity of 56.3% (OR = 1.7; p = 0.0032). For the femoral neck, REMS had a sensitivity of 40.2% and a specificity of 79.9% (OR = 2.81; p < 0.001), while DXA had a sensitivity of 42.3% and a specificity of 79.3% (OR = 2.68; p < 0.001).
Artifact detectionREMS technology can eliminate bone artifact signals by identifying atypical spectral signals. A study involving 87 subjects with vertebral artifacts included 22 cases of vertebroplasty, 26 cases of vertebral fractures, and 38 cases of spondyloarthrosis. In the lumbar spine, the BMD and T-scores obtained by REMS were lower than those obtained by DXA, with no correlation observed. However, in the femoral neck, a strong correlation was found between both methods (p < 0.01).33
Regarding artifacts in the femoral neck, a patient with an intramedullary nail after a displaced pertrochanteric fracture of the left femur underwent DXA of the right femoral neck and REMS of both femurs. Osteoporosis was diagnosed in the right femur by both technologies and in the left femoral neck, with the intramedullary nail, by REMS, which correlated with the values on the right side.33 The results from individuals with artifacts in the lumbar spine and intramedullary nails in the hip demonstrate the ability of REMS to assess anatomical sites that are not accessible by DXA.33
Caffarelli et al., who assessed the ability of REMS to diagnose osteoporosis in postmenopausal women, found that REMS T-scores were significantly lower than those of DXA in the lumbar spine and femoral regions (p < 0.01 and p < 0.05, respectively).34 In the presence of spondyloarthrosis, REMS classified a higher percentage of osteoporotic women (35.1%) compared with DXA (9.3%). Similarly, REMS classified more patients as osteoporotic (58.7% vs. 23.3% by DXA).34
Anecdotal evidence suggests that occult hip fractures (non-displaced and invisible on X-ray) have been diagnosed during ROI localization at the femoral neck, appearing as disruptions in the bone cortex.29
Special populationsKidney transplant recipientsIn kidney transplant recipients, REMS demonstrated good agreement with DXA in classifying patients as osteopenic or osteoporotic. However, REMS may have been more sensitive in some cases, particularly in the lumbar spine.35
Rheumatoid arthritisPatients with rheumatoid arthritis (RA) are particularly susceptible to osteoporosis due to factors such as uncontrolled chronic disease activity, early menopause, and corticosteroid use. Comorbid osteoporosis has been identified in up to 46.8% of RA patients, doubling both the prevalence and the risk of fractures compared to the general population.33,36 Bojinca et al. evaluated 106 RA patients, with a mean disease duration of 3.2 years, and compared them with 119 controls to assess the diagnostic reliability of REMS versus DXA. These patients had not previously undergone DXA or been diagnosed with osteoporosis. This study found a higher prevalence of osteoporosis among RA patients compared to controls, replicating previous findings from DXA studies.37
MenA study by Ciardo et al. demonstrated that REMS is a reliable technology for diagnosing osteoporosis in men. In a sample of 313 adult men, with a mean age of 57.7 years (range: 30–87), the Pearson correlation was r = 0.92 (r² = 0.85). In the Bland-Altman analysis, the standard deviation was −0.002 ± 0.092 g/cm².38
The concordance between diagnostic classifications using REMS and DXA was very high, with a sensitivity of 89.1% and a specificity of 90.7%; Cohen's K was 0.71. Considering the three diagnostic categories (normal, osteopenia, osteoporosis), the diagnostic concordance between the technologies was 81.5%,38 confirming similar results to those obtained in female populations.
Anorexia nervosaDecreased BMD and an increased risk of fragility fractures are complications of anorexia nervosa, due to reductions in both cortical and trabecular bone density. The risk of fracture is seven times higher in individuals with anorexia nervosa compared to age-matched women with normal weight. The use of DXA may be limited in young patients due to the need for frequent measurements. A good correlation was found between BMD measured by DXA and BMD measured by REMS in the lumbar spine (r = 0.64; p < 0.01), femoral neck (r = 0.86; p < 0.01), and total hip (r = 0.84; p < 0.01).39 In the lumbar spine and total hip, there was agreement when compared with DXA. However, in the femoral neck, the Z-score measured by REMS was significantly lower compared with DXA (p < 0.01).39
LimitationsDespite its advantages in the diagnosis of osteoporosis, REMS technology faces significant limitations, particularly in terms of operational accuracy. Proper staff training is essential, as errors in depth and focus selection during scanning can result in patient exclusion from studies. More comprehensive and extended training (3 days recommended) has proven effective in minimizing these errors.40
Additional technical challenges include managing patients with colostomies, recent abdominal surgeries, or pain during scanning, as well as difficulties in identifying bony structures.11 These challenges are even more pronounced in special populations, such as individuals with severe obesity or ethnic differences, which require further research to better understand these variations.11,40
ConclusionsThis literature review highlights Radiofrequency Ecographic Multi Spectrometry as an innovative and promising technology for the diagnosis of osteoporosis. With its ability to provide accurate measurements and detect subtle changes in bone density, Radiofrequency Ecographic Multi Spectrometry represents a significant advancement in clinical practice, especially in settings where traditional modalities like X-ray densitometry are unavailable or less effective.
The main advantage of Radiofrequency Ecographic Multi Spectrometry lies in its unique ability to analyze bone structure non-invasively and with high precision, enabling early and accurate detection of osteoporosis and, consequently, more effective disease management. Additionally, its portability and ease of use make Radiofrequency Ecographic Multi Spectrometry a valuable tool for ongoing osteoporosis monitoring, particularly in populations with limited access to X-ray densitometry technology.
Studies have shown that Radiofrequency Ecographic Multi Spectrometry is as reliable as X-ray densitometry, with the added benefit of being less susceptible to errors caused by bone artifacts. However, it is important to acknowledge that further research is needed to fully assess its efficacy across different patient subgroups and in direct comparison with other technologies.
Moreover, Radiofrequency Ecographic Multi Spectrometry has the potential to positively impact public health and health economics. Preventing osteoporotic fractures and reducing the economic burden of osteoporosis management are tangible benefits that could result from the broader implementation of Radiofrequency Ecographic Multi Spectrometry in clinical practice.
Finally, despite its promising applications, Radiofrequency Ecographic Multi Spectrometry is not without limitations. Further research, especially large-scale studies, is necessary to explore its applicability across various clinical conditions and populations. These studies should focus on providing robust comparative data to support the adoption of Radiofrequency Ecographic Multi Spectrometry as a standard tool in the diagnosis and management of osteoporosis.
Authors' contributionThe authors contributed equitably in the article.
Ethical responsibilitiesThis non-systematic literature review did not involve direct patient participation or require the administration of treatments. Therefore, informed consent was not necessary for treatment or participation in primary research. However, it should be noted that the review was conducted in strict accordance with current regulations on bioethical research. Given the secondary nature of the research and the use of data exclusively from bibliographic sources, explicit authorization from an institutional ethics committee was not required.
The data included in this manuscript are derived from publicly available sources or previously published studies that have obtained relevant ethical approvals.
FinancingThe authors declare that the research was not funded.
We would like to express our sincere gratitude to Adolfo Díez-Pérez, MD, for his meticulous review and constructive comments. His contribution has been invaluable in improving this manuscript.