


The main aims of this study were to adapt the COVID-19 peritraumatic distress index (CPDI) to the Peruvian population and to establish a model explaining depression using CPDI values and anxiety symptoms during the COVID-19 lockdown. Finally, we sought predictive values of the obtained CPDI factors for depression and anxiety as a secondary aim.
Materials and methodsAn exploratory factor analysis (n=300) was performed, followed by confirmatory factor analysis in a second phase (n=1135). To explain depression scores during the COVID-19 lockdown, we performed structural equation modeling (SEM). Finally, we performed a hierarchical regression model (HRM) to evaluate the amount of explained variance of the CPDI factors above depression, anxiety, and socio-demographic variables.
ResultsA 2-factor solution (rumination and stress) for the CPDI (p<0.001; CFI=0.99) was found. Concerning the SEM, our model was able to explain 81% of the depression scores (p<0.001; CFI=0.98). Finally, in the HRM, rumination could explain 17% additional variance in depression (p<0.001) and 28% in anxiety (p<0.001). However, stress showed collinearity with depression and anxiety, not continuing for further HRM analysis.
ConclusionsOur results showed a 2-factor solution for the CPDI. Moreover, our SEM model showed that female sex, younger age, and incomplete education (with high COVID-related stress and anxiety) lead to more depression symptoms during the COVID-19 lockdown. Finally, our HRM showed that people who frequently ruminate during the COVID-19 lockdown are more afraid and negatively affected.
Los objetivos principales de este estudio fueron adaptar el COVID-19 Peritraumatic Distress Index (CPDI) a la población peruana y establecer un modelo que explique la depresión utilizando valores de CPDI y síntomas de ansiedad durante el confinamiento por COVID-19. Finalmente, buscamos valores predictivos de los factores CPDI obtenidos para la depresión y la ansiedad como objetivo secundario.
Materiales y métodosSe realizó un análisis factorial exploratorio (n=300), seguido de uno confirmatorio en una segunda fase (n=1.135). Para explicar los puntajes de depresión durante el confinamiento por COVID-19, realizamos modelos de ecuaciones estructurales (SEM). Finalmente, realizamos modelos de regresión jerárquica (HRM) para evaluar la varianza explicada de los factores CPDI considerando depresión, ansiedad y variables sociodemográficas.
ResultadosSe encontró una solución de 2 factores (rumiación y estrés) para el CPDI (p<0,001; CFI=0,99). En cuanto al SEM, nuestro modelo fue capaz de explicar el 81% de las puntuaciones de depresión (p<0,001; CFI=0,98). Finalmente, en el HRM, la rumiación podría explicar un 17% de varianza adicional en depresión (p<0,001) y un 28% en ansiedad (p<0,001). Sin embargo, el factor estrés mostró colinealidad con la depresión y la ansiedad, y no continuó para un análisis adicional de HRM.
ConclusionesNuestros resultados mostraron una solución de 2 factores para el CPDI. Además, nuestro modelo SEM mostró que el sexo femenino, la edad más joven y la educación incompleta (con un alto nivel de estrés y ansiedad relacionados con COVID) conducen a más síntomas de depresión durante el bloqueo de COVID-19. Finalmente, nuestro HRM mostró que las personas que rumian con frecuencia durante el confinamiento por COVID-19 tienen más miedo y se ven afectadas negativamente.
Coronavirus disease 2019 (COVID-19) has significantly impacted global society, with approximately 290 million infections reported by the end of 2021,1 being the disease burden higher in developing countries.2 Governments worldwide implemented restrictive measures to reduce the COVID-19 incidence, albeit representing an enormous psychosocial burden for different groups.3–5 Adherence to these measures exposed individuals to stressors, leading to increased anxiety and depression, increasing the rates of mental health issues, including suicide behavior.6–8
In recent years, research groups have developed tools to assess the perceived stress during the pandemic, such as the Coronavirus Anxiety Scale (CAS)9 or the Fear of COVID-19 Scale (FCV-19S).10 One example of these tools is the COVID-19 peritraumatic distress index (CPDI), first published in China.11 The CPDI is a pioneering global tool for measuring COVID-related stress, culturally validated across diverse populations.12 Its broad coverage made it effective for screening COVID-19-induced peritraumatic distress during the lockdown and its correlations with the negative socio-economic and psychosocial burden. For instance, a study using the CPDI detected a considerable percentage of people with peritraumatic distress symptoms, and the combination of higher peritraumatic distress scores with an adverse socio-economic environment and poor resilience strategies correlated with dysfunctional coping strategies.13 Given the suitability of the CPDI for rapidly and effectively assessing stress levels as a screening tool in a population group, it is necessary to conduct validation studies for its application. However, validation studies of the CPDI in the Latin American region, which were significantly affected by COVID-19 lockdown periods,14 are underreported. Initially, our research group in Peru validated through experts the first Latin American Spanish version of the CPDI.15 However, construct validation is necessary for determining the accuracy and reliability of the CPDI in its Latin American version. Additionally, it is crucial to formulate a CPDI factorial model, a step that has yet to be undertaken in the Latin American context.16,17
To this end, the main aim of this study is to investigate the factorial structure of the CPDI in a Peruvian sample, evaluated between 2020 and 2021, by using an exploratory (EFA) and confirmatory factor analysis (CFA), replicating some methodological aspects of the study of Jiménez et al.18 Additionally, it seeks to examine the relationship between CPDI, depression (PHQ-9), and anxiety (GAD-7) scores using structural equation modeling, with person-related variables as moderators. As a secondary objective, the study aims to identify predictive values of EFA and CFA factors for depression and anxiety, while correcting for potential confounding factors.
Materials and methodsThe information of this study is based on a database of online survey studies during the COVID-19 pandemic. Some results of this survey study are reported elsewhere.19–21 For this study, some methodological aspects, mainly concerning participants’ recruitment, the description of the online survey, and the questionnaires (especially CPDI), are also included.
Study design and participation criteriaSince one of the main objectives of this study was the construct validation of the CPDI in its Spanish version (Latin America), we divided the following study into two phases with different recruited participants, as recommended in the literature for construct validation studies and factorial analysis22–25: a phase for the exploratory factor analysis (EFA) and another phase for the confirmatory factor analysis (CFA). With the sample information of the second phase, we performed a structural equation model (SEM) to explain depression through CPDI values, using anxiety symptoms as a mediator and socio-demographic variables (age, sex, completed education, and presence of medical conditions) as moderators. Finally, we carried out a hierarchical regression model (HRM) to evaluate the amount of explained variance of the CPDI factors above depression and anxiety, correcting for possible interaction factors (sex, age, completed education, and presence of medical conditions).
For this purpose, we recruited, firstly, for the EFA phase, 300 voluntary participants from Lima (Peru) between March 27th and July 22nd, 2020. Participants were only included if they were older than 18 years, had sufficient knowledge of the Spanish language (CEFR B2), and signed the informed consent to participate. Furthermore, participants were excluded if they did not fulfill these criteria.
After finishing the first phase of this study, we recruited for the CFA 1135 voluntary participants from Lima, Peru, between July 23rd, 2020 and September 21st, 2021. Inclusion and exclusion criteria for the first phase were also considered in the second phase.
Finally, both phases were approved by the ethics committee of the Peruvian University “Cayetano Heredia” (UPCH). The ethical procedures of the study were carried out according to the Helsinki Declaration and the standards of the American Psychology Association (APA). This study was not financed by any industry, society, company, or educational institution. Moreover, no outside institution influenced the study design.19–21
Online surveyOnline electronic surveys were used to recollect the participants’ information since the Peruvian sanitary restrictions did not allow to perform personal contact for recollecting the data. These online surveys were carried out using an open-access internet-based program (Google Forms, Google Inc, USA). Questions concerning socio-economic status (i.e., age, gender, education), past medical history (i.e., presence of medical conditions, number of medical conditions), and psychometric data (CPDI scale, anxiety and depression symptoms) were included.19–21
COVID-19 peritraumatic distress index (CPDI)The COVID-19 peritraumatic distress index (CPDI) is a self-report questionnaire designed to measure peritraumatic distress during the COVID-19 lockdown period. CPDI measures stress symptoms related to COVID-19, such as cognitive changes, avoidance behavior, physical symptoms, social withdrawal, anxiety, and depressive symptoms.11 Validated globally,12,26–28 the CPDI showed good internal consistency and correlations with other scales (Cronbach's alpha=0.95).11,26 Studies in Germany confirmed the cross-cultural similarities between both Chinese and German population samples,27 and a European Spanish version identified two main factors: stress symptoms and obtained information about COVID-19.18
The CPDI consists of 24 items (e.g., “I will believe the COVID-19 information from all sources without any evaluation”), and it is structured following the Likert scale principle; the CPDI questionnaire assigns scores to each item on a scale from 0 to 4 (i.e., never, occasionally, sometimes, often, and most of the time). To obtain the raw score, sum the values of each item, and by adding 4 to the raw total, the displayed score is calculated. Severity levels are defined based on the CPDI displayed score as follows: normal (0–28 display points), mild (29–52 display points), and severe (53–100 display points).19,20
Our research working group recently validated the CPDI scale through experts’ judgment.15 In the initial round of experts, the CPDI was translated and re-translated into Spanish and English, respectively, with a comparison of cultural and language differences. In the second round of expert evaluations, content validity was assessed using the Aiken methodology (evaluating the relevance and clarity of each item) for expert validation. The results of this instrument have been published elsewhere.15
Depressive and anxious symptomatologyAnother main objective of this study is to evaluate the relationship between CPDI, depression, and anxiety scores, including moderators (i.e., socio-economic variables). For this purpose, we evaluated depressive symptoms using the patient health questionnaire 9 items (PHQ-9), validated in Peru.29 PHQ-9 scores ranged between 0 and 27 points, showing a significant internal consistency (Cronbach's alpha=0.87) and defining different severity grades (minimal: 1–4 points; mild: 5–9 points; moderate: 10–14 points; severe: 15–27 points).19,29 In addition, we applied the generalized anxiety disorder 7 items (GAD-7) to assess the anxiety symptoms, which is also validated in Peru.30 The GAD-7 shows a score ranging from 0 to 21 points, also showing a significant internal consistency (Cronbach's alpha=0.89) and defining different severity categories, such as minimal (0–4 points), mild (5–10 points), moderate (11–15 points), and severe (16–21 points).19,30
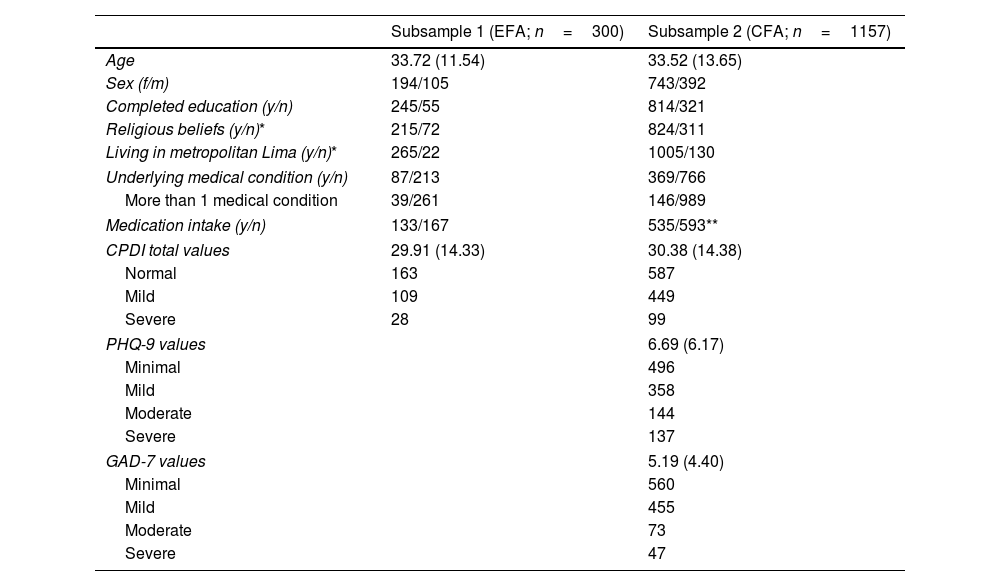
Statistical analysesGeneral aspects and descriptive statisticsGeneral characteristics of the sample, including descriptive data of the instruments (CPDI, PHQ-9, and GAD-7), were represented in tables and described in the text. For quantitative data, we used the mean and standard deviation as measures of central tendency if the numerical variables were normally distributed. For variables with non-Gaussian distribution, median and interquartile ranges (IQR), including 75- and 25-percentiles, were used to describe the variable. Regarding decimal data, we rounded the descriptive information by two decimals. In addition, descriptive data greater than a million was expressed by using scientific notation. Finally, qualitative data, including count data, was characterized using percentage and absolute numerical values. These procedures were performed for both subsamples, as shown in Table 1. Since the two subsamples (i.e., first and second phase) corresponded to two subprojects with different objectives and hypotheses, we did not perform statistical tests to evaluate their differences.
General characteristics of the subsamples for the EFA and CFA phases.
| Subsample 1 (EFA; n=300) | Subsample 2 (CFA; n=1157) | |
|---|---|---|
| Age | 33.72 (11.54) | 33.52 (13.65) |
| Sex (f/m) | 194/105 | 743/392 |
| Completed education (y/n) | 245/55 | 814/321 |
| Religious beliefs (y/n)* | 215/72 | 824/311 |
| Living in metropolitan Lima (y/n)* | 265/22 | 1005/130 |
| Underlying medical condition (y/n) | 87/213 | 369/766 |
| More than 1 medical condition | 39/261 | 146/989 |
| Medication intake (y/n) | 133/167 | 535/593** |
| CPDI total values | 29.91 (14.33) | 30.38 (14.38) |
| Normal | 163 | 587 |
| Mild | 109 | 449 |
| Severe | 28 | 99 |
| PHQ-9 values | 6.69 (6.17) | |
| Minimal | 496 | |
| Mild | 358 | |
| Moderate | 144 | |
| Severe | 137 | |
| GAD-7 values | 5.19 (4.40) | |
| Minimal | 560 | |
| Mild | 455 | |
| Moderate | 73 | |
| Severe | 47 | |
CFA: confirmatory factor analysis; EFA: exploratory factor analysis; CPDI: COVID-19 peritraumatic distress index; PHQ-9: patient health questionnaire 9 items; GAD-7: generalized anxiety disorder 7 items; f: female; m: male; y: yes; n: no.
An exploratory factor analysis (EFA) was conducted with the items of the CPDI in the first subsample (n=300). In determining factor adequacy, we took into consideration the following literature recommendations31: all factors should be theoretically meaningful, at least three variables should saliently load on a factor (overdetermined, i.e., factor loadings ≥0.30), and variables should load significantly on only one factor (no cross-loadings), and each factor should have an internal consistency of α≥0.70 (reliability).
The first step was determining whether the items were suitable for an EFA. For this purpose, Bartlett's test for sphericity32 was used to ensure that the correlation matrix was not random. In addition, we applied the Kaiser–Meyer–Olkin (KMO) criterion33 to determine that only items with a measure of sampling adequacy (MSA) value >0.70 were included.
Additionally, we tested whether the 24 items of the CPDI had a good item-corrected item-scale correlation (i.e., r>0.30).34 If the items showed an item-corrected item-scale correlation lower than 0.30, we excluded them from further analyses.
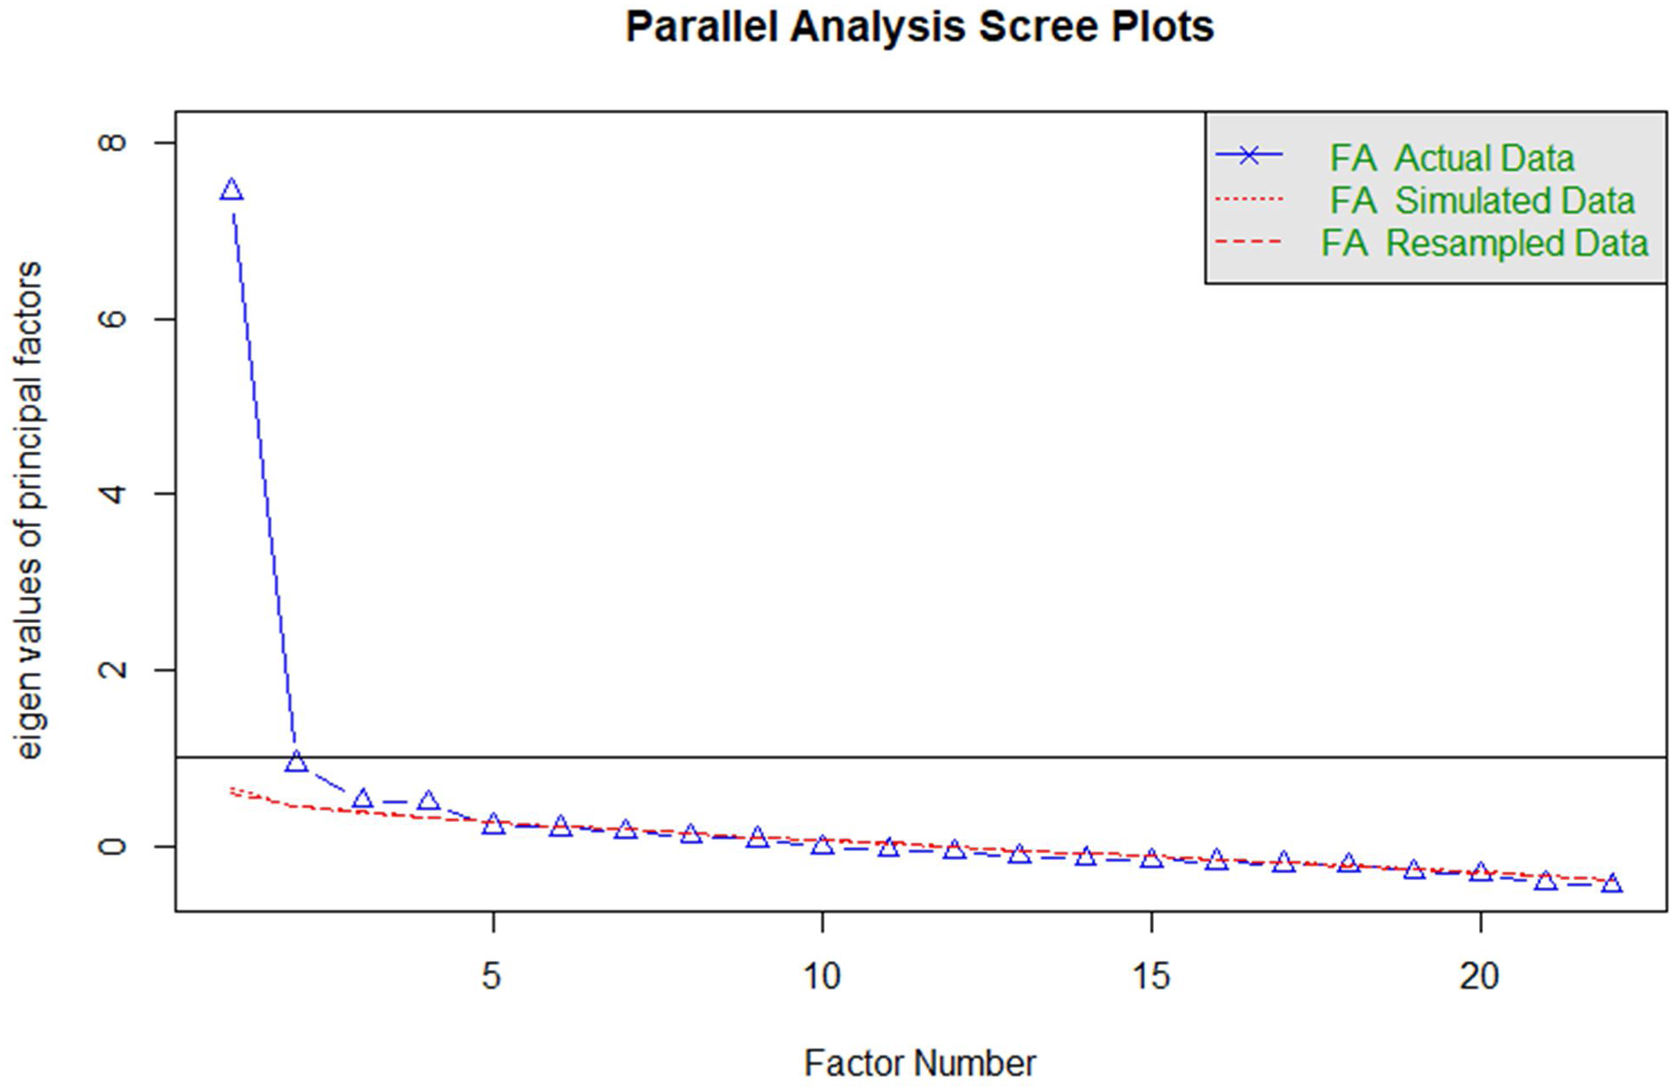
Concerning the number of retained factors, several procedures should be used to determine the appropriate number of factors that are suitable to keep.35 For this reason, we performed the parallel analysis,36 the minimum average partial (MAP),37 and the visual Scree test38 in this study to determine the number of retained factors.
Further, we checked for multivariate normal distribution of the items using the Mardia test for skewness and excess.39 In this case, Mardia tests indicated a non-parametrical distribution of the items. Since our data violates the principles of the standard distribution assumptions and the CPDI items have an ordinal nature, we carried out a polychoric correlation matrix as an input method for the EFA and a principal axis as a factor extraction method. This method followed the recommendations of the robustness of the principal axis method toward the violation of standard distribution assumptions published elsewhere.40
Finally, we performed a reliability analysis for each extracted factor using Cronbach's alpha to define the factors’ internal consistency. In this case, we considered only alpha values greater than 0.70 (acceptable), following the literature recommendations for the grading of Cronbach's alpha.41 The interpretation of the alpha values is defined in previous studies as follows: excellent (α≥0.90), good (0.90>α≥0.80), acceptable (0.80>α≥0.70), questionable (0.70>α≥0.60), poor (α<0.60).41
Confirmatory factor analysisTo confirm the hypothetical factor model obtained from the EFA, we performed a confirmatory factor analysis (CFA) in an independent sample (subsample of the second phase) of 1135 participants. For this purpose, we used diagonal weighted least square (DWLS) as an estimation method, recommended and published elsewhere.42 As model fit measurements, we used the comparative fit index (CFI), the Tucker–Lewis index (TLI), the root-mean-square-error of approximation (RMSEA), and the standardized root-mean-square-residual (SRMR). Concerning the TLI and CFI, a good model fit was given if the values of the CFI and TLI were greater or equal to 0.95.18 Finally, regarding RMSEA and SRMR, a good model fit was given if the values of both root-mean-square indicators were below or equal to 0.05.18 Additionally, we calculated the 90-percent confidence intervals (90% CI) for the RMSEA.43 Finally, we presented the results of the CFA in a path diagram indicating the standardized regression coefficients of the items and the factors.
Statistical modeling: structural equation modeling and hierarchical regression modelIn addition, we performed a structural equation modeling (SEM) to establish a model explaining depression during the COVID-19 pandemic through CPDI, anxiety (mediator of the relationship), and socio-economic parameters (moderator of the relationship), such as age, gender, educational status, and medical conditions. For this purpose, we carried out this model using the diagonal weighted least squares (DWLS) as an estimator since it is robust to the non-normal distribution of scales. Following Hu and Bentler,42 a good model fit is given when CFI and TLI are greater than 0.90 and SRMR and RMSEA are lower than 0.08.
Finally, to establish the predictive values of the CPDI factors obtained from the construct validation analysis for anxiety and depression symptoms (GAD-7 and PHQ-9 respectively), we carried out a hierarchical regression analysis (HRA) with the sample size of this study's second phase (n=1135 participants). For the first step, we carried out a multiple regression model with well-studied predictors (i.e., age, sex, completed education, and presence of medical conditions) for anxiety and depression as dependent variables (DV). In a second step, factors were separately added to the multiple regression analysis models to examine if the factor could explain variance above the previously mentioned predictors in the first step. In the end, both regression models were compared with ANOVA to test if the additional variance that could be explained due to the CPDI factors is statistically significant. p-Values are considered for this analysis as significant if the two-tailed p<0.05. Moreover, we used Cohen's f2 (small=0.02, medium=0.15, and large=0.35) for effect sizes.44,45
Descriptive information was performed using JASP version 0.11.1 (Jeffreys's Amazing Statistic Program, The University of Amsterdam, Amsterdam, The Netherlands).46
Statistical analyses of the EFA, CFA, SEM, and HRA were performed under the R-software version 4.1.2 (R Core Team, 2021, R Foundation for Statistical Computing, Vienna, Austria).47 Finally, we computed SEM analysis using the lavaan package (version 0.6-7) under the R-software.
ResultsGeneral characteristics of the sampleThe general characteristics of both samples, including socio-economic and psychometric variables, are detailed in Table 1. Concerning the general characteristics of both subsamples (Subsample 1 – age: 33.72±11.54 years; Subsample 2 – age: 33.52±13.65 years), the majority of participants were female (Subsample 1: 194 out of 300 participants; Subsample 2: 743 out of 1157 participants), residing in metropolitan Lima (Subsample 1: 265 out of 300 participants; Subsample 2: 1005 out of 1157 participants), having completed their studies (Subsample 1: 245 out of 300 participants; Subsample 2: 814 out of 1157 participants), and expressing religious beliefs (Subsample 1: 215 out of 300 participants; Subsample 2: 824 out of 1157 participants). Regarding medical conditions (Subsample 1: 87 out of 300 participants; Subsample 2: 369 out of 1157 participants), the majority of participants had arterial hypertension, followed by asthma and metabolic syndrome. There were no statistically significant differences in the frequency of medical conditions (p>0.05).
First study phase – exploratory factor analysisInitially, in the EFA, Bartlett's sphericity test showed that the results of the correlation matrix were not random (χ2 (231)=2787.53, p<0.001). In addition, the KMO criterion indicated that the data were well suited for factor analysis, KMO=0.91.
Likewise, we tested the item-corrected item-scale correlation for all CPDI items. In this case, we found that items 8 (“I collect information about COVID-19 all day. Even if it's not necessary, I can’t stop myself”; r=0.24) and 11 (“I am constantly sharing news about COVID-19 -mostly negative news-”, r=0.24) did not overpass the item-scale correlation threshold (r>0.30); being excluded therefore from further analyses.
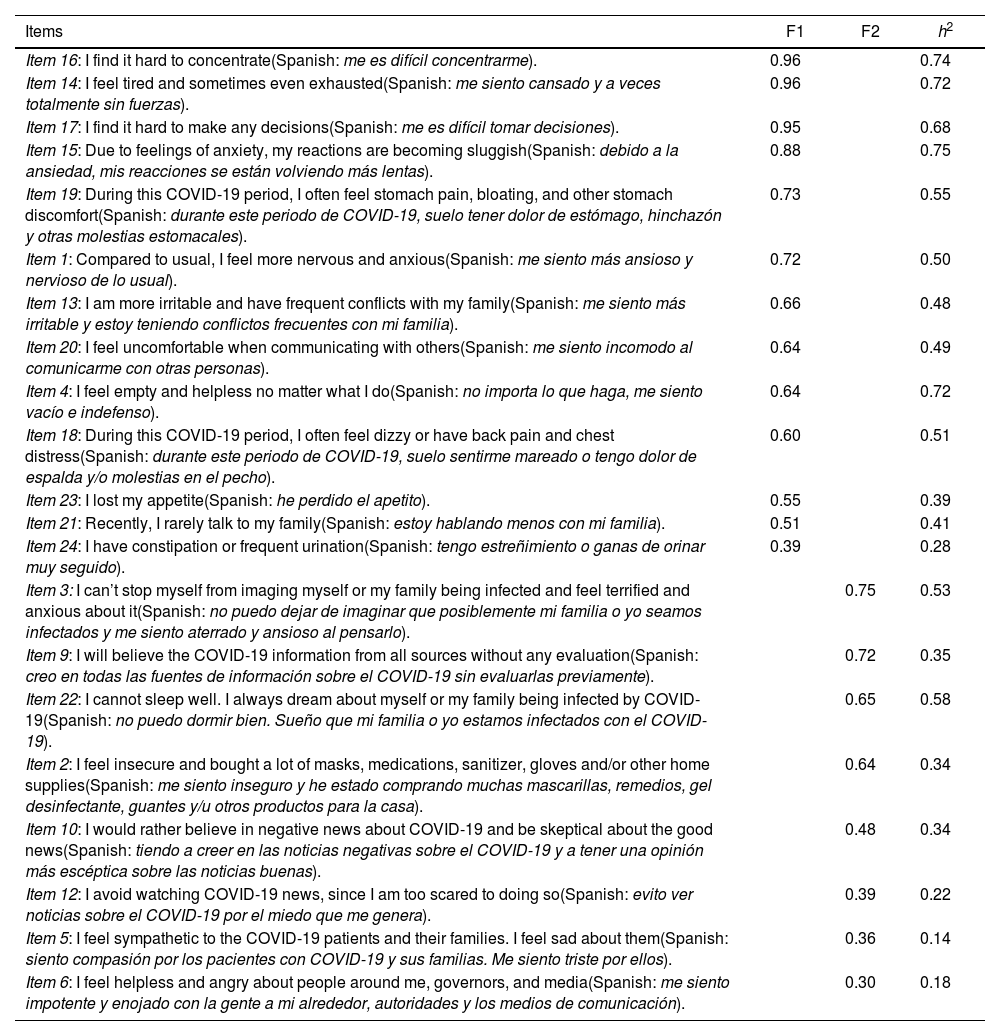
Subsequently, we tested for the number of retained factors using parallel analysis, visual Scree test, and MAP. The parallel analysis indicated a solution with four factors for the 22 remaining items for the factor retention procedure. In contrast, the visual Scree test and MAP indicated a solution with two factors for the 22 items (Fig. 1). Additionally, the visual Scree test showed that the first factor appears to have a significantly higher Eigenvalue than the second one (Fig. 1). After obtaining these factor solutions, we examined each obtained factor solution accurately. The first 4-factor model provided inadequate information since only two variables loaded saliently on the fourth factor. Furthermore, there was a double loading of item 5 on two different factors (third and second factors). Since the over-determinism assumption was not met on the fourth factor and a simple structure was not present, the 3-factor model was also rejected. Finally, after the exclusion of item 7 (“I am losing faith in the people around me”) due to very low factor loading (<0.30), the 2-factor model proved the most suitable model for the remaining 21 CPDI items. The results of the 2-factor model are represented in Table 2 with a Promax rotation since this model showed positive correlations between each factor (r=0.68, p<0.001).

EFA factor loadings and communalities of principal axis analysis (Promax rotation) for the CPDI. A 2-factor solution was found (Factor 1=F1=“stress”, Factor 2=F2=“rumination”). Moreover, a positive correlation between the two factors was found (r=0.68; p<0.001).
| Items | F1 | F2 | h2 |
|---|---|---|---|
| Item 16: I find it hard to concentrate(Spanish: me es difícil concentrarme). | 0.96 | 0.74 | |
| Item 14: I feel tired and sometimes even exhausted(Spanish: me siento cansado y a veces totalmente sin fuerzas). | 0.96 | 0.72 | |
| Item 17: I find it hard to make any decisions(Spanish: me es difícil tomar decisiones). | 0.95 | 0.68 | |
| Item 15: Due to feelings of anxiety, my reactions are becoming sluggish(Spanish: debido a la ansiedad, mis reacciones se están volviendo más lentas). | 0.88 | 0.75 | |
| Item 19: During this COVID-19 period, I often feel stomach pain, bloating, and other stomach discomfort(Spanish: durante este periodo de COVID-19, suelo tener dolor de estómago, hinchazón y otras molestias estomacales). | 0.73 | 0.55 | |
| Item 1: Compared to usual, I feel more nervous and anxious(Spanish: me siento más ansioso y nervioso de lo usual). | 0.72 | 0.50 | |
| Item 13: I am more irritable and have frequent conflicts with my family(Spanish: me siento más irritable y estoy teniendo conflictos frecuentes con mi familia). | 0.66 | 0.48 | |
| Item 20: I feel uncomfortable when communicating with others(Spanish: me siento incomodo al comunicarme con otras personas). | 0.64 | 0.49 | |
| Item 4: I feel empty and helpless no matter what I do(Spanish: no importa lo que haga, me siento vacío e indefenso). | 0.64 | 0.72 | |
| Item 18: During this COVID-19 period, I often feel dizzy or have back pain and chest distress(Spanish: durante este periodo de COVID-19, suelo sentirme mareado o tengo dolor de espalda y/o molestias en el pecho). | 0.60 | 0.51 | |
| Item 23: I lost my appetite(Spanish: he perdido el apetito). | 0.55 | 0.39 | |
| Item 21: Recently, I rarely talk to my family(Spanish: estoy hablando menos con mi familia). | 0.51 | 0.41 | |
| Item 24: I have constipation or frequent urination(Spanish: tengo estreñimiento o ganas de orinar muy seguido). | 0.39 | 0.28 | |
| Item 3: I can’t stop myself from imaging myself or my family being infected and feel terrified and anxious about it(Spanish: no puedo dejar de imaginar que posiblemente mi familia o yo seamos infectados y me siento aterrado y ansioso al pensarlo). | 0.75 | 0.53 | |
| Item 9: I will believe the COVID-19 information from all sources without any evaluation(Spanish: creo en todas las fuentes de información sobre el COVID-19 sin evaluarlas previamente). | 0.72 | 0.35 | |
| Item 22: I cannot sleep well. I always dream about myself or my family being infected by COVID-19(Spanish: no puedo dormir bien. Sueño que mi familia o yo estamos infectados con el COVID-19). | 0.65 | 0.58 | |
| Item 2: I feel insecure and bought a lot of masks, medications, sanitizer, gloves and/or other home supplies(Spanish: me siento inseguro y he estado comprando muchas mascarillas, remedios, gel desinfectante, guantes y/u otros productos para la casa). | 0.64 | 0.34 | |
| Item 10: I would rather believe in negative news about COVID-19 and be skeptical about the good news(Spanish: tiendo a creer en las noticias negativas sobre el COVID-19 y a tener una opinión más escéptica sobre las noticias buenas). | 0.48 | 0.34 | |
| Item 12: I avoid watching COVID-19 news, since I am too scared to doing so(Spanish: evito ver noticias sobre el COVID-19 por el miedo que me genera). | 0.39 | 0.22 | |
| Item 5: I feel sympathetic to the COVID-19 patients and their families. I feel sad about them(Spanish: siento compasión por los pacientes con COVID-19 y sus familias. Me siento triste por ellos). | 0.36 | 0.14 | |
| Item 6: I feel helpless and angry about people around me, governors, and media(Spanish: me siento impotente y enojado con la gente a mi alrededor, autoridades y los medios de comunicación). | 0.30 | 0.18 |
EFA: exploratory factor analysis; CPDI: COVID-19 peritraumatic distress index.
The two resulting factors are interpreted as follows: factor 1 or “stress in the context of COVID-19 pandemics” (item example: “I feel tired and sometimes even exhausted”, Eigenvalue=7.07; α=0.92, 95CI [0.90; 0.93]), and factor 2 or “rumination in the context of COVID-19 pandemics” (item example: “I can’t stop myself from imaging myself, or my family being infected and feel terrified and anxious about it”, Eigenvalue=2.84; α=0.72, 95CI [0.66; 0.76]). In this case, factor 1 consisted of 13 items (items 16, 14, 17, 15, 19, 1, 13, 20, 4, 18, 23, 21 and 24) and factor 2 of 8 items (items 3, 9, 22, 2, 10, 12, 5 and 6).
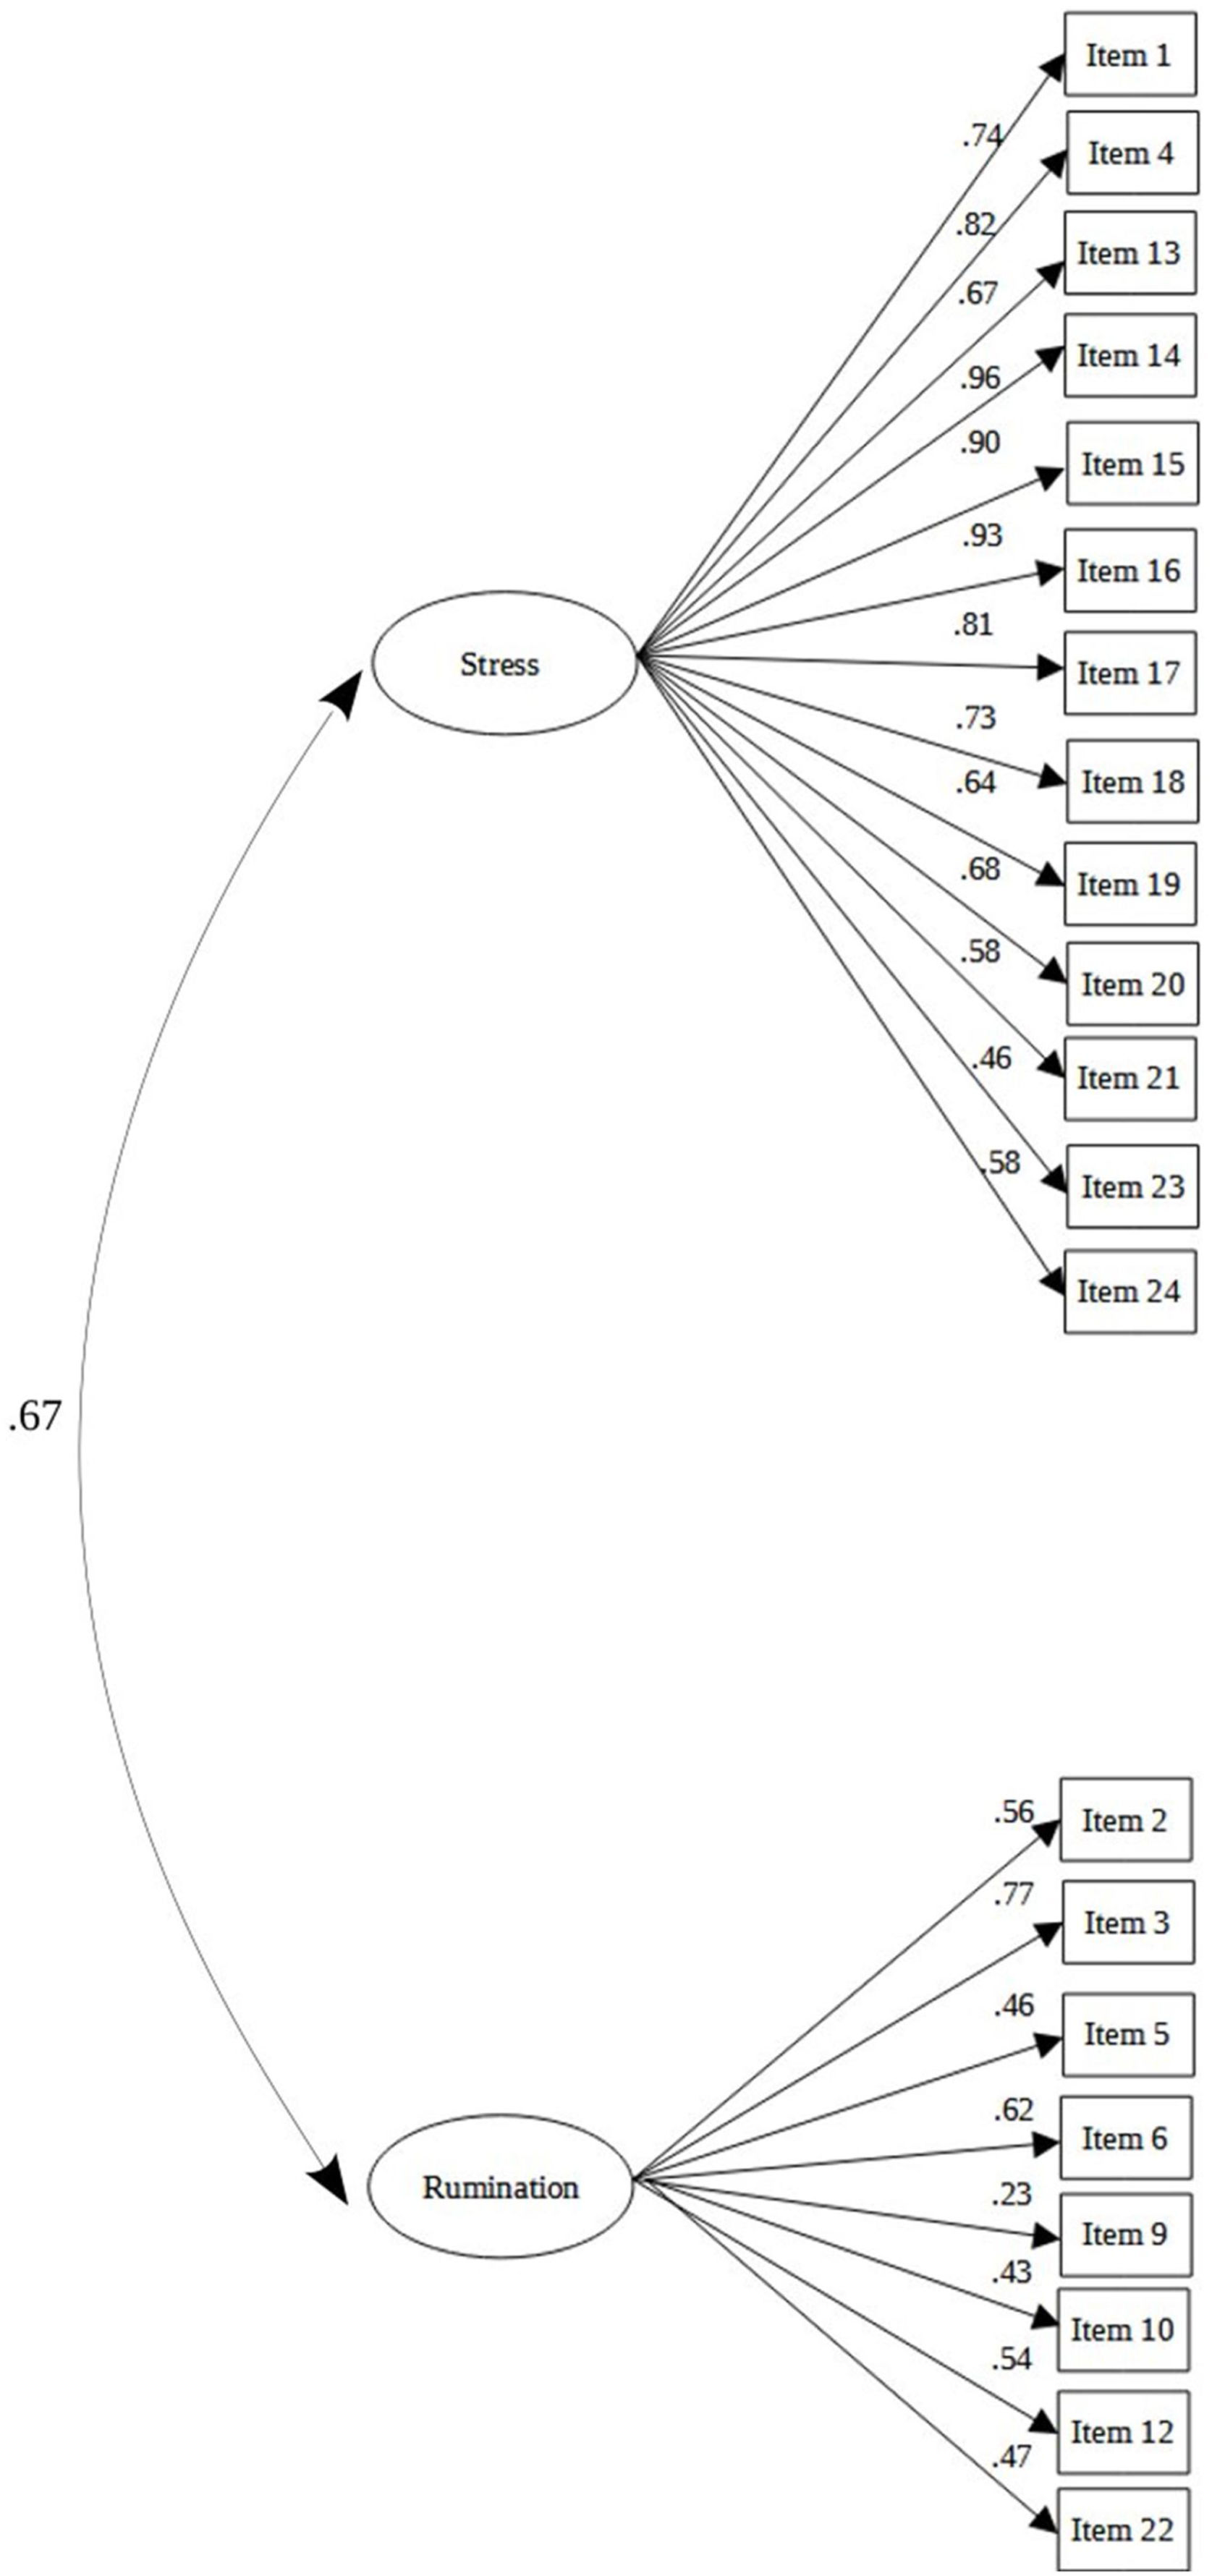
Second study phase – confirmatory factor analysisThe two-factor structure obtained in the EFA was tested with an independent sample, coming from the subsample of the second study phase (n=1135). The results from the CFA indicated a good model fit (χ2 (188, n=1135)=432.45, p<0.001; CFI=0.99; TLI=0.99; RMSEA=0.034, 90% CI [0.030; 0.038]; SRMR=0.048). Results of the CFA for the 2-factor model are represented in Fig. 2.
Structure equation modeling (SEM) to explain depression through CPDI, anxiety, and other socio-economic parameters and factor 2 (“rumination in the context of COVID-19 pandemics”).")
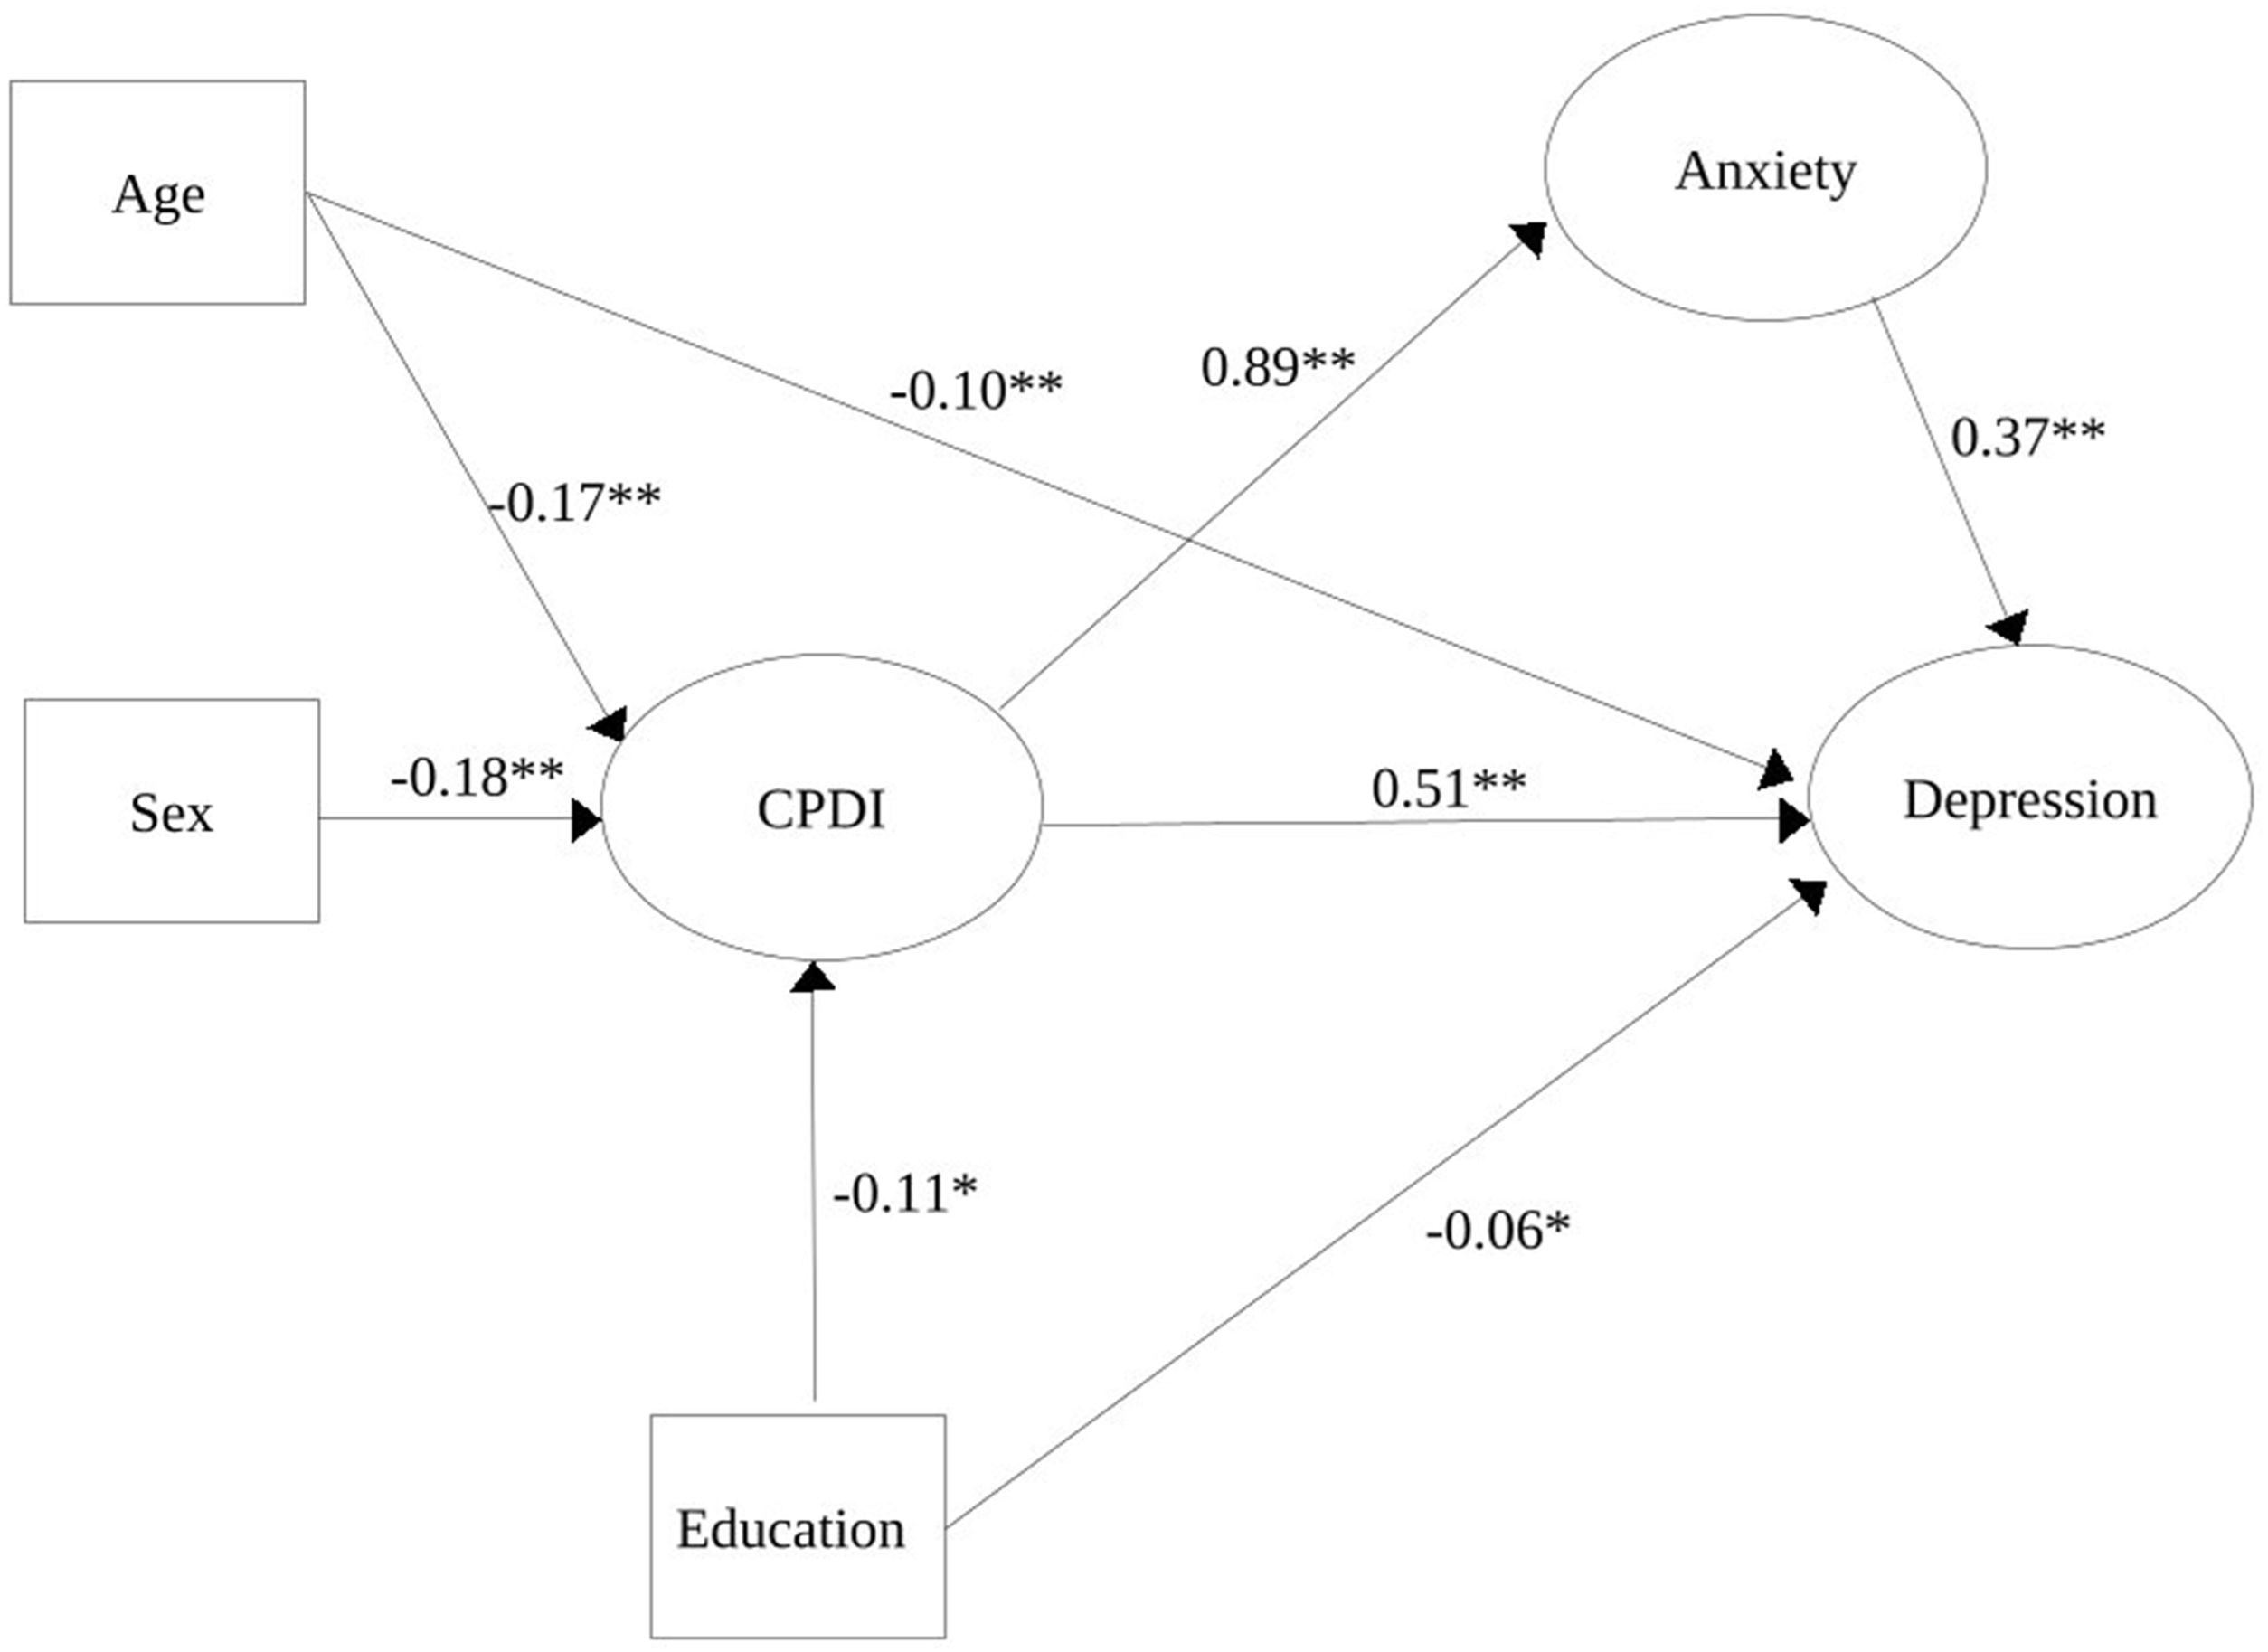
Furthermore, we performed a SEM to examine how much variance (R2) the proposed model could explain in the outcome variable depression (Fig. 3). The analysis shows that the proposed model was able to explain 81% of the depressive symptoms and that this model had a good fit (CFI=0.98; TLI=0.98; RMSEA=0.04, 90% CI [0.037; 0.041]; SRMR=0.053) (Fig. 3). In this constellation, the variable presence of medical conditions did not have significant regression coefficients in the SEM considering anxiety, depression, or CPDI (p>0.05).
 path diagram. Here, the relationships between CPDI, anxiety symptoms during COVID-19 lockdown (GAD-7: generalized anxiety disorder 7 items), and socio-demographic variables (age, sex, and completed education) are represented. Furthermore, this model showed a good fit to explain depressive symptoms (PHQ-9: patient health questionnaire 9 items), explaining 81% of the depressive symptoms during the COVID-19 lockdown. Note: *p<0.01; **p<0.001.")
Structural equation modeling (SEM) path diagram. Here, the relationships between CPDI, anxiety symptoms during COVID-19 lockdown (GAD-7: generalized anxiety disorder 7 items), and socio-demographic variables (age, sex, and completed education) are represented. Furthermore, this model showed a good fit to explain depressive symptoms (PHQ-9: patient health questionnaire 9 items), explaining 81% of the depressive symptoms during the COVID-19 lockdown. Note: *p<0.01; **p<0.001.
Hierarchical regression analysis was conducted to test the predictive value of the CPDI factors “rumination in the context of COVID-19 pandemics” (factor 2) for depression (PHQ-9) and anxiety (GAD-7) symptoms. Since the factor “stress in the context of COVID-19 pandemics” (factor 1) showed highly correlations with PHQ-9 (r=0.83, p<0.001) and GAD-7 (r=0.82, p<0.001), indicating multicollinearity, we decided not to continue further regression analyses with this factor.
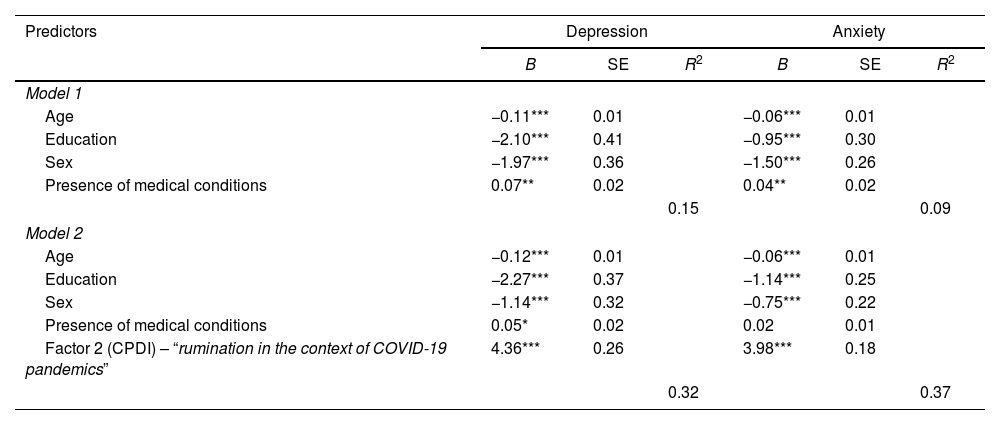
Concerning the rumination factor (factor 2), multiple regression analyses revealed in the first step that all predictors of model 1 could predict depression and anxiety symptoms (Table 3). All four predictors together could explain significant proportion of the variance in depression (R2=0.15, F4,1130=49.56, p<0.001, f2=0.42) and in anxiety symptoms (R2=0.09, F4,1130=27.62, p<0.001, f2=0.31). In a second step, rumination was included in the model as an additional predictor (model 2, see Table 3). For depression symptoms, model 2 showed all five variables as significant predictors. However, for anxiety symptoms, the presence of medical conditions was not a significant predictor (Table 3). Model 2 (Table 3) could explain a significant proportion of the variance in depression (R2=0.32, F5,1129=107.40, p<0.001, f2=0.69) and in anxiety (R2=0.37, F5,1129=134.20, p<0.001, f2=0.77).
Hierarchical regression model of the predictors for depression (PHQ-9) and anxiety (GAD-7) symptoms.
| Predictors | Depression | Anxiety | ||||
|---|---|---|---|---|---|---|
| B | SE | R2 | B | SE | R2 | |
| Model 1 | ||||||
| Age | −0.11*** | 0.01 | −0.06*** | 0.01 | ||
| Education | −2.10*** | 0.41 | −0.95*** | 0.30 | ||
| Sex | −1.97*** | 0.36 | −1.50*** | 0.26 | ||
| Presence of medical conditions | 0.07** | 0.02 | 0.04** | 0.02 | ||
| 0.15 | 0.09 | |||||
| Model 2 | ||||||
| Age | −0.12*** | 0.01 | −0.06*** | 0.01 | ||
| Education | −2.27*** | 0.37 | −1.14*** | 0.25 | ||
| Sex | −1.14*** | 0.32 | −0.75*** | 0.22 | ||
| Presence of medical conditions | 0.05* | 0.02 | 0.02 | 0.01 | ||
| Factor 2 (CPDI) – “rumination in the context of COVID-19 pandemics” | 4.36*** | 0.26 | 3.98*** | 0.18 | ||
| 0.32 | 0.37 | |||||
PHQ-9: patient health questionnaire 9 items; GAD-7: generalized anxiety disorder 7 items; CPDI: COVID-19 peritraumatic distress index; B: regression coefficient; SE: standard error; R2: coefficient of determination.
Finally, both regression models were compared concerning their variance explanations. The comparison of the regression models confirmed that R2 increase was significant for depression (F1,1129=288.19, p<0.001) and for anxiety (F1,1129=510.79, p<0.001).
DiscussionOur factorial analyses revealed that the CPDI consisted of a two-factor structure (“stress in the context of COVID-19 pandemics” and “rumination in the context of COVID-19 pandemics”). During the analysis, 3 of the 24 original items were eliminated since 2 showed correlation values under the threshold (items 8 and 11), and 1 showed a low factor loading (item 7). With these modifications, our two-factor model showed good consistency and model fitness, replicating the results of the construct validity study in Spain.18 Other studies have asseverated the unidimensional structure of the CPDI, which we, in line with our results and the previous evidence, do not support.11
In addition, our model explaining depression through CPDI values, anxiety symptoms, and three main socio-economic variables (age, sex, and completed education) demonstrated a significant amount of variance (i.e., 81%) concerning depression symptomatology. The theoretical derivation of our model is similar to a previous study with the construct “loneliness”.48 In this case, there was a causal relationship between CPDI and depression, finding anxiety and loneliness as mediators.48 Similar to this study, we saw in the SEM that higher COVID-related stress, measured through CPDI, leads to higher anxiety symptoms and increasing depression when the above-mentioned socio-economic variables are included in the model. In this case, being female, younger, and having incomplete education lead also, with higher CPDI and anxiety values, to depression. On the other hand, our data with SEM is consistent with previous research in which old age, male gender, and high education are protective factors.49 Similar to our results, a prior study in Peru established through SEM different causal models for anxiety, COVID-related stress, and depression during the COVID-19 lockdown.50 However, our model showed a better fit and explained a higher variance percentage than this previous study. The differences in the variance explanation in both studies could be due to the fact that we used peritraumatic stress, whereas the other Peruvian study considered posttraumatic stress as a predictor of depressive symptoms. It is plausible that the acute stress state during the COVID-19 pandemic (and associated lockdowns and constraints) may have a greater impact on well-being than perceived stress after pandemic peaks have been reached. CPDI thus appears to be an appropriate measure to predict current stress on psychological well-being, especially during peak phases of the COVID-19 pandemic in Peru, where the mortality reached its higher point between April 2020 and July 2021.51 Finally, one could interpret our results concerning the SEM explaining depression symptoms with Lewinsohn's behavioral theory of depression, specifically with the amplifier loss theory.52,53 People with high COVID-related stress are more afraid of the consequences and avoid, for instance, many social events and human contact. In this case, the amplifier could be considered as withdrawn behavior due to COVID-19, and through this amplifier, depression can develop easily, supporting our model.
Distinguishing between the CPDI factors “rumination” and “stress” enables individual aspects of the COVID-19-related stress to be examined. While the factor “stress” overlapped heavily with depression and anxiety symptoms (i.e., collinearity), this was not the case with the factor “rumination”, demonstrating a suitable predictor for both disorders and increasing the explained variance in the regression model up to 32% (depression) and 37% (anxiety). Although “rumination” showed a greater increase of explained variance for anxiety symptoms, and rumination is most frequent in the clinical presentation of anxiety disorders,54–57 our results revealed that this CPDI factor is relevant to both disorders since the variance was significantly affected after the inclusion of this factor. Finally, “rumination” was useful to consider as a predictor since there is no suspicion of collinearity, as with “stress”, in already well-studied constructs, such as anxiety and depression.
Although our results demonstrate the construct validity of the CPDI, a suitable model explaining depression symptoms by means of COVID-related stress, socio-economic variables and anxiety, and a regression model that explains depression and anxiety through “rumination” (a CPDI factor), there are some limitations that might be considered. The cross-sectional allows us to infer causality through the SEM model but not confirm it. In addition, the floor effect obtained in each item and skewness of the CPDI data are concomitant with the items’ ordinal nature. Moreover, the snowball sampling method to recollect the sample size, which could contravene the principles of randomization of a sample. Furthermore, including only participants from Lima and not from other provinces or cities of Peru might also represent a limitation for extrapolating the results, since the socio-economic and cultural characteristics may differ between population groups outside and inside Lima. Finally, the selection bias produced due to the distribution of our online survey only through different social media platforms, restricting the participation of those who did not have access to internet or an account to these social media and losing thus potential data.
ConclusionsIn conclusion, our factor analysis results showed a 2-factor solution for the CPDI (“rumination” and “stress”), which was posteriorly confirmed in another subsample. Moreover, we conclude that our SEM data showed that female sex, younger age, incomplete education, high COVID-related stress, and anxiety explained depression symptoms robustly during the COVID lockdown. In addition, the CPDI factor “rumination” explained a great proportion of the explained variance for depression and anxiety. This means that people who frequently ruminate are more afraid of the COVID-19 consequences and negatively emotionally affected by the COVID-19 pandemics.
Finally, the CPDI represents an auspicious instrument for COVID-19-related stress, being able to register negative psychological influences of the COVID-19 lockdown and also as a screening test. This instrument may be useful for measuring COVID-19-related stress and, in our case, consisted of two factors “stress” and “rumination”. The constructs of this Latin American Spanish CPDI version were demonstrated to be valid in a Peruvian population and replying similar results of a European Spanish CPDI version published elsewhere.18 Future studies should concentrate on expanding the established model of depression with other variables, e.g., family history of mental disorders or physical symptoms. Moreover, future studies should also focus on the effects of rumination on mental health deterioration and COVID-19 infection. In addition, future research could focus on developing specific interventions to attenuate this rumination. Because the consequences of the pandemic affect large segments of the population, policymakers should encourage the development and accessibility of such interventions. Since there are already survivors of the COVID-19 infection, it would be interesting for future studies to apply a similar study to those who survived the COVID-19 infection and to find differences between both data.
Ethical approval and consent to participateEach participant or their legally authorized representative was fully informed about the objectives and procedures of the study, as well as the potential adverse effects, and gave their written consent to participate. The study protocol and all study procedures were reviewed and approved by the ethics committee of the Peruvian University Cayetano Heredia (Lima, Peru). Additionally, this study was carried out according to the Helsinki Declaration.
Authors’ contributionsBPP developed the idea for the study, wrote the introduction, performed part of the data analysis, contributed to the methods section, wrote the discussion section, and worked on all other parts of the manuscript preparation, including proofreading.
FB developed the idea for the study, wrote the introduction, performed part of the data analysis, contributed to the methods section, wrote the discussion section, and worked on all other parts of the manuscript preparation, including proofreading.
MAF contributed to the organization of the study, with the participants’ recruitment and the methods. He participated in the preparation of the discussion section and in the proofreading of the manuscript.
VAA contributed to the organization of the study and to the participants’ recruitment. He participated in the preparation of the introduction section and in the proofreading of the manuscript.
HKM developed the idea for the study, supervised the data collection, the methods, and the analyses, and worked on proofreading the manuscript.
FundingThis study was not supported financially by any institution.
Conflict of interestsThe authors declare no conflict of interests.
The authors of this paper would like to thank Dr. Mauricio Dancuart-Mendoza for helping to recruit the participants during the period 2020–2021 of the COVID-19 Pandemics. Finally, we would like to thank Dr. Joaquin Vizcarra for his contributions to the English language.
